Industries > Aviation > Intelligent Automation in Aerospace & Defence Market Report 2020-2030

Intelligent Automation in Aerospace & Defence Market Report 2020-2030
Forecasts PLUS Profiles of Leading Companies and Regional and Leading National Market Analysis
Intelligent Automation in Aerospace & Defence market is driven by adoption of emerging technologies such as robotic process automation, machine learning, cognitive analysis, artificial intelligence and predictive technology and is set to grow to US$xyz billion by 2030.
To access the data contained in this document please email contactus@visiongain.com
Fuel efficiency is one of the main goals for aerospace companies, because only minor changes in fuel usage in aircraft can have a significant effect on the bottom line and pollution of a business. The manufacture of lightweight aircraft parts is now becoming a reality, in combination with 3D printing. The AI-powered devices can help to improve fuel usage in this field. For instance, a machine learning tool has been developed by the French company Safety Line that can optimize pilots’ climbing profiles before each flight. Since an aircraft consumes fuel at the highest rate during the climb phase, considerable fuel savings can be achieved by optimizing this stage. French carrier Air Austral has already adopted the solution for Safety Line and hopes to save up to 6% of fuel during the climbing process.
This report includes data analysis and invaluable insight into how COVID-19 will affect your industry. Access this report today.
Drivers
• Artificial intelligence can help in tackling cybersecurity concerns across aerospace & defence industry
• Collaborations and joint ventures of leading startups with established companies to manufacture intelligent automation products
• Implementation of artificial intelligence in aviation helps in reducing cost across the value chain
Challenges
• Artificial intelligence technology replacing human pilots
• Implementation and maintenance of artificial intelligence products is costly
• Stringent safety requirements and data privacy concerns
Key players:
• Microsoft Corporation
• Intel Corporation
• NVIDIA
• IBM
• Micron
• Samsung
• Xilinx
• Amazon
• Airbus
• Boeing
• General Electric
• Thales
• Lockheed Martin
• Garmin
• SITA
• Iris Automation Inc.
To access the data contained in this document please email contactus@visiongain.com
Buy our report today Intelligent Automation in Aerospace & Defence Market Report 2020-2030: Forecasts PLUS Profiles of Leading Companies and Regional and Leading National Market Analysis. Avoid missing out by staying informed – order our report now.
Visiongain is a trading partner with the US Federal Government
CCR Ref number: KD4R6
Do you have any custom requirements we can help you with? Any need for specific country, geo region, market segment or specific company information? Contact us today, we can discuss your needs and see how we can help: sara.peerun@visiongain.com
1. Report Overview
1.1. Global Intelligent Automation in Aerospace & Defence Market Overview
1.2. Why You Should Read This Report
1.3. How This Report Delivers
1.4. Key Questions Answered by This Analytical Report Include:
1.5. Who is This Report For?
1.6. Methodology
1.6.1. Primary Research
1.6.2. Secondary Research
1.6.3. Market Evaluation & Forecasting Methodology
1.7. Frequently Asked Questions (FAQ)
1.8. Associated Visiongain Reports
1.9. About Visiongain
2. Introduction to the Intelligent Automation in Aerospace & Defence Market
2.1. Intelligent Automation in Aerospace & Defence Market Structure
2.2. Intelligent Automation in Aerospace & Defence Market Definition
2.3. Intelligent Automation in Aerospace & Defence Component Submarkets Definition
2.3.1. Intelligent Automation in Aerospace & Defence Hardware Submarket Definition
2.3.2. Intelligent Automation in Aerospace & Defence Software Submarket Definition
2.3.3. Intelligent Automation in Aerospace & Defence Software Submarket Definition
2.4. Intelligent Automation in Aerospace & Defence Application Submarkets Definition
2.4.1. Intelligent Automation in Aerospace & Defence Military Submarkets Definition
2.4.2. Intelligent Automation in Aerospace & Defence Commercial Aviation Submarkets Definition
2.4.3. Intelligent Automation in Aerospace & Defence Space Submarkets Definition
3. Market Dynamics
3.1. Market Drivers
3.1.1. Implementation of AI in aviation helps in reducing cost across the value chain
3.1.2. Increase fuel efficiency by reducing consumption
3.1.3. AI can help in tackling cybersecurity concerns across A&D industry
3.2. Market Challenges
3.2.1. Artificial intelligence technology replacing human pilots
3.2.2. Artificial intelligence is costly
3.2.3. Stringent safety requirements and data privacy concerns
3.3. Market Opportunities
3.3.1. Growing number of AI application
3.4. List of The Countries Which Have/Are About to Announce Their Artificial Intelligence National Strategy
3.5. SWOT Analysis
3.5.1. Strengths
3.5.1.1. Increasing investments across A&D industry
3.5.1.2. Growing number of start-ups
3.5.2. Weakness
3.5.2.1. High manufacturing costs
3.5.3. Threats
3.5.3.1. Increasing cyber attacks
3.5.3.2. Market is dominated by few major players
3.5.4. Opportunities
3.5.4.1. Technological advancements
3.6. Porters Five Forces Analysis
3.6.1. Bargaining Power of Suppliers
3.6.2. Bargaining Power of Buyers
3.6.3. Threat of New Entrant
3.6.4. Threat of Substitute
3.6.5. Competitive Rivalry
4. Global Intelligent Automation in Aerospace & Defence Market 2020-2030 – Before Covid-19
4.1. Global Intelligent Automation in Aerospace & Defence Market Forecast 2020-2030 – Before Covid-19
5. Global Intelligent Automation in Aerospace & Defence Market 2020-2030 – After Covid-19
5.1. Global Intelligent Automation in Aerospace & Defence Market Forecast 2020-2030 – After Covid-19
6. Global Intelligent Automation in Aerospace & Defence by Component Submarket Forecast 2020-2030
6.1. Introduction
6.2. Hardware Submarket Analysis
6.3. Software Submarket Analysis
6.4. Services Submarket Analysis
7. Global Intelligent Automation in Aerospace & Defence by Application Submarket Forecast 2020-2030
7.1. Introduction
7.2. Military Submarket Analysis
7.3. Commercial Aviation Submarket Analysis
7.4. Space Analysis Submarket Analysis
8. Global Intelligent Automation in Aerospace & Defence Market Forecast by Region 2020-2030
8.1. Introduction
8.2. Regional Intelligent Automation in Aerospace & Defence Market Forecast 2020-2030
8.3. North America Intelligent Automation in Aerospace & Defence Market Forecast 2020-2030
8.3.1. North America Intelligent Automation in Aerospace & Defence Market by Component Submarkets Forecast 2020-2030
8.3.2. North America Intelligent Automation in Aerospace & Defence Market by Application Submarkets Forecast 2020-2030
8.3.3. North America Intelligent Automation in Aerospace & Defence Market Analysis 2020 – 2030
8.3.4. United States Intelligent Automation in Aerospace & Defence Market Forecast 2020-2030
8.3.4.1. United States Intelligent Automation in Aerospace & Defence Market by Component Submarkets Forecast 2020-2030
8.3.4.2. United States Intelligent Automation in Aerospace & Defence Market by Application Submarkets Forecast 2020-2030
8.3.4.3. United States Intelligent Automation in Aerospace & Defence Market Analysis 2020 - 2030
8.3.5. Canada Intelligent Automation in Aerospace & Defence Market Forecast 2020-2030
8.3.5.1. Canada Intelligent Automation in Aerospace & Defence Market by Component Submarkets Forecast 2020-2030
8.3.5.2. Canada Intelligent Automation in Aerospace & Defence Market by Application Submarkets Forecast 2020-2030
8.3.5.3. Canada Intelligent Automation in Aerospace & Defence Market Analysis 2020 - 2030
8.4. Europe Intelligent Automation in Aerospace & Defence Market Forecast 2020-2030
8.4.1. Europe Intelligent Automation in Aerospace & Defence Market by Component Submarkets Forecast 2020-2030
8.4.2. Europe Intelligent Automation in Aerospace & Defence Market by Application Submarkets Forecast 2020-2030
8.4.3. Europe Intelligent Automation in Aerospace & Defence Market Analysis 2020 – 2030
8.4.4. Germany Intelligent Automation in Aerospace & Defence Market Forecast 2020-2030
8.4.4.1. Germany Intelligent Automation in Aerospace & Defence Market by Component Submarkets Forecast 2020-2030
8.4.4.2. Germany Intelligent Automation in Aerospace & Defence Market by Application Submarkets Forecast 2020-2030
8.4.4.3. Germany Intelligent Automation in Aerospace & Defence Market Analysis 2020 - 2030
8.4.5. France Intelligent Automation in Aerospace & Defence Market Forecast 2020-2030
8.4.5.1. France Intelligent Automation in Aerospace & Defence Market by Component Submarkets Forecast 2020-2030
8.4.5.2. France Intelligent Automation in Aerospace & Defence Market by Application Submarkets Forecast 2020-2030
8.4.5.3. France Intelligent Automation in Aerospace & Defence Market Analysis 2020 - 2030
8.4.6. United Kingdom Intelligent Automation in Aerospace & Defence Market Forecast 2020-2030
8.4.6.1. United Kingdom Intelligent Automation in Aerospace & Defence Market by Component Submarkets Forecast 2020-2030
8.4.6.2. United Kingdom Intelligent Automation in Aerospace & Defence Market by Application Submarkets Forecast 2020-2030
8.4.6.3. United Kingdom Intelligent Automation in Aerospace & Defence Market Analysis 2020 - 2030
8.4.7. Italy Intelligent Automation in Aerospace & Defence Market Forecast 2020-2030
8.4.7.1. Italy Intelligent Automation in Aerospace & Defence Market by Component Submarkets Forecast 2020-2030
8.4.7.2. Italy Intelligent Automation in Aerospace & Defence Market by Application Submarkets Forecast 2020-2030
8.4.7.3. Italy Intelligent Automation in Aerospace & Defence Market Analysis 2020 - 2030
8.4.8. Russia Intelligent Automation in Aerospace & Defence Market Forecast 2020-2030
8.4.8.1. Russia Intelligent Automation in Aerospace & Defence Market by Component Submarkets Forecast 2020-2030
8.4.8.2. Russia Intelligent Automation in Aerospace & Defence Market by Application Submarkets Forecast 2020-2030
8.4.8.3. Russia Intelligent Automation in Aerospace & Defence Market Analysis 2020 - 2030
8.4.9. Rest of Europe Intelligent Automation in Aerospace & Defence Market Forecast 2020-2030
8.4.9.1. Rest of Europe Intelligent Automation in Aerospace & Defence Market by Component Submarkets Forecast 2020-2030
8.4.9.2. Rest of Europe Intelligent Automation in Aerospace & Defence Market by Application Submarkets Forecast 2020-2030
8.4.9.3. Rest of Europe Intelligent Automation in Aerospace & Defence Market Analysis 2020 - 2030
8.5. Asia Pacific Intelligent Automation in Aerospace & Defence Market Forecast 2020-2030
8.5.1. Asia Pacific Intelligent Automation in Aerospace & Defence Market by Component Submarkets Forecast 2020-2030
8.5.2. Asia Pacific Intelligent Automation in Aerospace & Defence Market by Application Submarkets Forecast 2020-2030
8.5.3. Asia Pacific Intelligent Automation in Aerospace & Defence Market Analysis 2020 – 2030
8.5.4. China Intelligent Automation in Aerospace & Defence Market Forecast 2020-2030
8.5.4.1. China Intelligent Automation in Aerospace & Defence Market by Component Submarkets Forecast 2020-2030
8.5.4.2. China Intelligent Automation in Aerospace & Defence Market by Application Submarkets Forecast 2020-2030
8.5.4.3. China Intelligent Automation in Aerospace & Defence Market Analysis 2020 - 2030
8.5.5. Japan Intelligent Automation in Aerospace & Defence Market Forecast 2020-2030
8.5.5.1. Japan Intelligent Automation in Aerospace & Defence Market by Component Submarkets Forecast 2020-2030
8.5.5.2. Japan Intelligent Automation in Aerospace & Defence Market by Application Submarkets Forecast 2020-2030
8.5.5.3. Japan Intelligent Automation in Aerospace & Defence Market Analysis 2020 - 2030
8.5.6. India Intelligent Automation in Aerospace & Defence Market Forecast 2020-2030
8.5.6.1. India Intelligent Automation in Aerospace & Defence Market by Component Submarkets Forecast 2020-2030
8.5.6.2. India Intelligent Automation in Aerospace & Defence Market by Application Submarkets Forecast 2020-2030
8.5.6.3. India Intelligent Automation in Aerospace & Defence Market Analysis 2020 - 2030
8.5.7. Rest of Asia Pacific Intelligent Automation in Aerospace & Defence Market Forecast 2020-2030
8.5.7.1. Rest of Asia Pacific Intelligent Automation in Aerospace & Defence Market by Component Submarkets Forecast 2020-2030
8.5.7.2. Rest of Asia Pacific Intelligent Automation in Aerospace & Defence Market by Application Submarkets Forecast 2020-2030
8.5.7.3. Rest of Asia Pacific Intelligent Automation in Aerospace & Defence Market Analysis 2020 - 2030
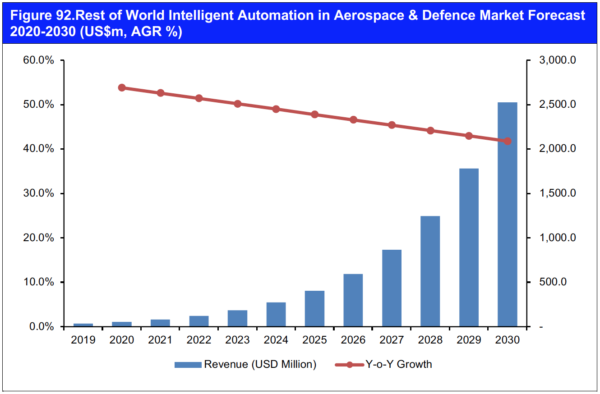
8.6. Rest of World Intelligent Automation in Aerospace & Defence Market Forecast 2020-2030
8.6.1. Rest of World Intelligent Automation in Aerospace & Defence Market by Component Submarkets Forecast 2020-2030
8.6.2. Rest of World Intelligent Automation in Aerospace & Defence Market by Application Submarkets Forecast 2020-2030
8.6.3. Rest of World Intelligent Automation in Aerospace & Defence Market Analysis 2020 – 2030
9. Market Competitiveness
10. Key Industry Players
10.1. Microsoft Corporation
10.1.1. Microsoft Corporation Total Company Sales 2015-2019
10.1.2. Microsoft Corporation Sales by Business Segment 2019 (%)
10.1.3. Microsoft Corporation Net Income 2015-2019
10.1.4. Microsoft Corporation Sales by Geographical Location, 2019 (%)
10.1.5. Microsoft Corporation Recent Developments
10.1.6. Microsoft Corporation Analysis
10.2. Intel Corporation
10.2.1. Intel Corporation Total Company Sales 2015-2019
10.2.2. Intel Corporation Sales by Business Segment 2019 (%)
10.2.3. Intel Net Income 2015-2019
10.2.4. Intel Recent Developments
10.2.5. Intel Future Outlook
10.3. NVIDIA
10.3.1. Nvidia Total Company Sales 2015-2019
10.3.2. Nvidia Sales by Business Segment 2019 (%)
10.3.3. Nvidia Net Income 2015-2019
10.3.4. Nvidia Sales by Geographical Location, 2019 (%)
10.3.5. Nvidia Recent Developments
10.4. IBM
10.4.1. IBM Total Company Sales 2015-2019
10.4.2. IBM Sales by Business Segment 2019 (%)
10.4.3. IBM Net Income 2015-2019
10.4.4. IBM Sales by Geographical Location, 2019 (%)
10.4.5. IBM Recent Developments
10.4.6. IBM Analysis
10.5. Micron
10.5.1. Micron Total Company Sales 2015-2018
10.5.2. Micron Sales by Business Segment 2018 (%)
10.5.3. Micron Net Income 2015-2018
10.5.4. Micron Sales by Geographical Location, 2018 (%)
10.5.5. Micron Analysis
10.6. Samsung
10.6.1. Samsung Total Company Sales 2015-2019
10.6.2. Samsung Recent Developments
10.6.3. Samsung Analysis
10.7. Xilinx
10.7.1. Xilinx Total Company Sales 2015-2018
10.7.2. Xilinx Sales by Business Segment 2018 (%)
10.7.3. Xilinx Net Income 2015-2018
10.7.4. Xilinx Sales by Geographical Location, 2018 (%)
10.7.5. Xilinx Recent Developments
10.7.6. Xilinx Analysis
10.8. Amazon
10.8.1. Amazon Total Company Sales 2015-2018
10.8.2. Amazon Net Income 2015-2018
10.8.3. Amazon Sales by Geographical Location, 2018 (%)
10.8.4. Amazon Recent Developments
10.8.5. Amazon Analysis
10.9. Airbus
10.9.1. Airbus Total Company Sales 2015-2019
10.9.2. Airbus Sales by Business Segment 2019 (%)
10.9.3. Airbus Net Income 2015-2019
10.9.4. Airbus Sales by Geographical Location, 2019 (%)
10.9.5. Airbus Recent Developments
10.9.6. Airbus Analysis
10.10. Boeing
10.10.1. Boeing Total Company Sales 2015-2019
10.10.2. Boeing Sales by Business Segment 2019 (%)
10.10.3. Boeing Net Income 2015-2019
10.10.4. Boeing Recent Developments
10.10.5. Boeing Analysis
10.11. General Electric
10.11.1. General Electric Total Company Sales 2015-2019
10.11.2. General Electric Sales by Business Segment 2019 (%)
10.11.3. General Electric Sales by Geographical Location, 2019 (%)
10.11.4. General Electric Recent Developments
10.11.5. General Electric Analysis
10.12. Thales
10.12.1. Thales Total Company Sales 2015-2019
10.12.2. Thales Sales by Business Segment 2019 (%)
10.12.3. Thales Net Income 2015-2019
10.12.4. Thales Sales by Geographical Location, 2019 (%)
10.12.5. Thales Recent Developments
10.12.6. Thales Analysis
10.13. Lockheed Martin
10.13.1. Lockheed Martin Total Company Sales 2015-2019
10.13.2. Lockheed Martin Sales by Business Segment 2019 (%)
10.13.3. Lockheed Martin Sales by Geographical Location, 2019 (%)
10.13.4. Lockheed Martin Recent Developments
10.13.5. Lockheed Martin Analysis
10.14. Garmin
10.14.1. Garmin Total Company Sales 2015-2018
10.14.2. Garmin Sales by Business Segment 2019 (%)
10.14.3. Garmin Sales by Geographical Location, 2019 (%)
10.14.4. Garmin Recent Developments
10.14.5. Garmin Analysis
10.15. SITA
10.15.1. SITA Recent Developments
10.15.2. SITA Analysis
10.16. Iris Automation Inc.
10.16.1. Iris Automation Recent Developments
11. Conclusions and Recommendations
12. Glossary
12.1. Glossary
12.2. Visiongain Report Sales Order Form
12.3. Appendix A
About Visiongain
12.4. Appendix B
List of Tables
Table 1. Global Intelligent Automation in Aerospace & Defence Market Forecast 2020-2030 (US$m, AGR %, Cumulative)
Table 2. List of The Countries Which Have/Are About to Announce Their Artificial Intelligence National Strategy
Table 3. Key Factors Affecting the Bargaining Power of Suppliers
Table 4. Key Factors Affecting the Bargaining Power of Buyers
Table 5. Key Factors Affecting the Threat of New Entrant
Table 6. Key Factors Affecting the Threat of Substitute
Table 7. Key Factors Affecting the Competitive Rivalry
Table 8. Global Intelligent Automation in Aerospace & Defence Market Forecast 2020-2030 (US$m, AGR %, Cumulative)
Table 9. Global Intelligent Automation in Aerospace & Defence Market Forecast 2020-2030 (CAGR %)
Table 10. Global Intelligent Automation in Aerospace & Defence By Region Forecast 2020-2030 (US$m, AGR %, CAGR)
Table 11. Global Intelligent Automation in Aerospace & Defence By Region Forecast 2020-2030 (Cumulative and CAGR %)
Table 12. Global Intelligent Automation in Aerospace & Defence Market Forecast 2020-2030 (US$m, AGR %, Cumulative)
Table 13. Global Intelligent Automation in Aerospace & Defence Market Forecast 2020-2030 (CAGR %)
Table 14. Global Intelligent Automation in Aerospace & Defence By Region Forecast 2020-2030 (US$m, AGR %, CAGR)
Table 15. Global Intelligent Automation in Aerospace & Defence By Region Forecast 2020-2030 (Cumulative and CAGR %)
Table 16. Global Intelligent Automation in Aerospace & Defence By Component Submarket Forecast 2020-2030 (US$m, AGR %, CAGR)
Table 17. Global Intelligent Automation in Aerospace & Defence By Component Forecast 2020-2030 (Cumulative and CAGR %)
Table 18. Timeline of the main hardware discoveries that have influenced the evolution of an AI system
Table 19. Global Intelligent Automation in Aerospace & Defence By Application Submarket Forecast 2020-2030 (US$m, AGR %, CAGR)
Table 20. Global Intelligent Automation in Aerospace & Defence By Application Forecast 2020-2030 (Cumulative and CAGR %)
Table 21. Regional Intelligent Automation in Aerospace & Defence Market Forecast 2020-2030 (US$m, Global AGR %, CAGR %)
Table 22. Global Intelligent Automation in Aerospace & Defence By Region Forecast 2020-2030 (Cumulative and CAGR %)
Table 23. North America Intelligent Automation in Aerospace & Defence Market by Component Submarkets Forecast 2020-2030 (US$m, AGR %, CAGR %)
Table 24. North America Intelligent Automation in Aerospace & Defence By Component Forecast 2020-2030 (Cumulative and CAGR %)
Table 25. North America Intelligent Automation in Aerospace & Defence Market by Application Submarkets Forecast 2020-2030 (US$m, AGR %, CAGR %)
Table 26. North America Intelligent Automation in Aerospace & Defence By Application Forecast 2020-2030 (Cumulative and CAGR %)
Table 27. United States Intelligent Automation in Aerospace & Defence Market by Component Submarkets Forecast 2020-2030 (US$m, AGR %, CAGR %)
Table 28. United States Intelligent Automation in Aerospace & Defence By Component Forecast 2020-2030 (Cumulative and CAGR %)
Table 29. United States Intelligent Automation in Aerospace & Defence Market by Application Submarkets Forecast 2020-2030 (US$m, AGR %, CAGR %)
Table 30. United States Intelligent Automation in Aerospace & Defence By Application Forecast 2020-2030 (Cumulative and CAGR %)
Table 31. Canada Intelligent Automation in Aerospace & Defence Market by Component Submarkets Forecast 2020-2030 (US$m, AGR %, CAGR %)
Table 32. Canada Intelligent Automation in Aerospace & Defence By Component Forecast 2020-2030 (Cumulative and CAGR %)
Table 33. Canada Intelligent Automation in Aerospace & Defence Market by Application Submarkets Forecast 2020-2030 (US$m, AGR %, CAGR %)
Table 34. Canada Intelligent Automation in Aerospace & Defence By Application Forecast 2020-2030 (Cumulative and CAGR %)
Table 35. Europe Intelligent Automation in Aerospace & Defence Market by Component Submarkets Forecast 2020-2030 (US$m, AGR %, CAGR %)
Table 36. Europe Intelligent Automation in Aerospace & Defence By Component Forecast 2020-2030 (Cumulative and CAGR %)
Table 37. Europe Intelligent Automation in Aerospace & Defence Market by Application Submarkets Forecast 2020-2030 (US$m, AGR %, CAGR %)
Table 38. Europe Intelligent Automation in Aerospace & Defence By Application Forecast 2020-2030 (Cumulative and CAGR %)
Table 39. Germany Intelligent Automation in Aerospace & Defence Market by Component Submarkets Forecast 2020-2030 (US$m, AGR %, CAGR %)
Table 40. Germany Intelligent Automation in Aerospace & Defence By Component Forecast 2020-2030 (Cumulative and CAGR %)
Table 41. Germany Intelligent Automation in Aerospace & Defence Market by Application Submarkets Forecast 2020-2030 (US$m, AGR %, CAGR %)
Table 42. Germany Intelligent Automation in Aerospace & Defence By Application Forecast 2020-2030 (Cumulative and CAGR %)
Table 43. France Intelligent Automation in Aerospace & Defence Market by Component Submarkets Forecast 2020-2030 (US$m, AGR %, CAGR %)
Table 44. France Intelligent Automation in Aerospace & Defence By Component Forecast 2020-2030 (Cumulative and CAGR %)
Table 45. France Intelligent Automation in Aerospace & Defence Market by Application Submarkets Forecast 2020-2030 (US$m, AGR %, CAGR %)
Table 46. France Intelligent Automation in Aerospace & Defence By Application Forecast 2020-2030 (Cumulative and CAGR %)
Table 47. United Kingdom Intelligent Automation in Aerospace & Defence Market by Component Submarkets Forecast 2020-2030 (US$m, AGR %, CAGR %)
Table 48. United Kingdom Intelligent Automation in Aerospace & Defence By Component Forecast 2020-2030 (Cumulative and CAGR %)
Table 49. United Kingdom Intelligent Automation in Aerospace & Defence Market by Application Submarkets Forecast 2020-2030 (US$m, AGR %, CAGR %)
Table 50. United Kingdom Intelligent Automation in Aerospace & Defence By Application Forecast 2020-2030 (Cumulative and CAGR %)
Table 51. Italy Intelligent Automation in Aerospace & Defence Market by Component Submarkets Forecast 2020-2030 (US$m, AGR %, CAGR %)
Table 52. Italy Intelligent Automation in Aerospace & Defence By Component Forecast 2020-2030 (Cumulative and CAGR %)
Table 53. Italy Intelligent Automation in Aerospace & Defence Market by Application Submarkets Forecast 2020-2030 (US$m, AGR %, CAGR %)
Table 54. Italy Intelligent Automation in Aerospace & Defence By Application Forecast 2020-2030 (Cumulative and CAGR %)
Table 55. Russia Intelligent Automation in Aerospace & Defence Market by Component Submarkets Forecast 2020-2030 (US$m, AGR %, CAGR %)
Table 56. Russia Intelligent Automation in Aerospace & Defence By Component Forecast 2020-2030 (Cumulative and CAGR %)
Table 57. Russia Intelligent Automation in Aerospace & Defence Market by Application Submarkets Forecast 2020-2030 (US$m, AGR %, CAGR %)
Table 58. Russia Intelligent Automation in Aerospace & Defence By Application Forecast 2020-2030 (Cumulative and CAGR %)
Table 59. Rest of Europe Intelligent Automation in Aerospace & Defence Market by Component Submarkets Forecast 2020-2030 (US$m, AGR %, CAGR %)
Table 60. Rest of Europe Intelligent Automation in Aerospace & Defence By Component Forecast 2020-2030 (Cumulative and CAGR %)
Table 61. Rest of Europe Intelligent Automation in Aerospace & Defence Market by Application Submarkets Forecast 2020-2030 (US$m, AGR %, CAGR %)
Table 62. Rest of Europe Intelligent Automation in Aerospace & Defence By Application Forecast 2020-2030 (Cumulative and CAGR %)
Table 63. Asia Pacific Intelligent Automation in Aerospace & Defence Market by Component Submarkets Forecast 2020-2030 (US$m, AGR %, CAGR %)
Table 64. Asia Pacific Intelligent Automation in Aerospace & Defence By Component Forecast 2020-2030 (Cumulative and CAGR %)
Table 65. Asia Pacific Intelligent Automation in Aerospace & Defence Market by Application Submarkets Forecast 2020-2030 (US$m, AGR %, CAGR %)
Table 66. Asia Pacific Intelligent Automation in Aerospace & Defence By Application Forecast 2020-2030 (Cumulative and CAGR %)
Table 67. China Intelligent Automation in Aerospace & Defence Market by Component Submarkets Forecast 2020-2030 (US$m, AGR %, CAGR %)
Table 68. China Intelligent Automation in Aerospace & Defence By Component Forecast 2020-2030 (Cumulative and CAGR %)
Table 69. China Intelligent Automation in Aerospace & Defence Market by Application Submarkets Forecast 2020-2030 (US$m, AGR %, CAGR %)
Table 70. China Intelligent Automation in Aerospace & Defence By Application Forecast 2020-2030 (Cumulative and CAGR %)
Table 71. Japan Intelligent Automation in Aerospace & Defence Market by Component Submarkets Forecast 2020-2030 (US$m, AGR %, CAGR %)
Table 72. Japan Intelligent Automation in Aerospace & Defence By Component Forecast 2020-2030 (Cumulative and CAGR %)
Table 73. Japan Intelligent Automation in Aerospace & Defence Market by Application Submarkets Forecast 2020-2030 (US$m, AGR %, CAGR %)
Table 74. Japan Intelligent Automation in Aerospace & Defence By Application Forecast 2020-2030 (Cumulative and CAGR %)
Table 75. India Intelligent Automation in Aerospace & Defence Market by Component Submarkets Forecast 2020-2030 (US$m, AGR %, CAGR %)
Table 76. India Intelligent Automation in Aerospace & Defence By Component Forecast 2020-2030 (Cumulative and CAGR %)
Table 77. India Intelligent Automation in Aerospace & Defence Market by Application Submarkets Forecast 2020-2030 (US$m, AGR %, CAGR %)
Table 78. India Intelligent Automation in Aerospace & Defence By Application Forecast 2020-2030 (Cumulative and CAGR %)
Table 79. Rest of Asia Pacific Intelligent Automation in Aerospace & Defence Market by Component Submarkets Forecast 2020-2030 (US$m, AGR %, CAGR %)
Table 80. Rest of Asia Pacific Intelligent Automation in Aerospace & Defence By Component Forecast 2020-2030 (Cumulative and CAGR %)
Table 81. Rest of Asia Pacific Intelligent Automation in Aerospace & Defence Market by Application Submarkets Forecast 2020-2030 (US$m, AGR %, CAGR %)
Table 82. Rest of Asia Pacific Intelligent Automation in Aerospace & Defence By Application Forecast 2020-2030 (Cumulative and CAGR %)
Table 83. Rest of World Intelligent Automation in Aerospace & Defence Market by Component Submarkets Forecast 2020-2030 (US$m, AGR %, CAGR %)
Table 84. Rest of World Intelligent Automation in Aerospace & Defence By Component Forecast 2020-2030 (Cumulative and CAGR %)
Table 85. Rest of World Intelligent Automation in Aerospace & Defence Market by Application Submarkets Forecast 2020-2030 (US$m, AGR %, CAGR %)
Table 86. Rest of the World Intelligent Automation in Aerospace & Defence By Application Forecast 2020-2030 (Cumulative and CAGR %)
Table 87. Microsoft Corporation Profile (CEO, Total Company Sales US$ million, Net Income US$m, Strongest Business Region, Submarket Involvement, HQ, Founded, No. of Employees, Website) 2019
Table 88. Microsoft Corporation Total Company Sales 2015-2019 (US$m, AGR%)
Table 89. Microsoft Corporation Net Income 2015-2019 (US$m, AGR%)
Table 90. Intel Corporation Profile (CEO, Total Company Sales US$ billion, Net Income US$m, Strongest Business Region, Submarket Involvement, HQ, Founded, No. of Employees, Website) 2019
Table 91. Intel Corporation Total Company Sales 2015-2019 (US$ billion, AGR%)
Table 92. Intel Net Income 2015-2019 (US$m, AGR%)
Table 93. Nvidia Profile (CEO, Total Company Sales US$ million, Net Income US$m, Strongest Business Region, Submarket Involvement, HQ, Founded, No. of Employees, Website) 2019
Table 94. Nvidia Total Company Sales 2015-2019 (US$ billion, AGR%)
Table 95. Nvidia Net Income 2015-2019 (US$m, AGR%)
Table 96. IBM Profile (CEO, Total Company Sales US$ million, Net Income US$m, Strongest Business Region, Submarket Involvement, HQ, Founded, No. of Employees, Website) 2019
Table 97. IBM Total Company Sales 2015-2019 (US$ billion, AGR%)
Table 98. IBM Net Income 2015-2019 (US$m, AGR%)
Table 99. Micron Profile (CEO, Total Company Sales US$ million, Net Income US$m, Strongest Business Region, Submarket Involvement, HQ, Founded, No. of Employees, Website) 2018
Table 100. Micron Total Company Sales 2015-2018 (US$m, AGR%)
Table 101. Micron Net Income 2015-2018 (US$m, AGR%)
Table 102. Samsung Profile (CEO, Total Company Sales US$ billion, Net Income US$m, Strongest Business Region, Submarket Involvement, HQ, Founded, No. of Employees, Website) 2019
Table 103. Samsung Total Company Sales 2015-2019 (US$ billion, AGR%)
Table 104. Xilinx Profile (CEO, Total Company Sales US$ million, Net Income US$m, Strongest Business Region, Submarket Involvement, HQ, Founded, No. of Employees, Website) 2018
Table 105. Xilinx Total Company Sales 2015-2018 (US$m, AGR%)
Table 106. Xilinx Net Income 2015-2018 (US$m, AGR%)
Table 107. Amazon Profile (CEO, Total Company Sales US$ billion, Net Income US$m, Strongest Business Region, Submarket Involvement, HQ, Founded, No. of Employees, Website) 2018
Table 108. Amazon Total Company Sales 2015-2018 (US$ billion, AGR%)
Table 109. Amazon Net Income 2015-2018 (US$m, AGR%)
Table 110. Airbus Profile (CEO, Total Company Sales US$ billion, Net Income US$m, Strongest Business Region, Submarket Involvement, HQ, Founded, No. of Employees, Website) 2019
Table 111. Airbus Total Company Sales 2015-2019 (US$ billion, AGR%)
Table 112. Airbus Net Income 2015-2019 (US$m, AGR%)
Table 113. Boeing Profile (CEO, Total Company Sales US$ billion, Net Income US$m, Strongest Business Region, Submarket Involvement, HQ, Founded, No. of Employees, Website) 2019
Table 114. Boeing Total Company Sales 2015-2019 (US$ billion, AGR%)
Table 115. Boeing Net Income 2015-2019 (US$m, AGR%)
Table 116. General Electric Profile (CEO, Total Company Sales US$ billion, Net Income US$m, Strongest Business Region, Submarket Involvement, HQ, Founded, No. of Employees, Website) 2019
Table 117. General Electric Total Company Sales 2015-2019 (US$ billion, AGR%)
Table 118. Thales Profile (CEO, Total Company Sales US$ billion, Net Income US$m, Strongest Business Region, Submarket Involvement, HQ, Founded, No. of Employees, Website) 2019
Table 119. Thales Total Company Sales 2015-2019 (US$ billion, AGR%)
Table 120. Thales Net Income 2015-2019 (US$m, AGR%)
Table 121. Lockheed Martin Profile (CEO, Total Company Sales US$ billion, Net Income US$m, Strongest Business Region, Submarket Involvement, HQ, Founded, No. of Employees, Website) 2019
Table 122. Lockheed Martin Total Company Sales 2015-2019 (US$ billion, AGR%)
Table 123. Garmin Profile (CEO, Total Company Sales US$ billion, Net Income US$m, Strongest Business Region, Submarket Involvement, HQ, Founded, No. of Employees, Website) 2019
Table 124. Garmin Total Company Sales 2015-2018 (US$ billion, AGR%)
Table 125. SITA Profile (CEO, Total Company Sales US$ billion, Net Income US$m, Strongest Business Region, Submarket Involvement, HQ, Founded, No. of Employees, Website) 2019
Table 126. Iris Automation Profile (CEO, Submarket Involvement, HQ, Founded, No. of Employees, Website) 2019
List of Figures
Figure 1. Global Intelligent Automation in Aerospace & Defence Market Forecast 2020-2030 (US$m, AGR %)
Figure 2. Global Intelligent Automation in Aerospace & Defence Market Segmentation Overview
Figure 3. SWOT Analysis
Figure 4. Porters Five Forces Analysis
Figure 5. Global Intelligent Automation in Aerospace & Defence Market Forecast 2020-2030 (US$m, AGR %)
Figure 6. Global Intelligent Automation in Aerospace & Defence Market Forecast 2020-2030 (US$m, AGR %)
Figure 7. Global Intelligent Automation in Aerospace & Defence by Component Share Forecast (% Share)
Figure 8. Global Intelligent Automation in Aerospace & Defence by Hardware Market Forecast 2020-2030 (US$m, AGR %)
Figure 9. Global Intelligent Automation in Aerospace & Defence by Software Market Forecast 2020-2030 (US$m, AGR %)
Figure 10. Global Intelligent Automation in Aerospace & Defence by Services Market Forecast 2020-2030 (US$m, AGR %)
Figure 11. Global Intelligent Automation in Aerospace & Defence by Application Share Forecast (% Share)
Figure 12. Global Intelligent Automation in Aerospace & Defence by Military Market Forecast 2020-2030 (US$m, AGR %)
Figure 13. Global Intelligent Automation in Aerospace & Defence by Commercial Aviation Market Forecast 2020-2030 (US$m, AGR %)
Figure 14. Global Intelligent Automation in Aerospace & Defence by Space Market Forecast 2020-2030 (US$m, AGR %)
Figure 15. North America Intelligent Automation in Aerospace & Defence Market Forecast 2020-2030 (US$m, AGR %)
Figure 16. North America Intelligent Automation in Aerospace & Defence Market by Component Submarkets Forecast 2020-2030 (US$m)
Figure 17. North America Intelligent Automation in Aerospace & Defence by Component Share Forecast (% Share)
Figure 18. North America Intelligent Automation in Aerospace & Defence Market by Application Submarkets Forecast 2020-2030 (US$m)
Figure 19. North America Intelligent Automation in Aerospace & Defence by Application Share Forecast (% Share)
Figure 20. United States Intelligent Automation in Aerospace & Defence Market Forecast 2020-2030 (US$m, AGR %)
Figure 21. United States Intelligent Automation in Aerospace & Defence Market by Component Submarkets Forecast 2020-2030 (US$m)
Figure 22. United States Intelligent Automation in Aerospace & Defence by Component Share Forecast (% Share)
Figure 23. United States Intelligent Automation in Aerospace & Defence Market by Application Submarkets Forecast 2020-2030 (US$m)
Figure 24. United States Intelligent Automation in Aerospace & Defence by Application Share Forecast (% Share)
Figure 25. Canada Intelligent Automation in Aerospace & Defence Market Forecast 2020-2030 (US$m, AGR %)
Figure 26. Canada Intelligent Automation in Aerospace & Defence Market by Component Submarkets Forecast 2020-2030 (US$m)
Figure 27. Canada Intelligent Automation in Aerospace & Defence by Component Share Forecast (% Share)
Figure 28. Canada Intelligent Automation in Aerospace & Defence Market by Application Submarkets Forecast 2020-2030 (US$m)
Figure 29. Canada Intelligent Automation in Aerospace & Defence by Application Share Forecast (% Share)
Figure 30. Europe Intelligent Automation in Aerospace & Defence Market Forecast 2020-2030 (US$m, AGR %)
Figure 31. Europe Intelligent Automation in Aerospace & Defence Market by Component Submarkets Forecast 2020-2030 (US$m)
Figure 32. Europe Intelligent Automation in Aerospace & Defence by Component Share Forecast (% Share)
Figure 33. Europe Intelligent Automation in Aerospace & Defence Market by Application Submarkets Forecast 2020-2030 (US$m)
Figure 34. Europe Intelligent Automation in Aerospace & Defence by Application Share Forecast (% Share)
Figure 35. Germany Intelligent Automation in Aerospace & Defence Market Forecast 2020-2030 (US$m, AGR %)
Figure 36. Germany Intelligent Automation in Aerospace & Defence Market by Component Submarkets Forecast 2020-2030 (US$m)
Figure 37. Germany Intelligent Automation in Aerospace & Defence by Component Share Forecast (% Share)
Figure 38. Germany Intelligent Automation in Aerospace & Defence Market by Application Submarkets Forecast 2020-2030 (US$m)
Figure 39. Germany Intelligent Automation in Aerospace & Defence by Application Share Forecast (% Share)
Figure 40. France Intelligent Automation in Aerospace & Defence Market Forecast 2020-2030 (US$m, AGR %)
Figure 41. France Intelligent Automation in Aerospace & Defence Market by Component Submarkets Forecast 2020-2030 (US$m)
Figure 42. France Intelligent Automation in Aerospace & Defence by Component Share Forecast (% Share)
Figure 43. France Intelligent Automation in Aerospace & Defence Market by Application Submarkets Forecast 2020-2030 (US$m)
Figure 44. France Intelligent Automation in Aerospace & Defence by Application Share Forecast (% Share)
Figure 45. United Kingdom Intelligent Automation in Aerospace & Defence Market Forecast 2020-2030 (US$m, AGR %)
Figure 46. United Kingdom Intelligent Automation in Aerospace & Defence Market by Component Submarkets Forecast 2020-2030 (US$m)
Figure 47. United Kingdom Intelligent Automation in Aerospace & Defence by Component Share Forecast (% Share)
Figure 48. United Kingdom Intelligent Automation in Aerospace & Defence Market by Application Submarkets Forecast 2020-2030 (US$m)
Figure 49. United Kingdom Intelligent Automation in Aerospace & Defence by Application Share Forecast (% Share)
Figure 50. Italy Intelligent Automation in Aerospace & Defence Market Forecast 2020-2030 (US$m, AGR %)
Figure 51. Italy Intelligent Automation in Aerospace & Defence Market by Component Submarkets Forecast 2020-2030 (US$m)
Figure 52. Italy Intelligent Automation in Aerospace & Defence by Component Share Forecast (% Share)
Figure 53. Italy Intelligent Automation in Aerospace & Defence Market by Application Submarkets Forecast 2020-2030 (US$m)
Figure 54. Italy Intelligent Automation in Aerospace & Defence by Application Share Forecast (% Share)
Figure 55. Russia Intelligent Automation in Aerospace & Defence Market Forecast 2020-2030 (US$m, AGR %)
Figure 56. Russia Intelligent Automation in Aerospace & Defence Market by Component Submarkets Forecast 2020-2030 (US$m)
Figure 57. Russia Intelligent Automation in Aerospace & Defence by Component Share Forecast (% Share)
Figure 58. Russia Intelligent Automation in Aerospace & Defence Market by Application Submarkets Forecast 2020-2030 (US$m)
Figure 59. Russia Intelligent Automation in Aerospace & Defence by Application Share Forecast (% Share)
Figure 60. Rest of Europe Intelligent Automation in Aerospace & Defence Market Forecast 2020-2030 (US$m, AGR %)
Figure 61. Rest of Europe Intelligent Automation in Aerospace & Defence Market by Component Submarkets Forecast 2020-2030 (US$m)
Figure 62. Rest of Europe Intelligent Automation in Aerospace & Defence by Component Share Forecast (% Share)
Figure 63. Rest of Europe Intelligent Automation in Aerospace & Defence Market by Application Submarkets Forecast 2020-2030 (US$m)
Figure 64. Rest of World Intelligent Automation in Aerospace & Defence by Application Share Forecast (% Share)
Figure 65. Asia Pacific Intelligent Automation in Aerospace & Defence Market Forecast 2020-2030 (US$m, AGR %)
Figure 66. Asia Pacific Intelligent Automation in Aerospace & Defence Market by Component Submarkets Forecast 2020-2030 (US$m)
Figure 67. Asia Pacific Intelligent Automation in Aerospace & Defence by Component Share Forecast (% Share)
Figure 68. Asia Pacific Intelligent Automation in Aerospace & Defence Market by Application Submarkets Forecast 2020-2030 (US$m)
Figure 69. Asia Pacific Intelligent Automation in Aerospace & Defence by Application Share Forecast (% Share)
Figure 70. China Intelligent Automation in Aerospace & Defence Market Forecast 2020-2030 (US$m, AGR %)
Figure 71. China Intelligent Automation in Aerospace & Defence Market by Component Submarkets Forecast 2020-2030 (US$m)
Figure 72. China Intelligent Automation in Aerospace & Defence by Component Share Forecast (% Share)
Figure 73. China Intelligent Automation in Aerospace & Defence Market by Application Submarkets Forecast 2020-2030 (US$m)
Figure 74. China Intelligent Automation in Aerospace & Defence by Application Share Forecast (% Share)
Figure 75. Value of artificial intelligence (AI) investment deals in aerospace industry in China from 2016 to May 2019 (in billion Yuan)
Figure 76. Japan Intelligent Automation in Aerospace & Defence Market Forecast 2020-2030 (US$m, AGR %)
Figure 77. Japan Intelligent Automation in Aerospace & Defence Market by Component Submarkets Forecast 2020-2030 (US$m)
Figure 78. Japan Intelligent Automation in Aerospace & Defence by Component Share Forecast (% Share)
Figure 79. Japan Intelligent Automation in Aerospace & Defence Market by Application Submarkets Forecast 2020-2030 (US$m)
Figure 80. Japan Intelligent Automation in Aerospace & Defence by Application Share Forecast (% Share)
Figure 81. Value of capital raised by start-us in Japan in 2017, by industry (in billion JPY)
Figure 82. India Intelligent Automation in Aerospace & Defence Market Forecast 2020-2030 (US$m, AGR %)
Figure 83. India Intelligent Automation in Aerospace & Defence Market by Component Submarkets Forecast 2020-2030 (US$m)
Figure 84. India Intelligent Automation in Aerospace & Defence by Component Share Forecast (% Share)
Figure 85. India Intelligent Automation in Aerospace & Defence Market by Application Submarkets Forecast 2020-2030 (US$m)
Figure 86. India Intelligent Automation in Aerospace & Defence by Application Share Forecast (% Share)
Figure 87. Rest of Asia Pacific Intelligent Automation in Aerospace & Defence Market Forecast 2020-2030 (US$m, AGR %)
Figure 88. Rest of Asia Pacific Intelligent Automation in Aerospace & Defence Market by Component Submarkets Forecast 2020-2030 (US$m)
Figure 89. Rest of Asia Pacific Intelligent Automation in Aerospace & Defence by Component Share Forecast (% Share)
Figure 90. Rest of Asia Pacific Intelligent Automation in Aerospace & Defence Market by Application Submarkets Forecast 2020-2030 (US$m)
Figure 91. Rest of Asia Pacific Intelligent Automation in Aerospace & Defence by Application Share Forecast (% Share)
Figure 92. Rest of World Intelligent Automation in Aerospace & Defence Market Forecast 2020-2030 (US$m, AGR %)
Figure 93. Rest of World Intelligent Automation in Aerospace & Defence Market by Component Submarkets Forecast 2020-2030 (US$m)
Figure 94. Rest of World Intelligent Automation in Aerospace & Defence by Component Share Forecast (% Share)
Figure 95. Rest of World Intelligent Automation in Aerospace & Defence Market by Application Submarkets Forecast 2020-2030 (US$m)
Figure 96. Rest of World Intelligent Automation in Aerospace & Defence by Application Share Forecast (% Share)
Figure 97. Worldwide Artificial Intelligence 2018 Share Snapshot (% Share)
Figure 98. Microsoft Corporation Total Company Sales 2015-2019 (US$m, AGR%)
Figure 99. Microsoft Corporation Sales by Business Segment 2019 (%)
Figure 100. Microsoft Corporation Net Income 2015-2019 (US$m, AGR%)
Figure 101. Microsoft Corporation Sales by Geographical Location, 2019 (%)
Figure 102. Intel Corporation Total Company Sales 2015-2019 (US$ billion, AGR%)
Figure 103. Intel Corporation Sales by Business Segment 2019 (%)
Figure 104. Intel Net Income 2015-2019 (US$m, AGR%)
Figure 105. Nvidia Total Company Sales 2015-2020 (US$ billion) (AGR %)
Figure 106. Nvidia Sales by Business Segment 2019 (%)
Figure 107. Nvidia Net Income 2015-2019 (US$m) (AGR%)
Figure 108. Nvidia Sales by Geographical Location, 2019 (%)
Figure 109. IBM Total Company Sales 2015-2019 (US$ billion, AGR%)
Figure 110. IBM Sales by Business Segment 2019 (%)
Figure 111. IBM Net Income 2015-2019 (US$m, AGR%)
Figure 112. IBM Sales by Geographical Location, 2019 (%)
Figure 113. Micron Total Company Sales 2015-2018 (US$ million, AGR%)
Figure 114. Micron Sales by Business Segment 2018 (%)
Figure 115. Micron Net Income 2015-2018 (US$m, AGR%)
Figure 116. Micron Sales by Geographical Location, 2018 (%)
Figure 117. Samsung Total Company Sales 2015-2019 (US$ billion, AGR%)
Figure 118. Xilinx Total Company Sales 2015-2018 (US$m, AGR%)
Figure 119. Xilinx Sales by Business Segment 2018 (%)
Figure 120. Xilinx Net Income 2015-2018 (US$m, AGR%)
Figure 121. Xilinx Sales by Geographical Location, 2018 (%)
Figure 122. Amazon Total Company Sales 2015-2018 (US$ billion, AGR%)
Figure 123. Amazon Net Income 2015-2018 (US$m, AGR%)
Figure 124. Amazon Sales by Geographical Location, 2018 (%)
Figure 125. Airbus Total Company Sales 2015-2019 (US$ billion, AGR%)
Figure 126. Airbus Sales by Business Segment 2019 (%)
Figure 127. Airbus Net Income 2015-2019 (US$m, AGR%)
Figure 128. Airbus Sales by Geographical Location, 2019 (%)
Figure 129. Boeing Total Company Sales 2015-2019 (US$ billion, AGR%)
Figure 130. Boeing Sales by Business Segment 2019 (%)
Figure 131. Boeing Net Income 2015-2019 (US$m, AGR%)
Figure 132. General Electric Total Company Sales 2015-2019 (US$ billion, AGR%)
Figure 133. General Electric Sales by Business Segment 2019 (%)
Figure 134. General Electric Sales by Geographical Location, 2019 (%)
Figure 135. Thales Total Company Sales 2015-2019 (US$ billion, AGR%)
Figure 136. Thales Sales by Business Segment 2019 (%)
Figure 137. Thales Net Income 2015-2019 (US$m, AGR%)
Figure 138. Thales Sales by Geographical Location, 2019 (%)
Figure 139. Lockheed Martin Total Company Sales 2015-2019 (US$ billion, AGR%)
Figure 140. Lockheed Martin Sales by Business Segment 2019 (%)
Figure 141. Lockheed Martin Sales by Geographical Location, 2019 (%)
Figure 142. Garmin Total Company Sales 2015-2018 (US$ billion, AGR%)
Figure 143. Garmin Sales by Business Segment 2019 (%)
Figure 144. Garmin Sales by Geographical Location, 2019 (%)
Figure 145. Global Intelligent Automation in Aerospace & Defence Market Forecast 2020-2030 (US$m, AGR %)
Airbus
Amazon
Boeing
Garmin
General Electric
IBM
Intel Corporation
Iris Automation Inc.
Lockheed Martin
Micron
Microsoft Corporation
NVIDIA
Samsung
SITA
Thales
Xilinx
Download sample pages
Complete the form below to download your free sample pages for Intelligent Automation in Aerospace & Defence Market Report 2020-2030Related reports
-
Actuators Market Report 2020-2030
An actuator is a component of a machine that is responsible for moving and controlling a mechanism or system. The...
Full DetailsPublished: 01 January 1970 -
Aerospace Filters Market Report 2020-2030
Aerospace filters are one of the promising markets and investors should be mindful that the future belongs to broad aviation’s,...
Full DetailsPublished: 17 August 2020 -
Fire Control System Market Report 2021-2031
Growing usage of automation systems in fire control systems is anticipated to fuel market growth coupled with rising geo-political issues...Full DetailsPublished: 19 January 2021 -
Aviation Blockchain Market Report 2020-2030
The recent developments in Aviation Blockchain technologies, has led Visiongain to publish this timely report. The $ 503.8 million Aviation...
Full DetailsPublished: 09 March 2020 -
Remote Air Traffic Control Towers Market Report 2020-2030
Where is the Remote Air Traffic Control Towers market heading? If you are involved in this sector you must read...
Full DetailsPublished: 10 June 2020 -
Aerospace Used Serviceable Material Market Report 2020-2030
The global aerospace used serviceable material market is competitive in nature as large number of well-established manufacturers are operating in...
Full DetailsPublished: 22 May 2020 -
Active Protection System Market Report 2020-2030
The Active Protection System Market is segmented on the Platform, Kill System Type, Application, and Regional basis.
...Full DetailsPublished: 01 January 1970 -
Commercial Aircraft NextGen Avionics Market Report 2020-2030
Commercial Aircraft NextGen Avionics market is projected to reach US$6 billion in 2020.
...Full DetailsPublished: 18 March 2020 -
Electronically Scanned Arrays Market Report 2020-2030
The Electronically Scanned Arrays Market is segmented on the Type, Platform, Technology, and Regional basis.
...Full DetailsPublished: 01 January 1970 -
Smart Airport Technologies Market Report 2020-2030
The recent contracts in Smart airport technologies market, has led Visiongain to publish this timely report. The $3,569.6 million Smart...
Full DetailsPublished: 14 May 2020
Download sample pages
Complete the form below to download your free sample pages for Intelligent Automation in Aerospace & Defence Market Report 2020-2030Do you have any custom requirements we can help you with?
Any specific country, geo region, market segment or specific company information?
Email us today, we can discuss your needs and see how we can help: jamie.roberts@visiongain.com
Visiongain aviation reports are compiled using a broad and rich mixture of both primary and secondary information to produce an overall industry outlook. In order to provide our clients with the best product possible product, we do not rely on any one single source of information. Visiongain analysts reach out to market-leading vendors and automotive industry experts but also review a wealth of financial data and product information from a vast range of sources. To find out more about our reports methodology please email jamie.roberts@visiongain.com
Would you like a free report overview of the report of your choice?
If so, please drop an email to Jamie Roberts stating your chosen report title to jamie.roberts@visiongain.com
Would you like to get the latest Visiongain aviation reports catalogue?
What are the dynamic growth sectors? where are the regional business opportunities?
Which technologies will prevail and who are the leading companies succeeding in these sectors and why?
If you want definitive answers to business critical questions, discover Visiongain’s full range of business intelligence reports.
If so, please email Jamie Roberts on jamie.roberts@visiongain.com or call her today on +44 207 336 6100
Airline Passenger Experience Association (APEX)
Airlines for America
Airport Consultants Council (ACC)
Airports Council International (ACI)
Airports Council International-North America
American Association of Airport Executives
Arab Air Carriers Organization (AACO)
European Aerospace Cluster Partnership
Global Business Travel Association (GBTA)
International Air Transport Association (IATA)
Security Industry Association (SIA)
Security Manufacturers Coalition
Women in Aviation
World Aviation Services
Don’t Miss Out!
Latest Aviation news
Aircraft Computers Market
The global Aircraft Computers market is projected to grow at a CAGR of 5.7% by 2034
24 June 2024
Space Mining Market
The global Space Mining market is projected to grow at a CAGR of 20.7% by 2034
07 June 2024
Connected Aircraft Market
The global Connected Aircraft market is projected to grow at a CAGR of 17.2% by 2034
05 June 2024
Satellite Ground Station Market
The global Satellite Ground Station market was valued at US$65.69 billion in 2023 and is projected to grow at a CAGR of 13.3% during the forecast period 2024-2034.
21 May 2024


