In 2017, the global plasma fractionation market was valued at $24bn and is expected to grow at a CAGR of 9.0% in the first half of the forecast period. In 2017, the immunoglobulins submarket held 44.0% of the global plasma fractionation market.
How this report will benefit you
Read on to discover how you can exploit the future business opportunities emerging in this sector.
In this brand new 172-page report you will receive 91 tables and 98 figures– all unavailable elsewhere.
The 172-page report provides clear detailed insight into the global plasma fractionation market. Discover the key drivers and challenges affecting the market.
By ordering and reading our brand-new report today you stay better informed and ready to act.
Report Scope
• Global Plasma Fractionation market forecasts from 2018-2028
• This report also breaks down the revenue forecast for the global plasma fractionation market by type of product:
• Immunoglobulins
• Albumins
• Clotting Factors
• Hyperimmune Globulins
• Alpha 1 Antitrypsin Inhibitors (A1PI)
• C-1
• Others
• This report also breaks down the revenue forecast for the global plasma fractionation market by type of application:
• Primary Immune Deficiency (PID)
• Secondary Immune Deficiency (SID)
• Idiopathic Thrombocytopenic Purpura (ITP)
• Cardiac & Surgery
• Emergency Medicine
• Haemophilia
• This report also breaks down the revenue forecast for the global plasma fractionation market by regional market:
• North America
• Europe
• Latin America
• Asia-Pacific
• Middle East & Africa
• This report also breaks down the revenue forecast for the global plasma fractionation market by national market:
• US
• Canada
• UK
• Germany
• France
• Spain
• Italy
• Rest of Europe
• Japan
• Rest of APAC
• Our study discusses the selected leading companies that are the major players in the plasma fractionation industry:
• Biotest
• CSL
• Grifols
• Kedrion
• LFB
• OctaPharma
• Shire/Baxalta
• Others
• Our study gives qualitative analysis of the plasma fractionation market. It discusses factors that drive and restrain the market
• Other information included in this report:
• Type of plasma processed in Europe from 1996 – 2012 (3-year increment) for non-profit organizations (source plasma vs recovered plasma, in thousand liters)
• Type of plasma processed in Europe from 1996 – 2012 (3-year increment) for commercial companies (source plasma vs recovered plasma, in thousand liters)
• Cost of plasma protein in Canada by product
• Canadian plasma shipments for fractionation by source
• Immunoglobulin-monthly distribution and 12-month rolling average distribution (2016/2017) for: the US, the UK, Germany, Italy, Spain, Austria, Finland, Greece, Norway, Portugal, Sweden, Switzerland
• Albumin 5%-monthly distribution and 12-month rolling average distribution (2016/2017) for the US
Visiongain’s study is intended for anyone requiring commercial analyses for the global plasma fractionation market. You find data, trends and predictions.
Buy our report today Global Plasma Fractionation Market 2018-2028: Immunoglobulins, Albumins, Clotting Factors, Hyperimmune Globulins, Alpha 1 Antitrypsin Inhibitors (A1PI), C1 Esterase Inhibitors, Primary Immune Deficiency (PID), Secondary Immune Deficiency (SID), Idiopathic Thrombocytopenic Purpura (ITP), Cardiac & Surgery, Emergency Medicine, Haemophilia.
Visiongain is a trading partner with the US Federal Government
CCR Ref number: KD4R6
1. Report Overview
1.1 Global Plasma Fractionation Market Overview
1.2 Why You Should Read This Report
1.3 Key Questions Answered by This Analytical Report
1.4 Who is This Report For?
1.5 Methodology
1.6 Frequently Asked Questions (FAQ)
1.7 Associated Visiongain Reports
1.8 About Visiongain
2. Introduction to the Global Plasma Fractionation Market
2.1 Global Plasma Fractionation Market Definition
2.2 What is Plasma?
2.3 Plasma Manufacturing Process
2.4 WHO Recommendations for Blood Safety and Availability
2.4.1 Blood Supply
2.4.2 Blood Donors
2.4.3 Blood Screening
2.4.4 Blood Processing
2.4.5 Supply of Plasma-derived Medicinal Products (PDMP)
2.4.6 Clinical Use of Blood
2.4.7 Blood Transfusions
2.4.8 WHO Response
2.5 Plasma Derived Products
3. Global Plasma Fractionation Market 2017-2028
3.1 Global Plasma Fractionation Market Forecast 2017-2028
3.2 Global Plasma Fractionation Drivers & Restraints 2017
4. Global Plasma Fractionation Submarket Forecast 2017-2028
4.1 Global Plasma Fractionation Market by Product Type
4.1.1 Global Plasma Fractional Market by Product Type Market Share (%)
4.2 Global Plasma Fractionation Market by Application
4.2.1 Global Plasma Fractional Market by Application Market Share (%)
4.3 Global Plasma Fractionation Market by Region
4.3.1 Global Plasma Fractional Market by Region Market Share (%)
4.4 Global Plasma Fractionation Market by Country
4.4.1 Global Plasma Fractional Market by Country Market Share (%)
4.5 Global Plasma Fractionation Market by Company
4.5.1 Global Plasma Fractional Market by Company Market Share (%)
5. Global Plasma Fractionation Market Forecast by Product Type 2018-2028
5.1 Immunoglobulins Market Forecast 2018-2028
5.2 Albumins Market Forecast 2018-2028
5.3 Clotting Factors Market Forecast 2018-2028
5.4 Hyperimmune Globulins Market Forecast 2018-2028
5.5 Alpha 1 Proteinase Inhibitors Market Forecast 2018-2028
5.6 C-1 Esterase Inhibitors Market Forecast 2018-2028
5.7 Other Plasma Derived Products Market Forecast 2018-2028
6. Global Plasma Fractionation Market Forecast by Application 2018-2028
6.1 PID (Primary Immune Deficiency) Market Forecast 2018-2028
6.2 SID (Secondary Immune Deficiency) Market Forecast 2018-2028
6.3 ITP (Idiopathic Thrombocytopenic Purpura) Market Forecast 2018-2028
6.4 Cardiac and Liver Surgery Market Forecast 2018-2028
6.5 Emergency Medicine Market Forecast 2018-2028
6.6 Hemophilia Market Forecast 2018-2028
6.7 Other Applications Plasma Market Forecast 2018-2028
7. Global Plasma Fractionation Market Forecast by Region 2018-2028
7.1 North America Plasma Fractionation Market Forecast 2018-2028
7.1.1 North America Plasma Fractionation Market by Country Forecast 2018-2028
7.1.2 North America Plasma Fractionations – Country Market Share (%)
7.2 Europe Plasma Fractionation Market Forecast 2018-2028
7.2.1 Europe Plasma Fractionation Market by Country Forecast 2018-2028
7.2.2 Europe Plasma Fractionations – Country Market Share (%)
7.3 Latin America Plasma Market Forecast 2018-2028
7.4 Asia-Pacific (APAC) Plasma Market Forecast 2018-2028
7.4.1 APAC Plasma Fractionation Market by Country Forecast 2018-2028
7.4.2 APAC Plasma Fractionations – Country Market Share (%)
7.5 Middle East & Africa (MEA) Plasma Market Forecast 2018-2028
8. Global Plasma Fractionation Market Forecast by Country 2018-2028
8.1 U.S. Plasma Fractionation Market Forecast 2018-2028
8.2 Canada Plasma Fractionation Market Forecast 2018-2028
8.3 United Kingdom Plasma Fractionation Market Forecast 2018-2028
8.4 Germany Plasma Fractionation Market Forecast 2018-2028
8.5 Italy Plasma Fractionation Market Forecast 2018-2028
8.6 France Plasma Fractionation Market Forecast 2018-2028
8.7 Spain Plasma Fractionation Market Forecast 2018-2028
8.8 Rest of Europe (ROE) Plasma Fractionation Market Forecast 2018-2028
8.9 Japan Plasma Fractionation Market Forecast 2018-2028
8.10 Rest of Asia-Pacific Plasma Fractionation Market Forecast 2018-2028
9. Global Plasma Fractionation Market Forecast by Company 2018-2028
9.1 CSL Plasma Fractionation Market Forecast 2018-2028
9.2 Shire/Baxalta Plasma Fractionation Market Forecast 2018-2028
9.3 Grifols Plasma Fractionation Market Forecast 2018-2028
9.4 OctaPharma Plasma Fractionation Market Forecast 2018-2028
9.5 Biotest Plasma Fractionation Market Forecast 2018-2028
9.6 LFB Plasma Fractionation Market Forecast 2018-2028
9.7 Kedrion Plasma Fractionation Market Forecast 2018-2028
9.8 Other Companies Plasma Fractionation Market Forecast 2018-2028
10. Plasma Fractionation Market – Leading Companies
10.1 Leading 7 Plasma Fractionation Market Company Sales Share Analysis 2017
10.2 CSL Limited
10.2.1 CSL Limited Total Company Sales 2013-2017
10.2.2 CSL Limited Sales in the Plasma Fractionation Market 2016-2017
10.2.3 CSL Limited Net Income / Loss 2013-2017
10.3 Shire
10.3.1 Shire Total Company Sales 2013-2017
10.3.2 Shire Sales in the Plasma Fractionation Market 2016-2017
10.3.3 Shire Net Income / Loss 2013-2017
10.4 Grifols
10.4.1 Grifols Total Company Sales 2013-2017
10.4.2 Grifols Sales in the Plasma Fractionation Market 2016-2017
10.4.3 Grifols Net Income / Loss 2013-2017
10.5 OctaPharma
10.5.1 OctaPharma Total Company Sales 2013-2017
10.5.2 OctaPharma Sales in the Plasma Fractionation Market 2016-2017
10.5.3 OctaPharma Net Income / Loss 2013-2017
10.6 Biotest
10.6.1 Biotest Total Company Sales 2013-2017
10.6.2 Biotest Sales in the Plasma Fractionation Market 2016-2017
10.6.3 Biotest Net Income / Loss 2013-2017
10.7 LFB
10.7.1 LFB Total Company Sales 2013-2017
10.7.2 LFB Sales in the Plasma Fractionation Market 2016-2017
10.7.3 LFB Net Income / Loss 2013-2017
10.8 KEDRION
10.8.1 KEDRION Total Company Sales 2013-2017
10.8.2 KEDRION Sales in the Plasma Fractionation Market 2016-2017
10.8.3 KEDRION Net Income / Loss 2013-2017
10.9 Other Companies Involved in the Plasma Fractionation Market 2017
11. Conclusions and Recommendations
11.1 Plasma Derived Therapies: A Maturing Market
11.2 The Global Plasma Fractionation Market in 2017
11.3 Current Leading Plasma Fractionation Market Segments
11.4 Leading Plasma Fractionation Companies
11.5 Leading Regional and National Markets
11.6 Global Plasma Fractionation Market Forecast 2017-2028
11.7 The Future of the Plasma Fractionation Therapies Market
11.7.1 Immunoglobulins is the major driver of Plasma Fractionation Market
11.7.2 Increase in Plasma collection Centres
11.7.3 Improved Diagnosis for rare disorders
11.8 Unmet Needs in Plasma Fractionation Market
11.8.1 A Global Need Not Met
11.8.2 Access to Safe Blood Products
Appendices
Associated Visiongain Reports
Visiongain Report Sales Order Form
About Visiongain
Visiongain Report Evaluation Form
List of Tables
Table 2.1 Main Plasma-derived Products and Indications
Table 3.1 Global Plasma Fractionation Market Forecast 2017-2028 ($m, AGR %, CAGR %)
Table 3.2 Global Plasma Fractionation Market Drivers & Restraints 2017
Table 4.1 Plasma Fractionation Market by Product Type Market Forecast 2017-2028 ($m, AGR %, CAGR %)
Table 4.2 Plasma Fractionation by Product Type Market Share 2017, 2023, 2028 (% Share)
Table 4.3 Plasma Fractionation Market by Applications Market Forecast 2017-2028 ($m, AGR %, CAGR %)
Table 4.4 Plasma Fractionation by Applications Market Share 2017, 2023, 2028 (% Share)
Table 4.5 Plasma Fractionation Market by Regional Market Forecast 2017-2028 ($m, AGR %, CAGR%)
Table 4.6 Plasma Fractionation by Region Market Share 2017, 2023, 2028 (% Share)
Table 4.7 Leading National Plasma Fractionation Market Forecast by Countries 2017-2028 ($m, AGR%, CAGR%)
Table 4.8 Plasma Fractionation by Countries Market Share 2017, 2023, 2028 (% Share)
Table 4.9 Plasma Fractionation Market by Companies Market Forecast 2017-2028 ($m, AGR %, CAGR%)
Table 4.10 Plasma Fractionation by Companies Market Share 2017, 2023, 2028 (% Share)
Table 5.1 Global Plasma Fractionation Immunoglobulin’s Market Forecast 2017-2028 ($m, AGR %, CAGR %)
Table 5.2 Global Plasma Fractionation Albumin’s Market Forecast 2017-2028 ($m, AGR %, CAGR %)
Table 5.3 Global Plasma Fractionation Clotting Factor’s Market Forecast 2017-2028 ($m, AGR %, CAGR %)
Table 5.4 Global Plasma Fractionation Hyperimmune Globulins Market Forecast 2017-2028 ($m, AGR %, CAGR %)
Table 5.5 Global Plasma Fractionation A1PI’s Market Forecast 2017-2028 ($m, AGR %, CAGR %)
Table 5.6 Global Plasma Fractionation C-1’s Market Forecast 2017-2028 ($m, AGR %, CAGR %)
Table 5.7 Global Plasma Fractionation Other Product Types Market Forecast 2017-2028 ($m, AGR %, CAGR %)
Table 6.1 PID Defects by Region
Table 6.2 Global Plasma Fractionation PID’s Market Forecast 2017-2028 ($m, AGR %, CAGR%)
Table 6.3 Global Plasma Fractionation SID’s Market Forecast 2017-2028 ($m, AGR %, CAGR %)
Table 6.4 Global Plasma Fractionation ITP’s Market Forecast 2017-2028 ($m, AGR %, CAGR %)
Table 6.5 Global Plasma Fractionation Cardiac and Liver Surgery’s
Market Forecast 2017-2028 ($m, AGR %, CAGR %)
Table 6.6 Global Plasma Fractionation Emergency Medicine’s Market Forecast 2017-2028 ($m, AGR %, CAGR %)
Table 6.7 Global Plasma Fractionation Hemophilia’s Market Forecast 2017-2028 ($m, AGR %, CAGR %)
Table 6.8 Products and Disease Treatments
Table 6.9 Global Plasma Fractionation Other Applications Market Forecast 2017-2028 ($m, AGR %, CAGR %)
Table 7.1 Global Plasma Fractionation North America’s Market Forecast 2017-2028 ($m, AGR %, CAGR %)
Table 7.2 North America Plasma Fractionation Market by Country Forecast 2017-2028 ($m, AGR %, CAGR%)
Table 7.3 North America Plasma Fractionation – Country Market Share 2017, 2023, 2028 (% Share)
Table 7.4 Global Plasma Fractionation Europe’s Market Forecast 2017-2028 ($m, AGR %, CAGR %)
Table 7.5 Europe Plasma Fractionation Market by Country Forecast 2017-2028 ($m, AGR %, CAGR %)
Table 7.6 Europe Plasma Fractionation – Country Market Share 2017, 2023, 2028 (% Share)
Table 7.7 Global Plasma Fractionation Latin America’s Market Forecast 2017-2028 ($m, AGR %, CAGR %)
Table 7.8 Global Plasma Fractionation APAC’s Market Forecast 2017-2028 ($m, AGR %, CAGR %)
Table 7.9 APAC Plasma Fractionation Market by Country Forecast 2017-2028 ($m, AGR %, CAGR%)
Table 7.10 APAC Plasma Fractionations – Country Market Share 2017, 2023, 2028 (% Share)
Table 7.11 Global Plasma Fractionation Middle East & Africa’s Market Forecast 2017-2028 ($m, AGR %, CAGR %)
Table 8.1 Leading National Plasma Fractionation by Regional and National Market Forecast 2017-2028 ($m, AGR %, CAGR%)
Table 8.2 Global Plasma Fractionation U.S. Market Forecast 2017-2028 ($m, AGR %, CAGR %, CAGR%)
Table 8.3 Global Plasma Fractionation Canada’s Market Forecast 2017-2028 ($m, AGR %, CAGR %)
Table 8.4 Global Plasma Fractionation U.K. Market Forecast 2017-2028 ($m, AGR %, CAGR %)
Table 8.5 Global Plasma Fractionation Germany’s Market Forecast 2017-2028 ($m, AGR %, CAGR %)
Table 8.6 Global Plasma Fractionation Italy’s Market Forecast 2017-2028 ($m, AGR %, CAGR %)
Table 8.7 Global Plasma Fractionation France’s Market Forecast 2017-2028 ($m, AGR %, CAGR %)
Table 8.8 Global Plasma Fractionation Spain’s Market Forecast 2017-2028 ($m, AGR %, CAGR %)
Table 8.9 Global Plasma Fractionation ROE’s Market Forecast 2017-2028 ($m, AGR %, CAGR %)
Table 8.10 Global Plasma Fractionation Japan’s Market Forecast 2017-2028 ($m, AGR %, CAGR %)
Table 8.11 Global Plasma Fractionation Rest of APAC’s Market Forecast 2017-2028 ($m, AGR %, CAGR %)
Table 9.1 Global Plasma Fractionation Rest of CSL’s Market Forecast 2017-2028 ($m, AGR %, CAGR %)
Table 9.2 Global Plasma Fractionation Rest of Shire/Baxalta’s Market Forecast 2017-2028 ($m, AGR %, CAGR %)
Table 9.3 Global Plasma Fractionation Rest of Grifols Market Forecast 2017-2028 ($m, AGR %, CAGR %)
Table 9.4 Global Plasma Fractionation Rest of OctaPharma’s Market Forecast 2017-2028 ($m, AGR %, CAGR %)
Table 9.5 Global Plasma Fractionation Rest of Biotest’s Market Forecast 2017-2028 ($m, AGR %, CAGR %)
Table 9.6 Global Plasma Fractionation Rest of LFB’s Market Forecast 2017-2028 ($m, AGR %, CAGR %)
Table 9.7 Global Plasma Fractionation Rest of KEDRION’s Market Forecast 2017-2028 ($m, AGR %, CAGR %)
Table 9.8 Global Plasma Fractionation Rest of Other Companies Market Forecast 2017-2028 ($m, AGR %, CAGR %)
Table 10.1 Leading 7 Plasma Fractionation Market: Ranking, Company, FY2017 Total Company Sales $m, FY2017 Sales in the Market $m, Share of FY2017 Total Sales from Sales in the Market $m, Primary Market Specialisation
Table 10.2 CSL Limited Profile 2017
Table 10.3 CSL Limited Total Company Sales 2013-2017 ($m), AGR %)
Table 10.4 CSL Limited Sales in the Plasma Fractionation Market 2016 -2017 ($m, AGR %)
Table 10.5 CSL Limited Net Income / Loss 2013-2017 ($m, AGR %)
Table 10.6 Shire Profile 2017
Table 10.7 Shire Total Company Sales 2013-2017 ($m, AGR %)
Table 10.8 Shire Sales in the Plasma Fractionation Market 2016 -2017 ($m), AGR %)
Table 10.9 Shire Net Income / Loss 2013-2017 ($m), AGR %)
Table 10.10 Grifols Profile 2017
Table 10.11 Grifols Total Company Sales 2013-2017 ($m), AGR %)
Table 10.12 Grifols Sales in the Plasma Fractionation Market 2016 -2017 ($m), AGR %)
Table 10.13 Grifols Net Income / Loss 2013-2017 ($m, AGR %)
Table 10.14 OctaPharma Profile 2017
Table 10.15 OctaPharma Total Company Sales 2013-2017 ($m, AGR %)
Table 10.16 OctaPharma Sales in the Plasma Fractionation Market 2016 -2017 ($m, AGR %)
Table 10.17 OctaPharma Net Income / Loss 2013-2017 ($m, AGR %)
Table 10.18 Biotest Profile 2017
Table 10.19 Biotest Total Company Sales 2013-2017 ($m, AGR %)
Table 10.20 Biotest Sales in the Plasma Fractionation Market 2016 -2017 ($m, AGR %)
Table 10.21 Biotest Net Income / Loss 2013-2017 ($m, AGR %)
Table 10.22 LFB Profile 2017
Table 10.23 LFB Total Company Sales 2013-2017 ($m, AGR %)
Table 10.24 LFB Sales in the Plasma Fractionation Market 2016 -2017 ($m, AGR %)
Table 10.25 LFB Net Income / Loss 2013-2017 ($m, AGR %)
Table 10.26 KEDRION Profile 2017
Table 10.27 KEDRION Total Company Sales 2013-2017 ($m, AGR %)
Table 10.28 KEDRION Sales in the Plasma Fractionation Market 2016 -2017 ($m, AGR %)
Table 10.29 KEDRION Net Income / Loss 2013-2017 ($m, AGR %)
Table 10.30 Other Companies Involved in the Plasma Fractionation Market 2017 (Company, Submarket Involvement, Location)
Table 11.1 Global Plasma Fractionation Market Forecast: Revenues ($m) 2017, 2028 and CAGR 2018-2028 (%)
List of Figures
Figure 2.1 Global Plasma Fractionation Market Segmentation Overview
Figure 3.1 Global Plasma Fractionation Market Forecast 2017-2028 ($m, AGR %)
Figure 4.1 Global Plasma Fractionation by Product Type Forecast 2017-2028 ($m)
Figure 4.2 Plasma Fractionation Market by Product Type Market Share Forecast 2018, 2023, 2028 (% Share)
Figure 4.3 Global Plasma Fractionation by Applications Forecast 2017-2028 ($m)
Figure 4.4 Plasma Fractionation Market by Applications Market Share Forecast 2018, 2023, 2028 (% Share)
Figure 4.5 Plasma Fractionation by Regional Market Forecast 2017-2028 ($m)
Figure 4.6 Plasma Fractionation Market by Regional Market Share Forecast 2018, 2023, 2028 (% Share)
Figure 4.7 Global Plasma Fractionation Countries Forecast 2018-2028 ($m)
Figure 4.8 Plasma Fractionation Market by Countries Market Share Forecast 2018, 2023, 2028 (% Share)
Figure 4.9 Global Plasma Fractionation by Companies Forecast 2017-2028 ($m)
Figure 4.10 Plasma Fractionation Market by Companies Market Share Forecast 2018, 2023, 2028 (% Share)
Figure 5.1 Global Plasma Fractionation Immunoglobulins Consumption in 2010
Figure 5.2 Global Plasma Fractionation Immunoglobulin’s Market Forecast 2017-2028 ($m, AGR %)
Figure 5.3 Global Plasma Fractionation Albumins Consumption in 2010
Figure 5.4 Global Plasma Fractionation Albumin’s Market Forecast 2017-2028 ($m, AGR %)
Figure 5.5 Global Plasma Fractionation Clotting Factor’s Market Forecast 2017-2028 ($m, AGR %)
Figure 5.6 Global Plasma Fractionation Hyperimmune Globulins Market Forecast 2017-2028 ($m, AGR %)
Figure 5.7 Global Plasma Fractionation A1PI’s Consumption in 2011
Figure 5.8 Global Plasma Fractionation A1PI’s Market Forecast 2017-2028 ($m, AGR %)
Figure 5.9 Global Plasma Fractionation C-1’s Market Forecast 2017-2028 ($m, AGR %)
Figure 5.10 Global Plasma Fractionation Other Product Types Market Forecast 2017-2028 ($m, AGR %)
Figure 6.1 Global Plasma Fractionation PID’s Market Forecast 2017-2028 ($m, AGR %)
Figure 6.2 Global Plasma Fractionation SID’s Market Forecast 2017-2028 ($m, AGR %)
Figure 6.3 Global Plasma Fractionation ITP’s Market Forecast 2017-2028 ($m, AGR %)
Figure 6.4 Global Plasma Fractionation Cardiac and Liver Surgery’s Market Forecast 2017-2028 ($m, AGR %)
Figure 6.5 Global Plasma Fractionation Emergency Medicine’s Market Forecast 2017-2028 ($m, AGR %)
Figure 6.6 Global Plasma Fractionation Hemophilia’s Market Forecast 2017-2028 ($m, AGR %)
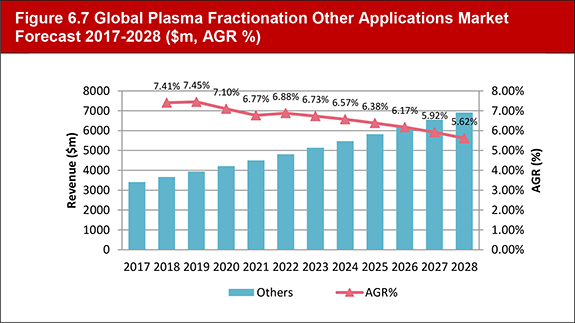
Figure 6.7 Global Plasma Fractionation Other Applications Market Forecast 2017-2028 ($m, AGR %)
Figure 7.1 Global Plasma Fractionation North America’s Market Forecast 2017-2028 ($m, AGR %)
Figure 7.2 North America Plasma Fractionation Market by Country Forecast 2017-2028 ($m)
Figure 7.3 North America Plasma Fractionation - Country Market Share 2017, 2023, 2028 (% Share)
Figure 7.4 Type of plasma processed in Europe from 1996 to 2012 non-profit organizations (Thousand Liters)
Figure 7.5 Type of plasma processed in Europe from 1996 to 2012 commercial companies (Thousand Liters)
Figure 7.6 Global Plasma Fractionation Europe’s Market Forecast 2017-2028 (US$m, AGR %)
Figure 7.7 Plasma Fractionation Europe-Sub Regional Market Forecast 2017-2028 ($m)
Figure 7.8 Europe Plasma Fractionation - Country Market Share 2017, 2023, 2028 (% Share)
Figure 7.9 Global Plasma Fractionation Latin America’s Market Forecast 2017-2028 ($m, AGR %)
Figure 7.10 Global Plasma Fractionation APAC’s Market Forecast 2017-2028 ($m, AGR %)
Figure 7.11 APAC Plasma Fractionation Market by Country Forecast 2017-2028 ($m)
Figure 7.12 APAC Plasma Fractionations – Country Market Share 2017, 2023, 2028 (% Share)
Figure 7.13 Global Plasma Fractionation Middle East & Africa’s Market Forecast 2017-2028 ($m, AGR %)
Figure 8.1 Global Plasma Fractionation by National Market Forecast 2018-2028 ($m)
Figure.8.2 Immunoglobulin- Monthly U.S. Distribution and 12 Month Rolling Average Distribution (2016/2017)
Figure 8.3 Albumin 5%-Monthly U.S. Distribution and 12 Month Rolling Average Distribution (2016/2017)
Figure 8.4 Global Plasma Fractionation U.S. Market Forecast 2017-2028 ($m, AGR %)
Figure 8.5 Canadian Plasma Shipments for Fractionation by Source
Figure 8.6 Canadian Cost of Plasma Protein Product by Product
Figure 8.7 Global Plasma Fractionation Canada’s Market Forecast 2017-2028 ($m, AGR %)
Figure 8.8 Immunoglobulin- Monthly United Kingdom Distribution and 12 Month Rolling Average Distribution (2016/2017)
Figure 8.9 Global Plasma Fractionation U.K. Market Forecast 2017-2028 ($m, AGR %)
Figure 8.10 Immunoglobulin- Monthly Germany Distribution and 12 Month Rolling Average Distribution (2016/2017)
Figure 8.11 Global Plasma Fractionation Germany’s Market Forecast 2017-2028 ($m, AGR %)
Figure 8.12 Immunoglobulin- Monthly Italy Distribution and 12 Month Rolling Average Distribution (2016/2017)
Figure 8.13 Global Plasma Fractionation Italy’s Market Forecast 2017-2028 ($m, AGR %)
Figure 8.14 Global Plasma Fractionation France’s Market Forecast 2017-2028 (U$m, AGR %)
Figure 8.15 Immunoglobulin- Monthly Spain Distribution and 12 Month Rolling Average Distribution (2016/2017)
Figure 8.16 Global Plasma Fractionation Spain’s Market Forecast 2017-2028 ($m, AGR %)
Figure 8.17 Immunoglobulin- Monthly Austria Distribution and 12 Month Rolling Average Distribution (2016/2017)
Figure 8.18 Immunoglobulin- Monthly Finland Distribution and 12 Month Rolling Average Distribution (2016/2017)
Figure 8.19 Immunoglobulin- Monthly Greece Distribution and 12 Month Rolling Average Distribution (2016/2017)
Figure 8.20 Immunoglobulin- Monthly Norway Distribution and 12 Month Rolling Average Distribution (2016/2017)
Figure 8.21 Immunoglobulin- Monthly Portugal Distribution and 12 Month Rolling Average Distribution (2016/2017)
Figure 8.22 Immunoglobulin- Monthly Sweden Distribution and 12 Month Rolling Average Distribution (2016/2017)
Figure 8.23 Immunoglobulin- Monthly Switzerland Distribution and 12 Month Rolling Average Distribution (2016/2017)
Figure 8.24 Global Plasma Fractionation ROE’s Market Forecast 2017-2028 ($m, AGR %)
Figure 8.25 Global Plasma Fractionation Japan’s Market Forecast 2017-2028 ($m, AGR %)
Figure 8.26 Global Plasma Fractionation APAC’s Market Forecast 2017-2028 ($m, AGR %)
Figure 9.1 Global Plasma Fractionation CSL’s Market Forecast 2017-2028 ($m, AGR %)
Figure 9.2 Global Plasma Fractionation Shire/Baxalta’s Market Forecast 2017-2028 ($m, AGR %)
Figure 9.3 Global Plasma Fractionation Grifols Market Forecast 2017-2028 ($m, AGR %)
Figure 9.4 Global Plasma Fractionation OctaPharma’s Market Forecast 2017-2028 ($m, AGR %)
Figure 9.5 Global Plasma Fractionation Biotest’s Market Forecast 2017-2028 ($m, AGR %)
Figure 9.6 Global Plasma Fractionation LFB’s Market Forecast 2017-2028 (US$m, AGR %)
Figure 9.7 Global Plasma Fractionation KEDRION’s Market Forecast 2017-2028 ($m, AGR %)
Figure 9.8 Global Plasma Fractionation Other Companies Market Forecast 2017-2028 ($m, AGR %)
Figure 10.1 CSL Limited Total Company Sales 2013-2017 ($m, AGR %)
Figure 10.2 CSL Limited Sales in the Plasma Fractionation Market 2016 -2017 ($m, AGR %)
Figure 10.3 CSL Limited Net Income / Loss 2013-2017 ($m, AGR %)
Figure 10.4 Shire Total Company Sales 2013-2017 ($m, AGR %)
Figure 10.5 Shire Sales in the Plasma Fractionation Market 2016 -2017 ($m, AGR %)
Figure 10.6 Shire Net Income / Loss 2013-2017 (US$m), AGR %)
Figure 10.7 Grifols Total Company Sales 2013-2017 ($m, AGR %)
Figure 10.8 Grifols Sales in the Plasma Fractionation Market 2016 -2017 ($m, AGR %)
Figure 10.9 Grifols Net Income / Loss 2013-2017 (US$m), AGR %)
Figure 10.10 OctaPharma Total Company Sales 2013-2017 ($m, AGR %)
Figure 10.11 OctaPharma Sales in the Plasma Fractionation Market 2016 -2017 ($m, AGR %)
Figure 10.12 OctaPharma Net Income / Loss 2013-2017 ($m, AGR %)
Figure 10.13 Biotest Total Company Sales 2013-2017 ($m, AGR %)
Figure 10.14 Biotest Sales in the Plasma Fractionation Market 2016 -2017 ($m, AGR %)
Figure 10.15 Biotest Net Income / Loss 2013-2017 ($m, AGR %)
Figure 10.16 LFB Total Company Sales 2013-2017 ($m), AGR %)
Figure 10.17 LFB Sales in the Plasma Fractionation Market 2016 -2017 ($m, AGR %)
Figure 10.18 LFB Net Income / Loss 2013-2017 ($m, AGR %)
Figure 10.19 KEDRION Total Company Sales 2013-2017 ($m, AGR %)
Figure 10.20 KEDRION Sales in the Plasma Fractionation Market 2016 -2017 ($m), AGR %)
Figure 10.21 KEDRION Net Income / Loss 2013-2017 ($m, AGR %)
Figure 11.1 Global Plasma Fractionation Market Forecast: Revenue ($m), 2017-2028