Military Space Strategies and Technologies – our new study reveals trends, opportunities, and predicted revenues
Where is the military space strategies and technologies market heading? If you are involved in this sector you must read this brand new report. Visiongain’s report shows you the potential revenues streams to 2028, assessing data, trends, opportunities and business prospects there.
Discover How to Stay Ahead
Our 222 page report provides 204 tables, charts, and graphs. Read on to discover the most lucrative areas in the industry and the future market prospects. Our new study lets you assess forecasted sales at overall world market, and regional level. See financial results, interviews, trends, opportunities, and revenue predictions. Much opportunity remains in this growing military space strategies and technologies market. See how to exploit the opportunities.
Forecasts from 2018-2028 and other analyses reveal the commercial prospects
• In addition to revenue forecasting to 2028, our new study provides you with recent results, growth rates, and market shares.
• You find original analyses, with business outlooks and developments.
• Discover qualitative analyses (including SWOT), product profiles and commercial developments.
Discover sales predictions for the world market and submarkets
Along with revenue prediction for the overall world market, you find revenue forecasts to 2028 for the following submarkets:
• Military Communications
• Military Earth Observation
• Military Space Based Space Surveillance
Our investigation discusses what stimulates and restrains business. Understand the dynamics of the industry and assess its potential future sales, discovering the critical factors likely to achieve success.
What are the prospects in the leading regions and countries?
You will discover individual revenue forecasts for 12 leading national markets from 2018-2028:
• Australia
• China
• France
• Germany
• India
• Israel
• Italy
• Russia
• Spain
• United Kingdom
• United States
• Rest of the World
There will be growth in established military space strategies and technologies markets and in developing countries. Our analyses show that the India in particular, will continue to achieve high revenue growth to 2028. Developments worldwide in the Military Space technology development will also influence the market.
Leading companies and the potential for market growth
Overall world revenue for military space strategies and technologies will reach $15.52bn in 2018, our work calculates. We predict strong revenue growth through to 2028. Our work identifies which organisations hold the greatest potential. Discover their capabilities, progress, and commercial prospects, helping you stay ahead.
What issues will affect the military space industry?
Our new report discusses the issues and events affecting the Military Space Strategies and Technologies market. You find discussions, including qualitative analyses:
• Emerging markets lack Military Satellite Capabilities
• Small Satellites are gaining attraction by many countries
• Increased demand for bandwidth of modern military systems
• New military satellite launches and upgradation programs
Find analysis of technological, commercial, and economic matters, with emphasis on the competitive landscape and business outlooks.
How the military space strategies and technologies report helps you
In summary, our 222 page report provides you with the following knowledge:
• Revenue forecasts to 2028 for the world military space strategies and technologies market – discover the industry’s prospects, finding the most lucrative places for investments and revenues
• Revenue forecasts to 2028 for the leading 12 national markets – Australia, China, France, Germany, India, Israel, Italy, Russia, Spain, United Kingdom, United States, Rest of the World
• Predicted revenues of 3 leading military space strategies and technologies submarkets to 2028 – see the potentials of top products
• Discussion of what stimulates and restrains companies and the market
• Prospects for established firms and those seeking to enter the market
Find quantitative and qualitative analyses with independent predictions. Receive information that only our report contains, staying informed with this invaluable business intelligence.
Information found nowhere else
With our survey you are less likely to fall behind in knowledge or miss opportunity. See how you could benefit your research, analyses, and decisions. Also see how you can save time and receive recognition for commercial insight.
Visiongain’s study is for everybody needing commercial analyses for the military space strategies and technologies market and leading companies. You find data, trends and predictions.
Get our report today Global Military Space Strategies and Technologies Market Report 2018-2028: Forecasts by Submarket (Military Communications, Military Earth Observation, Military Space Based Space Surveillance), Covering Technologies (Miniaturization, UAV Bandwidth Demand, IP routing in Space, Small Satellites). Avoid missing out – get our report now.
Visiongain is a trading partner with the US Federal Government
CCR Ref number: KD4R6
1.Report Overview
1.1 Military Space Strategies and Technologies Market Overview
1.2 Why You Should Read This Report
1.3 How This Report Delivers
1.4 Key Questions Answered by This Analytical Report Include:
1.5 Who is This Report For?
1.6 Methodology
1.6.1 Primary Research
1.6.2 Secondary Research
1.6.3 Market Evaluation & Forecasting Methodology
1.7 Frequently Asked Questions (FAQ)
1.8 Associated Visiongain Reports
1.9 About Visiongain
2. Introduction to the Military Space Strategies and Technologies Market
2.1 Military Space Strategies and Technologies Market Structure
2.2 Military Space Strategies and Technologies Market Definition
2.2.1 Military Communications Submarket Definition
2.2.2 Military Earth Observation Submarket Definition
2.2.3 Military Space Based Space Surveillance Submarket Definition
2.3 Significant Current and Future Developments in Military Space Strategies and Technologies Market
2.3.1 Miniaturization
2.3.2 UAV Bandwidth Demand
2.3.3 IP routing in Space
2.3.4 Small Satellites
3. Global Military Space Strategies and Technologies Market 2018-2028
3.1 Global Military Space Strategies and Technologies Market Forecast 2018-2028
3.2 Global Military Space Strategies and Technologies Market Drivers & Restraints 2018
3.2.1 Sources of Growth & Contraction in the Global Military Space Strategies and Technologies Market
4. Global Military Space Strategies and Technologies Submarket Forecast 2018-2028
4.1 Global Military Communications Submarket Forecast 2018-2028
4.1.1 Military Communications Analysis
4.2 Global Military Earth Observation Submarket Forecast 2018-2028
4.2.1 Military Earth Observation Analysis
4.3 Global Military Space Based Space Surveillance Submarket Forecast 2018-2028
4.3.1 Space Based Space Surveillance Analysis
5. Leading National Military Space Strategies and Technologies Market Forecast 2018-2028
5.1 Global Military Space Strategies and Technologies Market by National Market Share Forecast 2018-2028
5.2 Australian Military Space Strategies and Technologies Market Forecast 2018-2028
5.2.1 Australian Military Space Strategies and Technologies Market Contracts & Programmes
5.2.2 Australia budget of 2018 sees increased spending on Military Space Projects
5.2.3 Australian Military Space Strategies and Technologies Market Drivers & Restraints
5.3 Chinese Military Space Strategies and Technologies Market Forecast 2018-2028
5.3.1 Chinese Military Space Strategies and Technologies Market Contracts & Programmes
5.3.2 China Looks to Build Second Largest Global Military Satellite Fleet Over the Next Decade
5.3.3 Chinese Military Space Strategies and Technologies Market Drivers & Restraints
5.4 French Military Space Strategies and Technologies Market Forecast 2018-2028
5.4.1 French Military Space Strategies and Technologies Market Contracts & Programmes
5.4.2 French Military Space Strategies and Technologies Market Growth Driven by High Levels of European Cooperation and Comprehensive Replacement of Military Satellite Fleet
5.4.3 French Military Space Strategies and Technologies Market Drivers & Restraints
5.5 German Military Space Strategies and Technologies Market Forecast 2018-2028
5.5.1 German Military Space Strategies and Technologies Market Contracts & Programmes
5.5.2 Steady German Military Space Strategies And Technologies Market Growth Forecast As Country Seeks To Expand Independent Military Satellite Capability
5.5.3 German Military Space Strategies and Technologies Market Drivers & Restraints
5.6 Indian Military Space Strategies and Technologies Market Forecast 2018-2028
5.6.1 Indian Military Space Strategies and Technologies Market Contracts & Programmes
5.6.2 India Set to be Second-Fastest Growing Military Space Strategies and Technologies Market Over the Next Decade as Military Seeks Network-Centric Capability
5.6.3 Indian Military Space Strategies and Technologies Market Drivers & Restraints
5.7 Israeli Military Space Strategies and Technologies Market Forecast 2018-2028
5.7.1 Israeli Military Space Strategies and Technologies Market Contracts & Programmes
5.7.2 Increased Military Spending on Space Technologies Will Drive Continuous Market Growth
5.7.3 Israeli Military Space Strategies and Technologies Market Drivers & Restraints
5.8 Italian Military Space Strategies and Technologies Market Forecast 2018-2028
5.8.1 Italian Military Space Strategies and Technologies Market Contracts & Programmes
5.8.2 Italian Military Space Strategies and Technologies Market Set to Continue Revolving Around Dual-Use Military-Civilian Satellites and Cooperation with European Allies
5.8.3 Italian Military Space Strategies and Technologies Market Drivers & Restraints
5.9 Russian Military Space Strategies and Technologies Market Forecast 2018-2028
5.9.1 Russian Military Space Strategies and Technologies Market Contracts & Programmes
5.9.2 Russia Military Space market is expected to grow as there will be a rise in the military expenditure during the forecast period
5.9.3 Russian Military Space Strategies and Technologies Market Drivers & Restraints
5.10 Spanish Military Space Strategies and Technologies Market Forecast 2018-2028
5.10.1 Spanish Military Space Strategies and Technologies Market Contracts & Programmes
5.10.2 Replacement to Spanish Military Satellite SpainSat will drive military space strategies and technologies market growth from 2019
5.10.3 Spanish Military Space Strategies and Technologies Market Drivers & Restraints
5.11 UK Military Space Strategies and Technologies Market Forecast 2018-2028
5.11.1 UK Military Space Strategies and Technologies Market Contracts & Programmes
5.11.2 Skynet 5 Military Satellite Constellation Replacement Future Beyond Line of Sight Programme to Drive UK Spending Throughout Next Decade
5.11.3 UK Military Space Strategies and Technologies Market Drivers & Restraints
5.12 USA Military Space Strategies and Technologies Market Forecast 2018-2028
5.12.1 USA Military Space Strategies and Technologies Market Selected Contracts & Programmes
5.12.2 Analysis of US Military Space Strategies and Technologies Market Forecast
5.12.3 US Air Force Will Not Accept the Status Quo in Procuring Further US Military Satellites: Disaggregation and Standardisation of Launch Payloads Amongst the Solutions
5.12.5 USA Military Space Strategies and Technologies Market Drivers & Restraints
5.13 Rest of the World Military Space Strategies and Technologies Market Forecast 2018-2028
5.13.1 Rest of the World Military Space Strategies and Technologies Market Contracts & Programmes
5.13.2 Innovation in Civilian Space Sector Will Begin to Drive Down Costs in the Military Space Market Decreasing the Barriers to Entry Across the Rest of the World
5.13.3 NATO Nations See the Cost-Benefits of WGS Shareholding Over Leasing of Military Payloads on Commercial Platforms
5.13.4 Rest of the World Military Space Strategies and Technologies Market Drivers & Restraints
6. SWOT Analysis of the Military Space Strategies and Technologies Market 2018-2028
6.1 Strengths
6.1.1 Near-Exponential Increase in Bandwidth Demand
6.1.2 Civilian Space Sector Boom
6.1.3 Major Military Satellite Programmes to Launch Across the Decade
6.2 Weaknesses
6.2.1 High costs of Military Satellite Market Entry
6.2.2 Reliance of NATO and European States on US and French Military Satellite capability
6.2.3 Civilian Space Sector boom limited outside the US
6.2.4 Low Profit Margin and risk associated with some Military Satellite systems
6.3 Opportunities
6.3.1 Reduced Launch Costs
6.3.2 Introduction of More COTS Systems
6.3.3 New Markets in the Rest of the World
6.4 Threats
6.4.1 Increasing Complexity and Cost of Military Satellite Communication Payloads
6.4.2 Falling Defence Budgets
6.4.3 Slowing Economic Growth in Emerging Markets
6.4.4 Continued Restrictions in Emerging Markets
7. PEST Analysis of the Military Space Strategies and Technologies Market 2018-2028
8. Leading 8 Military Space Companies
8.1 Leading 8 Military Space Companies 2018
8.2 Airbus Group SE
8.2.1 Airbus Group SE Military Space Strategies and Technologies Selected Recent Contracts 2003-2017
8.2.2 Airbus Group SE Total Company Sales 2012-2017
8.2.3 Airbus Group SE Sales by Segment of Business 2013-2017
8.2.4 Airbus Group SE Net Income 2012-2017
8.2.5 Airbus Group SE Cost of Research & Development 2012-2017
8.2.6 Airbus Group SE Regional Emphasis / Focus
8.2.7 Airbus Group SE Organisational Structure / Subsidiaries
8.2.8 Airbus Group SE Mergers & Acquisitions (M&A) and Divestiture Activity
8.2.9 Airbus Group SE Analysis: Airbus Will Remain Market Leader in Europe With Large Current and Future Contracts But Must be Cognizant of Commercial Rivals
8.3 The Boeing Company
8.3.1 The Boeing Company Military Space Strategies and Technologies Selected Recent Contracts 2014-2017
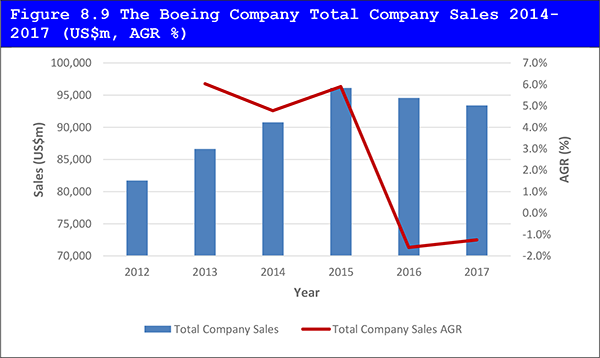
8.3.2 The Boeing Company Total Company Sales 2014-2017
8.3.4 The Boeing Company Net Income / Loss 2012-2017
8.3.5 The Boeing Company Cost of Research & Development 2012-2017
8.3.6 The Boeing Company Regional Emphasis / Focus
8.3.7 The Boeing Company Organisational Structure / Subsidiaries
8.3.8 The Boeing Company Mergers & Acquisitions (M&A) Activity
8.3.9 The Boeing Company Analysis: Boeing Seeks to Maintain Position as Second Largest Military Satellite Producer in the World by Exploiting Commercial Constellation Expertise
8.3.10 The Boeing Company Joint-Venture United Launch Alliance (ULA) Under Threat from SpaceX as Launch Service Provider
8.4 Inmarsat
8.4.1 Inmarsat Total Company Sales 2013-2017
8.4.2 Inmarsat Sales by Segment of Business 2015-2017
8.4.3 Inmarsat Net Income 2013-2017
8.4.4 Inmarsat Cost of Research & Development 2013-2016
8.4.5 Inmarsat Regional Emphasis / Focus
8.4.6 Inmarsat Organisational Structure
8.4.7 Inmarsat Analysis: Leading military satellite company providing best in class technology pertaining to military communications
8.5 Israel Aerospace Industries
8.5.1 Israel Aerospace Industries Military Space Strategies and Technologies Selected Recent Contracts 2012-2015
8.5.2 Israel Aerospace Industries Total Company Sales 2013-2017
8.5.3 Israel Aerospace Industries Sales by Segment of Business 2013-2017
8.5.4 Israel Aerospace Industries Net Income 2014-2017
8.5.5 Israel Aerospace Industries Cost of Research & Development 2012-2017
8.5.6 Israeli Aerospace Industries Regional Emphasis / Focus
8.5.7 Israel Aerospace Industries Organisational Structure
8.5.8 Israel Aerospace Industries Analysis: IAI’s Development of Military Satellite Ofeq 11 Offers Significant Chance for Company to Become Indian Contractor of Choice
8.6 ISS Reshetnev
8.6.1 ISS Reshetnev Military Space Strategies and Technologies Selected Recent Contracts & Programmes 2005-2020
8.6.2 ISS Reshetnev Regional Emphasis / Focus
8.6.3 ISS Reshetnev Analysis: Dubai Airshow Presence Indicates Willingness to Expand Beyond Domestic Military Space Market
8.7 Lockheed Martin Corporation
8.7.1 Lockheed Martin Corporation Military Space Strategies and Technologies Selected Recent Contracts 2014-2018
8.7.2 Lockheed Martin Corporation Total Company Sales 2012-2017
8.7.4 Lockheed Martin Corporation Net Income 2012-2017
8.7.5 Lockheed Martin Corporation Cost of Research & Development 2012-2017
8.7.6 Lockheed Martin Corporation Regional Emphasis / Focus
8.7.7 Lockheed Martin Corporation Organisational Structure / Subsidiaries
8.7.8 Lockheed Martin Corporation Military Satellites Products / Services
8.7.9 Lockheed Martin Corporation Mergers & Acquisitions (M&A) and Divestiture Activity
8.7.10 Lockheed Martin Corporation Analysis: Lockheed Martin to Remain Largest Military Satellite Producer in the World
8.8 Mitsubishi Electric Corporation
8.8.1 Mitsubishi Electric Corporation Total Company Sales 2012-2017
8.8.2 Mitsubishi Electric Corporation Sales by Segment of Business 2012-2017
8.8.3 Mitsubishi Electric Corporation Net Income 2012-2017
8.8.4 Mitsubishi Electric Corporation Cost of Research & Development 2012-2017
8.8.5 Mitsubishi Electric Corporation Regional Emphasis / Focus
8.8.6 Mitsubishi Electric Corporation Organisational Structure
8.8.7 Mitsubishi Electric Corporation Analysis: Mitsubishi Electric to Remain Largely Focussed on Commercial Satellite Market Where Regional Security Concerns Will Drive Growth
8.9 Space Exploration Technologies Corporation
8.9.1 Space Exploration Technologies Corporation Military Space Strategies and Technologies Selected Recent Contracts 2016-2018
8.9.2 Space Exploration Technologies Corporation Analysis: June 2018 contract sees SpaceX take strides into Satellite Launch Services market
8.9.3 With history of technological innovation SpaceX is well placed to make significant gains in Military Space Strategies and Technologies Market
8.10 Other Companies Involved in the Military Space Strategies and Technologies Market 2018
9. Conclusions and Recommendations
10. Glossary
Associated Visiongain Reports
Visiongain Report Sales Order Form
Appendix A
About Visiongain
Appendix B
Visiongain report evaluation form
List of Tables
Table 3.1 Global Military Space Strategies and Technologies Market Forecast 2018-2028 (US$m, AGR %, CAGR %, Cumulative)
Table 3.2 Global Military Space Strategies and Technologies Market Drivers & Restraints 2018
Table 4.1 Global Military Space Strategies and Technologies Submarket Forecast 2018-2028 (US$m, AGR %, CAGR %, Cumulative)
Table 4.2 Global Military Strategies and Technologies Submarket CAGR Forecast 2018-2023, 2023-2028, 2018-2028 (CAGR %)
Table 4.3 Global Military Space Strategies and Technologies Submarket Percentage Change in Market Share 2018-2023, 2023-2028, 2018-2028 (% Change)
Table 4.4 Global Military Communications Submarket Market Forecast 2018-2028 (US$m, AGR %, CAGR %,Cumulative)
Table 4.5 Global Military Earth Observation Submarket Market Forecast 2018-2028 (US$m, AGR %, CAGR %, Cumulative)
Table 4.6 Global Military Space Based Sapce Surveillance Submarket Market Forecast 2018-2028 (US$m, AGR %, CAGR %, Cumulative)
Table 5.1 Leading National Military Space Strategies and Technologies Market Forecast 2018-2028 (US$m, Global AGR %, Cumulative)
Table 5.2 Global Military Space Strategies and Technologies Submarket by National Market CAGR Forecast 2018-2023, 2023-2028, 2018-2028 (CAGR %)
Table 5.3 National Military Space Strategies and Technologies Market Percentage Change in Market Share 2018-2023, 2023-2028, 2018-2028 (% Change)
Table 5.4 Australian Military Space Strategies and Technologies Market Forecast 2018-2028 (US$m, AGR %, CAGR %, Cumulative)
Table 5.5 Australian Military Space Strategies and Technologies Market Major Contracts & Launches 2007 to 2018 (Date, Company, Value US$m, Details)
Table 5.6 Australian Military Space Strategies and Technologies Market Drivers & Restraints 2018
Table 5.7 Chinese Military Space Strategies and Technologies Market Forecast 2018-2028 (US$m, AGR %, CAGR %, Cumulative)
Table 5.8 Chinese Military Space Strategies and Technologies Market Major Contracts & Launches 2009-2017 (Company, Platform Designation, Launch dates, Description)
Table 5.9 Chinese Military Space Strategies and Technologies Market Drivers & Restraints 2018
Table 5.10 French Military Space Strategies and Technologies Market Forecast 2018-2028 (US$m, AGR %, CAGR %, Cumulative)
Table 5.11 French Military Space Strategies and Technologies Market Major Contracts & Launches 2010-2015 (Date, Company, Value US$m, Details)
Table 5.12 French Military Space Strategies and Technologies Market Drivers & Restraints 2018
Table 5.13 German Military Space Strategies and Technologies Market Forecast 2018-2028 (US$m, AGR %, CAGR %, Cumulative)
Table 5.14 German Military Space Strategies and Technologies Market Major Contracts & Launches 2013-2017 (Date, Company, Value US$m, Details)
Table 5.15 German Military Space Strategies and Technologies Market Drivers & Restraints 2018
Table 5.16 Indian Military Space Strategies and Technologies Market Forecast 2018-2028 (US$m, AGR %, CAGR %, Cumulative)
Table 5.17 Indian Military Space Strategies and Technologies Market Major Contracts & Launches 2009-2013 (Agency/Company, Platform Designation, Launch Dates, Description)
Table 5.18 Indian Military Space Strategies and Technologies Market Drivers & Restraints 2018
Table 5.19 Israeli Military Space Strategies and Technologies Market Forecast 2018-2028 (US$m, AGR %, CAGR %, Cumulative)
Table 5.20 Israeli Military Space Strategies and Technologies Market Major Contracts & Launches 2008-2014 (Company, Platform Designation, Launch Dates, Description)
Table 5.21 Israeli Military Space Strategies and Technologies Market Drivers & Restraints 2018
Table 5.22 Italian Military Space Strategies and Technologies Market Forecast 2018-2028 (US$m, AGR %, CAGR %, Cumulative)
Table 5.23 Italian Military Space Strategies and Technologies Market Major Contracts & Launches 2010-2017 (Date, Company, Value US$m, Details)
Table 5.24 Italian Military Space Strategies and Technologies Market Drivers & Restraints 2018
Table 5.25 Russian Military Space Strategies and Technologies Market Forecast 2018-2028 (US$m, AGR %, CAGR %, Cumulative)
Table 5.26 Russian Military Space Strategies and Technologies Market Major Contracts & Launches 2005-2020 (Company, Platform Designation, Launch dates, Description)
Table 5.27 Russian Military Space Strategies and Technologies Market Drivers & Restraints 2018
Table 5.28 Spanish Military Space Strategies and Technologies Market Forecast 2018-2028 (US$m, AGR %, CAGR %, Cumulative)
Table 5.29 Spanish Military Space Strategies and Technologies Market Major Contracts & Launches 2005-2014 (Launch Date, Company, Value US$m, Details)
Table 5.30 Spanish Military Space Strategies and Technologies Market Drivers & Restraints 2018
Table 5.31 UK Military Space Strategies and Technologies Market Forecast 2018-2028 (US$m, AGR %, CAGR %, Cumulative)
Table 5.32 UK Military Space Strategies and Technologies Market Major Contracts & Launches 2003 - 2017 (Date, Company, Value US$m, Details)
Table 5.33 UK Military Space Strategies and Technologies Market Drivers & Restraints 2018
Table 5.34 USA Military Space Strategies and Technologies Market Forecast 2018-2028 (US$m, AGR %, CAGR %, Cumulative)
Table 5.35 USA Military Space Strategies and Technologies Market Major Contracts & Launches 2014-2018 (Date, Company, Value US$m, Details)
Table 5.36 USA Military Space Strategies and Technologies Market Drivers & Restraints 2018
Table 5.37 Rest of the World Military Space Strategies and Technologies Market Forecast 2018-2028 (US$m, AGR %, CAGR %, Cumulative)
Table 5.38 Rest of the World Military Space Strategies and Technologies Market Major Contracts & Launches 2012-2018 (Date, Country, Value US$m, Details)
Table 5.39 Rest of the World Military Space Strategies and Technologies Market Drivers & Restraints 2018
Table 6.1 Global Military Space Strategies and Technologies Market SWOT Analysis 2018-2028
Table 7.1 Global Military Space Strategies and Technologies Market PEST Analysis 2018-2028
Table 8.1 Leading 8 Military Space Companies Listed Alphabetically (Company, FY2017 Total Company Sales (US$m), HQ)
Table 8.2 Airbus Group SE Profile 2018 (CEO, Total Company Sales US$m, Sales in the Defence and Space Market US$m, Share of Total Company Sales from Defence and Space Segment %, Net Income US$m, Strongest Business Region, Business Segment in the Market, Submarket Involvement, HQ, Founded, IR Contact, Ticker, Website)
Table 8.3 Selected Recent Airbus Group SE Military Space Strategies and Technologies Contracts 2003-2017 (Date, Country, Subcontractor, Value US$m, Details)
Table 8.4 Airbus Group SE Total Company Sales 2012-2017 (US$m, AGR %)
Table 8.5 Airbus Group SE Sales by Segment of Business 2012-2017 (US$m, AGR %)
Table 8.6 Airbus Group SE Net Income 2012-2017 (US$m, AGR %)
Table 8.7 Airbus Group SE Cost of Research & Development 2012-2017 (US$m, AGR %)
Table 8.8 Airbus Group SE Sales by Geographical Location 2012-2017 (US$m, AGR %)
Table 8.9 Airbus Group SE Subsidiaries 2018 (Subsidiary, Location)
Table 8.10 Airbus SE Mergers & Acquisitions and Divestitures 2010-2017 (Type of action, Date, Details)
Table 8.11 The Boeing Company Profile 2018 (CEO, Total Company Sales US$m, Sales in the Market US$m, Share of Company Sales from Defense, Space and Security Segment %, Net Income US$m, Strongest Business Region, Business Segment in the Market, HQ, Founded, IR Contact, Ticker, Website)
Table 8.12 Selected Recent The Boeing Company Military Space Strategies and Technologies Contracts 2014-2017 (Date, Country, Value US$m, Details)
Table 8.13 The Boeing Company Total Company Sales 2012-2017 (US$m, AGR %)
Table 8.14 The Boeing Company Sales by Segment of Business 2012-2017 (US$m, AGR %)
Table 8.15 The Boeing Company Net Income 2012-2017 (US$m, AGR %)
Table 8.16 The Boeing Company Cost of Research & Development 2012-2017 (US$m, AGR %)
Table 8.17 The Boeing Company Sales by Geographical Location 2012-2017 (US$m, AGR %)
Table 8.18 The Boeing Company Subsidiaries 2018 (Subsidiary, Location)
Table 8.19 The Boeing Company Mergers and Acquisitions 2008-2013 (Type of Activity, Date, Company Involved, Value US$m, Details)
Table 8.20 Inmarsat Profile 2018 (CEO, Total Company Sales US$m, Sales in the Market US$m, Share of Company Sales from Government Systems Segment %, Net Income / Loss US$m, Strongest Business Region, Business Segment in the Market, Submarket Involvement, HQ, Founded, IR Contact, Ticker, Website)
Table 8.21 Inmarsat Total Company Sales 2013-2017 (US$m, AGR %)
Table 8.22 Inmarsat Sales by Segment of Business 2015-2017 (US$m, AGR %)
Table 8.23 Inmarsat Net Income 2013-2017 (US$m, AGR %)
Table 8.24 Inmarsat Cost of Research & Development 2013-2017 (US$m, AGR %)
Table 8.25 Inmarsat Sales by Geographical Location 2013-2017 (US$m, AGR %)
Table 8.26 Inmarsat Subsidiaries 2018 (Subsidiary, Location)
Table 8.27 Israel Aerospace Industries Profile 2018 (CEO, Total Company Sales US$m, Net Income US$m, Strongest Business Region, Business Segment in the Market, Submarket Involvement, HQ, Founded, Ticker, Website)
Table 8.28 Selected Recent Israel Aerospace Industries Military Space Strategies and Technologies Contracts 2012-2015 (Date, Country, Value US$m, Details)
Table 8.29 Israel Aerospace Industries Total Company Sales 2013-2017 (US$m, AGR %)
Table 8.30 Israel Aerospace Industries Sales by Segment of Business 2013-2017 (US$m, AGR %)
Table 8.31 Israel Aerospace Industries Net Income 2014-2017 (US$m, AGR %)
Table 8.32 Israel Aerospace Industries Cost of Research & Development 2012-2017 (US$m, AGR %)
Table 8.33 ISS Reshetnev Profile 2018 (Director General, Total Company Sales US$m, Strongest Business Region, HQ, Founded, Website)
Table 8.34 Selected Recent ISS Reshetnev Military Space Startegies and Technologies Contracts / Programmes 2005-2020 (Launch Date, Country, Satellite Platform, Details)
Table 8.35 Lockheed Martin Corporation Profile 2018 (CEO, Total Company Sales US$m, Net Income US$m, Strongest Business Region, Business Segment in the Market, Submarket Involvement, HQ, Founded, IR Contact, Ticker, Website)
Table 8.36 Selected Recent Lockheed Martin Corporation Military Space Strategies and Technologies Contracts 2014-2018 (Date, Country, Value US$m, Details)
Table 8.37 Lockheed Martin Corporation Total Company Sales 2012-2017 (US$m, AGR %)
Table 8.38 Lockheed Martin Corporation Sales by Segment of Business 2012-2017 (US$m, AGR %)
Table 8.39 Lockheed Martin Corporation Net Income 2012-2017 (US$m, AGR %)
Table 8.40 Lockheed Martin Corporation Cost of Research & Development 2012-2017 (US$m, AGR %)
Table 8.41 Lockheed Martin Corporation Sales by Geographical Location 2012-2017 (US$m, AGR %)
Table 8.42 Lockheed Martin Corporation Subsidiaries 2018 (Subsidiary, Location)
Table 8.43 Lockheed Martin Corporation Military Satellites Products / Services (Segment of Business, Product, Specification / Features)
Table 8.44 Lockheed Martin Corporation Mergers & Acquisitions and Divestitures 2008-2016 (Type of activity, Date, Details)
Table 8.45 Mitsubishi Electric Corporation Profile 2018 (CEO, Total Company Sales US$m, Sales in the Information and Communication Systems Segment US$m, Share of Company Sales from Information and Communication Systems Segment %, Net Income US$m, Strongest Business Region, Business Segment in the Market, Submarket Involvement, HQ, Founded, IR Contact, Ticker, Website)
Table 8.46 Mitsubishi Electric Corporation Total Company Sales 2012-2017 (US$m, AGR %)
Table 8.47 Mitsubishi Electric Corporation Sales by Segment of Business 2012-2017 (US$m, AGR %)
Table 8.48 Mitsubishi Electric Corporation Net Income 2012-2017 (US$m, AGR %)
Table 8.49 Mitsubishi Electric Corporation Cost of Research & Development 2012-2017 (US$m, AGR %)
Table 8.50 Mitsubishi Electric Corporation Sales by Geographical Location 2012-2017 (US$m, AGR %)
Table 8.51 Space Exploration Technologies Corporation Profile 2018 (CEO, Strongest Business Region, Submarket Involvement, HQ, Founded, Website)
Table 8.52 Selected Space Exploration Technologies Corporation Military Space Strategies and Technologies Contracts 2016-2018 (Date, Value US$m, Details)
Table 8.53 Other Companies Involved in the Military Space Strategies and Technologies Market 2018 (Company, Revenue US$m, Location)
List of Figures
Figure 2.1 Global Military Space Strategies and Technologies Market Segmentation Overview
Figure 3.1 Global Military Space Strategies and Technologies Market Forecast 2018-2028 (US$m, AGR %)
Figure 4.1 Global Military Space Strategies and Technologies Submarket AGR Forecast 2018-2028 (AGR %)
Figure 4.2 Global Military Space Strategies and Technologies Submarket Forecast 2018-2028 (US$m, Global AGR %)
Figure 4.3 Global Military Space Strategies and Technologies Market by Submarket Share Forecast 2018 (% Share)
Figure 4.4 Global Military Space Strategies and Technologies Market by Submarket Share Forecast 2023 (% Share)
Figure 4.5 Global Military Space Strategies and Technologies Market by Submarket Share Forecast 2028 (% Share)
Figure 4.6 Global Military Space Strategies and Technologies Submarket CAGR Forecast 2018-2023 (CAGR %)
Figure 4.7 Global Military Space Strategies and Technologies Submarket CAGR Forecast 2023-2028 (CAGR %)
Figure 4.8 Global Military Space Strategies and Technologies Submarket CAGR Forecast 2018-2028 (CAGR %)
Figure 4.9 Global Military Space Strategies and Technologies Submarket Percentage Change in Market Share 2018-2023 (% Change)
Figure 4.10 Global Military Space Strategies and Technologies Submarket Percentage Change in Market Share 2023-2028 (% Change)
Figure 4.11 Global Military Space Strategies and Technologies Submarket Percentage Change in Market Share 2018-2028 (% Change)
Figure 4.12 Global Military Communications Submarket Market Forecast 2018-2028 (US$m, AGR %)
Figure 4.13 Global Military Communications Submarket Share Market Forecast 2018 (% Share)
Figure 4.14 Global Military Communications Submarket Share Market Forecast 2023 (% Share)
Figure 4.15 Global Military Communications Submarket Share Market Forecast 2028 (% Share)
Figure 4.16 Global Military Earth Observation Submarket Market Forecast 2018-2028 (US$m, AGR %)
Figure 4.17 Global Military Earth Observation Market Share Market Forecast 2018 (% Share)
Figure 4.18 Global Military Earth Observation Market Share Market Forecast 2023 (% Share)
Figure 4.19 Global Military Earth Observation Market Share Market Forecast 2028 (% Share)
Figure 4.20 Global Military Space Based Space Surveillance Submarket Market Forecast 2018-2028 (US$m, AGR %)
Figure 4.21 Global Military Space Based Space Surveillance Market Share Market Forecast 2018 (% Share)
Figure 4.22 Global Military Space Based Space Surveillance Market Share Market Forecast 2023 (% Share)
Figure 4.23 Global Military Space Based Space Surveillance Market Share Market Forecast 2028 (% Share)
Figure 5.1 Global Military Space Strategies and Technologies Market by National Market Forecast 2018-2028 (US$m, Global AGR %)
Figure 5.2 Global Military Space Strategies and Technologies Market by National Market AGR Forecast 2018-2028 (AGR %)
Figure 5.3 Leading National Military Space Strategies and Technologies Market CAGR Forecast 2018-2023 (CAGR %)
Figure 5.4 Leading National Military Space Strategies Market CAGR Forecast 2023-2028 (CAGR %)
Figure 5.5 Leading National Military Space Strategies and Technologies Market CAGR Forecast 2018-2028 (CAGR %)
Figure 5.6 Global Military Space Strategies and Technologies Market by National Market Share Forecast 2018 (% Share)
Figure 5.7 Global Military Space Strategies Market by National Market Share Forecast 2023 (% Share)
Figure 5.8 Global Military Space Strategies and Technologies Market by National Market Share Forecast 2028 (% Share)
Figure 5.9 Australian Military Space Strategies and Technologies Market Forecast 2018-2028 (AGR %)
Figure 5.10 Australian Military Space Strategies and Technologies Market Share Forecast 2018, 2023, 2028 (% Share)
Figure 5.11 Chinese Military Space Strategies and Technologies Market Forecast 2018-2028 (AGR %)
Figure 5.12 Chinese Military Space Strategies and Technologies Market Share Forecast 2018, 2023, 2028 (% Share)
Figure 5.13 French Military Space Strategies and Technologies Market Forecast 2018-2028 (AGR %)
Figure 5.14 French Military Space Strategies and Technologies Market Share Forecast 2018, 2023, 2028 (% Share)
Figure 5.15 German Military Space Strategies and Technologies Market Forecast 2018-2028 (AGR %)
Figure 5.16 German Military Space Strategies and Technologies Market Share Forecast 2018, 2023, 2028 (% Share)
Figure 5.17 Indian Military Space Strategies and Technologies Market Forecast 2018-2028 (AGR %)
Figure 5.18 Indian Military Space Strategies and Technologies Market Share Forecast 2018, 2023, 2028 (% Share)
Figure 5.19 Israeli Military Space Strategies and Technologies Market Forecast 2018-2028 (AGR %)
Figure 5.20 Israeli Military Space Strategies and Technologies Market Share Forecast 2018, 2023, 2028 (% Share)
Figure 5.21 Italian Military Space Strategies and Technologies Market Forecast 2018-2028 (AGR %)
Figure 5.22 Italian Military Space Strategies and Technologies Market Share Forecast 2018, 2023, 2028 (% Share)
Figure 5.23 Russian Military Space Strategies and Technologies Market Forecast 2018-2028 (AGR %)
Figure 5.24 Russian Military Space Strategies and Technologies Market Share Forecast 2018, 2023, 2028 (% Share)
Figure 5.25 Spanish Military Space Strategies and Technologies Market Forecast 2018-2028 (AGR %)
Figure 5.26 Spanish Military Space Strategies and Technologies Market Share Forecast 2018, 2023, 2028 (% Share)
Figure 5.27 UK Military Space Strategies and Technologies Market Forecast 2018-2028 (AGR %)
Figure 5.28 UK Military Space Strategies and Technologies Market Share Forecast 2018, 2023, 2028 (% Share)
Figure 5.29 USA Military Space Strategies and Technologies Market Forecast 2018-2028 (AGR %)
Figure 5.30 USA Military Space Strategies and Technologies Market Share Forecast 2018, 2023, 2028 (% Share)
Figure 5.31 Rest of the World Military Space Strategies and Technologies Market Forecast 2018-2028 (AGR %)
Figure 5.32 Rest of the World Market Share Forecast 2018, 2023, 2028 (% Share)
Figure 8.1 Airbus Group SE Total Company Sales 2012-2017 (US$m, AGR %)
Figure 8.2 Airbus Group SE Sales by Segment of Business 2013-2017 (US$m, Total Company Sales AGR %)
Figure 8.3 Airbus Group SE Net Income 2012-2017 (US$m, AGR %)
Figure 8.4 Airbus Group SE Cost of Research & Development 2012-2017 (US$m, AGR %)
Figure 8.5 Airbus Group SE Primary International Operations 2018
Figure 8.6 Airbus Group SE Sales AGR by Geographical Location 2012-2017 (AGR %)
Figure 8.7 Airbus Group SE Sales by Geographical Location 2012-2017 (US$m, Total Company Sales AGR %)
Figure 8.8 Airbus Group SE Organisational Structure 2018
Figure 8.9 The Boeing Company Total Company Sales 2014-2017 (US$m, AGR %)
Figure 8.10 The Boeing Company Net Income 2012-2017 (US$m, AGR %)
Figure 8.11 The Boeing Company Cost of Research & Development 2012-2017 (US$m, AGR %)
Figure 8.12 The Boeing Company Primary International Operations 2018
Figure 8.13 The Boeing Company Sales AGR by Geographical Location 2012-2017 (AGR %)
Figure 8.14 The Boeing Company Sales by Geographical Location 2012-2017 (US$m, Total Company Sales AGR %)
Figure 8.15 The Boeing Company Organisational Structure 2018
Figure 8.16 Inmarsat Total Company Sales 2013-2017 (US$m, AGR %)
Figure 8.17 Inmarsat Sales by Segment of Business 2015-2017 (US$m, Total Company Sales AGR %)
Figure 8.18 Inmarsat Net Income 2013-2017 (US$m, AGR %)
Figure 8.19 Inmarsat Cost of Research & Development 2013-2016 (US$m, AGR %)
Figure 8.20 Inmarsat Primary International Operations 2018
Figure 8.21 Inmarsat Sales AGR by Geographical Location 2013-2017 (AGR %)
Figure 8.22 Inmarsat Sales by Geographical Location 2013-2017 (US$m, Total Company Sales AGR %)
Figure 8.23 Inmarsat Organisational Structure 2018
Figure 8.24 Israel Aerospace Industries Total Company Sales 2013-2017 (US$m, AGR %)
Figure 8.25 Israel Aerospace Industries Sales by Segment of Business 2013-2017 (US$m, Total Company Sales AGR %)
Figure 8.26 Israel Aerospace Industries Sales AGR by Segment of Business 2013-2017 (AGR %)
Figure 8.27 Israel Aerospace Industries Net Income 2014-2017 (US$m, AGR %)
Figure 8.28 Israel Aerospace Industries Cost of Research & Development 2012-2017 (US$m, AGR %)
Figure 8.29 Israeli Aerospace Industries Primary International Operations 2018
Figure 8.30 Israel Aerospace Industries Organisational Structure 2018
Figure 8.31 ISS Reshetnev Primary International Operations 2018
Figure 8.32 Lockheed Martin Corporation Total Company Sales 2012-2017 (US$m, AGR %)
Figure 8.33 Lockheed Martin Corporation Net Income 2012-2017 (US$m, AGR %)
Figure 8.34 Lockheed Martin Corporation Cost of Research & Development 2012-2017 (US$m, AGR %)
Figure 8.35 Lockheed Martin Corporation Primary International Operations 2018
Figure 8.36 Lockheed Martin Corporation Organisational Structure 2018
Figure 8.37 Mitsubishi Electric Corporation Total Company Sales 2012-2017 (US$m, AGR %)
Figure 8.38 Mitsubishi Electric Corporation Sales by Segment of Business 2012-2017 (US$m, Total Company Sales AGR %)
Figure 8.39 Mitsubishi Electric Corporation Sales AGR by Segment of Business 2012-2017 (AGR %)
Figure 8.40 Mitsubishi Electric Corporation Net Income 2012-2017 (US$m, AGR %)
Figure 8.41 Mitsubishi Electric Corporation Cost of Research & Development 2012-2017 (US$m, AGR %)
Figure 8.42 Mitsubishi Electric Corporation Primary International Operations 2018
Figure 8.43 Mitsubishi Electric Corporation Sales AGR by Geographical Location 2012-2017 (AGR %)
Figure 8.44 Mitsubishi Electric Corporation Sales by Geographical Location 2012-2017 (US$m, Total Company Sales AGR %)
Figure 8.45 Mitsubishi Electric Corporation Organisational Structure 2018
Airbus Group SE
The Boeing Company
Inmarsat
Israel Aerospace Industries
ISS Reshentev
Lockheed Martin Corporation
Mitsubishi Electric Corporation
Space Exploration Technologies Corporation
DataPath Inc.
Honeywell International Inc.
LinQuest Corporation
Northrop Grumman Corporation
Pacific Defence Solutions LLC
SpaceQuest Ltd
SSL
Raytheon Company
Thales
Viasat Inc.
SES S.A.
Orbital ATK
Organisations Mentioned in This Report
The Defense Advanced Research Projects Agency (DARPA)
US Department of Defense (DoD)
National Aeronautics and Space Administration (NASA)
North Atlantic Treaty Organisation (NATO)
Securities and Exchange Commission (SEC)
United States Army Space and Missile Defense Command (USAMDC)