The world cancer immunotherapy market is expected to grow at a CAGR of 12.6% in the second half of the forecast period. The market reached $51.9bn in 2016, dominated by the monoclonal antibody segment which held 66.7% share of the market.
How this report will benefit you
Read on to discover how you can exploit the future business opportunities emerging in this sector.
In this brand new 165-page report you will receive 95 tables and 94 figures– all unavailable elsewhere.
The 165-page report provides clear detailed insight into the world cancer-treating drugs market. Discover the key drivers and challenges affecting the market.
By ordering and reading our brand-new report today you stay better informed and ready to act.
Report Scope
World cancer immunotherapy market forecasts to 2027
• This report also breaks down the revenue forecast for the world cancer immunotherapy market by Technology:
– Monoclonal Antibodies
– Cytokines & immunomodulators
– Others (Immune Checkpoint Inhibitors, Cell Therapy, Oncolytic Virus Immunotherapy)
Each submarket is further broken down by region: North America, South America, Europe, Asia-Pacific and ROW.
• This report also breaks down the revenue forecast for the world cancer immunotherapy market by Application:
– Lung Cancer
– Breast Cancer
– Colorectal cancer
– Melanoma Cancer
– Prostate Cancer
– Head & Neck Cancer,
– Others (Renal Cell Carcinoma, Cervical, Gastric, Lymphoma)
Each submarket is further broken down by region: North America, South America, Europe, Asia-Pacific and ROW.
• This report also breaks down the revenue forecast for the world cancer immunotherapy market by End User:
– Hospitals
– Cancer Research Centers
– Clinics
Each submarket is further broken down by region: North America, South America, Europe, Asia-Pacific and ROW.
• This report provides individual revenue forecasts to 2027 for these regional and national markets:
– North America: US, Canada, Mexico
– South America: Brazil, Argentina, Paraguay, Bolivia, Rest of South America
– Europe: The UK, Germany, France, Spain, Italy, Rest of Europe
– Asia-Pacific: China, Japan, India, Australia, Thailand, Rest of Asia-Pacific
– Rest of World: Middle East, Africa, Other Countries
• This report discusses trends in the industry and assesses drivers and restraints, as well as opportunities and threats. It also includes porters five force analysis; threat of new entrants, power of suppliers, power of buyers, rivalry among competitors and threat of substituents.
• Our study discusses the selected leading companies that are the major players in the cancer immunotherapy market:
– AstraZeneca
– Merck & Co., Inc. (Merck)
– Novartis
– Bristol-Myers Squibb (BMS)
– Roche
– Eli Lilly and Co.
– Pfizer
– Bayer
– Adaxic Inc
– Medtronic Plc
The report provides overviews of the companies, financial information, product portfolio, pipeline products and recent developments.
Visiongain’s study is intended for anyone requiring commercial analyses for the world Cancer Immunotherapy market. You find data, trends and predictions.
Buy our report today Global Cancer Immunotherapy Market to 2027: Monoclonal Antibodies, Cytokines & Immunomodulators, Immune Checkpoint Inhibitors, Cell Therapy, Oncolytic Virus Immunotherapy, Lung Cancer, Breast Cancer, Colorectal Cancer, Melanoma, Prostate Cancer, Head & Neck Cancer.
Visiongain is a trading partner with the US Federal Government
CCR Ref number: KD4R6
1. Report Overview
1.1 Global Cancer Immunotherapy Market Overview
1.2 Market Definition
1.3 Research Methodology
1.4 Primary Research
1.5 Secondary Research
1.6 Market Evaluation & Forecasting Methodology
1.7 Global Cancer Immunotherapy Market Segmentation
1.8 Overview of Findings
1.9 Why You Should Read This Report
1.10 How this report delivers?
1.11 Key Questions Answered by This Analytical Report
1.12 Frequently Asked Questions (FAQ)
1.13 Who is This Report For?
1.14 Associated Visiongain Reports
1.15 About Visiongain
2. Introduction to Cancer Immunotherapy Market
3. Global Cancer Immunotherapy Market Forecast to 2027
4. Global Cancer Immunotherapy Market by Technology: Market Forecast to 2027
4.1 Overview
4.2 Monoclonal antibodies
4.3 Cytokines & Immunomodulators
4.4 Others (Immune Checkpoint Inhibitors, Cell Therapy, Oncolytic Virus Immunotherapy)
5. Global Cancer Immunotherapy Market by Application: Market Forecast to 2027
5.1 Overview
5.2 Lung Cancer
5.3 Breast Cancer
5.4 Colorectal Cancer
5.5 Melanoma
5.6 Prostate Cancer
5.7 Head & Neck Cancer
5.8 Other Cancer types (Renal Cell Carcinoma, Cervical, Gastric, and Lymphoma)
6. Global Cancer Immunotherapy Market by End-User: Market Forecast to 2027
6.1 Hospitals
6.2 Cancer Research Centres
6.3 Clinics
7. Regional Cancer Immunotherapy Market Forecasts to 2027
7.1 Regional Cancer Immunotherapy Market Forecast 2016-2027
7.2 North American Cancer Immunotherapy Market Forecast 2016-2027
7.2.1 USA Cancer Immunotherapy Market Forecast 2016-2027
7.2.2 Canada Cancer Immunotherapy Market Forecast 2016-2027
7.2.3 Mexico Cancer Immunotherapy Market Forecast 2016-2027
7.3 South American Cancer Immunotherapy Market Forecast 2016-2027
7.3.1 Brazil Cancer Immunotherapy Market Forecast 2016-2027
7.3.2 Argentina Cancer Immunotherapy Market Forecast 2016-2027
7.3.3 Paraguay Cancer Immunotherapy Market Forecast 2016-2027
7.3.4 Bolivia Cancer Immunotherapy Market Forecast 2016-2027
7.3.5 Rest of South America Cancer Immunotherapy Market Forecast 2016-2027
7.4 European Cancer Immunotherapy Market Forecast 2016-2027
7.4.1 France Cancer Immunotherapy Market Forecast 2016-2027
7.4.2 Germany Cancer Immunotherapy Market Forecast 2016-2027
7.4.3 UK Cancer Immunotherapy Market Forecast 2016-2027
7.4.4 Spain Cancer Immunotherapy Market Forecast 2016-2027
7.4.5 Italy Cancer Immunotherapy Market Forecast 2016-2027
7.4.6 Rest of Europe Cancer Immunotherapy Market Forecast 2016-2027
7.5 Asia-Pacific Cancer Immunotherapy Market Forecast 2016-2027
7.5.1 China Cancer Immunotherapy Market Forecast 2016-2027
7.5.2 Japan Cancer Immunotherapy Market Forecast 2016-2027
7.5.3 India Cancer Immunotherapy Market Forecast 2016-2027
7.5.4 Australia Cancer Immunotherapy Market Forecast 2016-2027
7.5.5 Thailand Cancer Immunotherapy Market Forecast 2016-2027
7.5.6 Rest of Asia-Pacific Cancer Immunotherapy Market Forecast 2016-2027
7.6 Rest of World Cancer Immunotherapy Market Forecast 2016-2027
7.6.1 Middle East Cancer Immunotherapy Market Forecast 2016-2027
7.6.2 Africa Cancer Immunotherapy Market Forecast 2016-2027
7.6.3 Other Countries Cancer Immunotherapy Market Forecast 2016-2027
8. Cancer Immunotherapy Market, Qualitative Analysis, 2016-2027
8.1 Porter’s Five Forces Analysis of the Cancer Immunotherapy Market 2016-2027
8.2 Bargaining Power of Buyers (Low)
8.3 Bargaining Power of Suppliers (High)
8.4 Threat of New Entrants (Low)
8.5 Threat of Substitute Products (High)
8.6 Intensity of Competitive Rivalry (High)
8.7 Drivers & Restrains
8.8 Increasing Prevalence of Cancer
8.9 Increasing Research in Cancer Immunotherapy
8.10 High Cost of Cancer Immunotherapy
8.11 Increasing Funding for the Cancer Research by Governmental Organisations
8.12 Increasing Investment from Government, Public and Private Sector
8.13 Increased Focus Towards Advanced Treatment Protocols
8.14 Significant Unmet Need in Cancer Diagnosis
8.15 Increased Awareness to Reduce Healthcare Costs
8.16 Opportunities in Emerging Economies
9. Leading Companies in Cancer Immunotherapy Market
9.1 F. Hoffmann-La Roche AG
9.2 F. Hoffmann-La Roche AG: Company Overview
9.3 F. Hoffmann-La Roche AG: Business Performance
9.4 F. Hoffmann-La Roche AG: Product Portfolio
9.5 F. Hoffmann-La Roche AG: Recent Developments
9.6 Merck & Co., Inc.
9.7 Merck & Co., Inc.: Company Overview
9.8 Merck & Co., Inc.: Business Performance
9.9 Merck & Co., Inc.: Product Portfolio
9.10 Merck & Co., Inc.: Recent Development
9.11 Medtronic plc.
9.12 Medtronic plc.: Company Overview
9.13 Medtronic plc.: Business Performance
9.14 Medtronic plc.: Product Portfolio
9.15 Medtronic plc.: Recent Developments
9.16 Bristol-Myers Squibb
9.17 Bristol-Myers Squibb: Company Overview
9.18 Bristol-Myers Squibb: Product Portfolio
9.19 Bristol-Myers Squibb: Recent Developments
9.20 Novartis AG
9.21 Novartis AG: Company Overview
9.22 Novartis AG: Business Performance
9.23 Novartis AG: Product Portfolio
9.24 Novartis AG: Recent Developments
9.25 Pfizer Inc.
9.26 Pfizer Inc.: Company Overview
9.27 Pfizer Inc.: Business Performance
9.28 Pfizer Inc.: Product Portfolio
9.29 Pfizer Inc.: Recent Developments
9.30 Bayer AG
9.31 Bayer AG: Company Overview
9.32 Bayer AG: Business Performance
9.33 Bayer AG: Product Portfolio
9.34 Bayer AG: Recent Development
9.35 AstraZeneca Plc.
9.36 AstraZeneca Plc.: Company Overview
9.37 AstraZeneca Plc.: Business Performance
9.38 AstraZeneca Plc.: Product Portfolio
9.39 Eli Lilly and Company
9.40 Eli Lilly and Company: Company Overview
9.41 Eli Lilly and Company: Business Performance
9.42 Eli Lilly and Company: Product Portfolio
9.43 Eli Lilly and Company: Recent Development
9.44 Advaxis, Inc.
9.45 Advaxis, Inc.: Recent Development
9.46 Advaxis, Inc.: Business Performance
9.47 Advaxis, Inc.: Recent Development
10. Conclusions
10.1 Current Leading Segments
10.2 Leading Regional Markets
10.3 Emerging Markets
10.4 The Future of the Market?
Table of Tables
Table 2.1. Worldwide Estimated Incidence and Prevalence of all Cancer Types, (2012)
Table 3.1. Global Cancer Immunotherapy Market Forecast ($m, AGR%, CAGR%) 2016-2027
Table 4.1. Global Cancer Immunotherapy Market Forecast, by Technology ($m, AGR%, CAGR%) 2016-2027
Table 4.2. Types of Monoclonal Antibodies
Table 4.3. Therapeutic Monoclonal Antibodies Approved by FDA in 2015
Table 4.4. Global Monoclonal Antibodies for Cancer Immunotherapy Market Forecast, ($m, AGR%, CAGR%) 2016-2027
Table 4.5. Global Monoclonal Antibodies for Cancer Immunotherapy Market Forecast, by Geography, ($bn, AGR%, CAGR%) 2016-2027
Table 4.6. Global Cytokines & Immunomodulators for Cancer Immunotherapy Market Forecast, ($m, AGR%, CAGR%) 2016-2027
Table 4.7. Global Cytokines & Immunomodulators for Cancer Immunotherapy Market Forecast, by Geography ($million, AGR%, CAGR%) 2016-2027
Table 4.8. Global Others Technologies for Cancer Immunotherapy Market Forecast, ($m, AGR%, CAGR%) 2016-2027
Table 4.9. Global Other Technologies for Cancer Immunotherapy Market Forecast, by Geography ($m, AGR%, CAGR%) 2016-2027
Table 5.1. Top Cancer Type in 2012
Table 5.2. Global Cancer Immunotherapy Market, by Application ($m, AGR%, CAGR%) 2016-2027
Table 5.3. Types of Monoclonal Antibodies
Table 5.4. Global Cancer Immunotherapy Market for Lung Cancer, ($m, AGR%, CAGR) 2016-2027
Table 5.5. Global Cancer Immunotherapy Market for Lung Cancer, by Geography ($m, AGR%, CAGR%) 2016-2027
Table 5.6. Global Cancer Immunotherapy Market for Breast Cancer, ($m, AGR%, CAGR%) 2016-2027
Table 5.7. Global Cancer Immunotherapy Market for Breast Cancer, by Geography ($m, AGR%, CAGR%) 2016-2027
Table 5.8. Global Cancer Immunotherapy Market for Colorectal Cancer, ($m, AGR%, CAGR%) 2016-2027
Table 5.9. Global Cancer Immunotherapy Market for Colorectal Cancer, by Geography ($m, AGR%, CAGR%) 2016-2027
Table 5.10. Global Cancer Immunotherapy Market for Melanoma Cancer, ($m, AGR%, CAGR%) 2016-2027
Table 5.11. Global Cancer Immunotherapy Market for Melanoma Cancer, by Geography ($m, AGR%, CAGR%) 2016-2027
Table 5.12. Global Cancer Immunotherapy Market for Prostate Cancer, ($m, AGR%, CAGR%) 2016-2027
Table 5.13. Global Cancer Immunotherapy Market for Prostate Cancer, by Geography ($m, AGR%, CAGR%) 2016-2027
Table 5.14. Global Cancer Immunotherapy Market for Head & Neck Cancer, ($m, AGR%, CAGR%) 2016-2027
Table 5.15. Global Cancer Immunotherapy Market for Head & Neck Cancer, by Geography ($m, AGR%, CAGR%) 2016-2027
Table 5.16. Global Cancer Immunotherapy Market for Other Cancer types (Renal Cell Carcinoma, Cervical, Gastric, and Lymphoma), ($m, AGR%, CAGR%) 2016-2027
Table 5.17. Global Cancer Immunotherapy Market for Other Cancer Types (Renal Cell Carcinoma, Cervical, Gastric, and Lymphoma), by Geography ($m, AGR%, CAGR%) 2016-2027
Table 6.1. Global Cancer Immunotherapy Market, by End-User ($m, AGR%, CAGR%) 2016-2027
Table 6.2. Global Cancer Immunotherapy Market Forecast for Hospital ($m, AGR%, CAGR%) 2016-2027
Table 6.3. Global Cancer Immunotherapy Market Forecast for Hospital, by Geography ($m, AGR%, CAGR%) 2016-2027
Table 6.4. Funding Received by NCI ($m)
Table 6.5. Current Grants by Cancer Type as of August 2016
Table 6.6. Global Cancer Immunotherapy Market for Cancer Research Centres, ($m, AGR%, CAGR%) 2016-2027
Table 6.7. Global Cancer Immunotherapy Market Forecast for Cancer Research Centres, by Geography ($m, AGR%, CAGR%) 2016-2027
Table 6.8. Global Cancer Immunotherapy Market Forecast for Clinic, ($m, AGR%, CAGR%) 2016-2027
Table 6.9. Global Cancer Immunotherapy Market Forecast for Clinic, by Geography ($m, AGR%, CAGR%) 2016-2027
Table 7.1. Global Cancer Immunotherapy Market Forecast, by Geography ($m, AGR%, CAGR%) 2016-2027
Table 7.2. North America Cancer Immunotherapy Market Forecast, by Country ($m, AGR%, CAGR%) 2016-2027
Table 7.3. USA Cancer Immunotherapy Market Forecast, ($m, AGR%, CAGR%) 2016-2027
Table 7.4. Canada Cancer Immunotherapy Market Forecast, ($m, AGR%, CAGR%) 2016-2027
Table 7.5. Mexico Cancer Immunotherapy Market Forecast, ($m, AGR%, CAGR%) 2016-2027
Table 7.6. South America Cancer Immunotherapy Market Forecast, by Country ($m, AGR%, CAGR%) 2016-2027
Table 7.7. Brazil Cancer Immunotherapy Market Forecast, ($m, AGR%, CAGR%) 2016-2027
Table 7.8. Argentina Cancer Immunotherapy Market Forecast, ($m, AGR%, CAGR%) 2016-2027
Table 7.9. Paraguay Cancer Immunotherapy Market Forecast, ($m, AGR%, CAGR%) 2016-2027
Table 7.10. Bolivia Cancer Immunotherapy Market Forecast, ($m, AGR%, CAGR%) 2016-2027
Table 7.11. Rest of South America Cancer Immunotherapy Market Forecast, ($m, AGR%, CAGR%) 2016-2027
Table 7.12. European Cancer Immunotherapy Market Forecast, by Country ($m, AGR%, CAGR%) 2016-2027
Table 7.13. France Cancer Immunotherapy Market Forecast, ($m, AGR%, CAGR%) 2016-2027
Table 7.14. Germany Cancer Immunotherapy Market Forecast, ($m, AGR%, CAGR%) 2016-2027
Table 7.15. UK Cancer Immunotherapy Market Forecast, ($m, AGR%, CAGR%) 2016-2027
Table 7.16. Spain Cancer Immunotherapy Market Forecast, ($m, AGR%, CAGR%) 2016-2027
Table 7.17. Italy Cancer Immunotherapy Market Forecast, ($m, AGR%, CAGR%) 2016-2027
Table 7.18. Rest of European Cancer Immunotherapy Market Forecast, ($m, AGR%, CAGR%) 2016-2027
Table 7.19. Asia-Pacific Cancer Immunotherapy Market Forecast, by Country ($m, AGR%, CAGR%) 2016-2027
Table 7.20. China Cancer Immunotherapy Market Forecast, ($m, AGR%, CAGR%) 2016-2027
Table 7.21. Japan Cancer Immunotherapy Market Forecast, ($m, AGR%, CAGR%) 2016-2027
Table 7.22. India Cancer Immunotherapy Market Forecast, ($m, AGR%, CAGR%) 2016-2027
Table 7.23. Australia Cancer Immunotherapy Market Forecast, ($m, AGR%, CAGR%) 2016-2027
Table 7.24. Thailand Cancer Immunotherapy Market Forecast, ($m, AGR%, CAGR%) 2016-2027
Table 7.25. Rest of Asia-Pacific Cancer Immunotherapy Market Forecast, ($m, AGR%, CAGR%) 2016-2027
Table 7.26. Rest of World Cancer Immunotherapy Market Forecast, by Country ($m, AGR%, CAGR%) 2016-2027
Table 7.27. Middle East Cancer Immunotherapy Market Forecast, ($m, AGR%, CAGR%) 2016-2027
Table 7.28. Africa Cancer Immunotherapy Market Forecast, ($m, AGR%, CAGR%) 2016-2027
Table 7.29. Other Countries Cancer Immunotherapy Market Forecast, ($m, AGR%, CAGR%) 2016-2027
Table 9.1. F. Hoffmann-La Roche AG: Company Overview
Table 9.2. F. Hoffmann-La Roche AG: Product Portfolio
Table 9.3. F. Hoffmann-La Roche AG: Recent Developments
Table 9.4. Merck & Co., Inc.: Company Overview
Table 9.5. Merck & Co., Inc.: Product Portfolio
Table 9.6. Merck & Co., Inc.: Recent Development
Table 9.7. Medtronic plc.: Company Overview
Table 9.8. Medtronic plc.: Product Portfolio
Table 9.9. Medtronic plc.: Recent Developments
Table 9.10. Bristol-Myers Squibb: Company Overview
Table 9.11. Bristol-Myers Squibb: Product Portfolio
Table 9.12. Bristol-Myers Squibb: Recent Developments
Table 9.13 Novartis AG: Company Overview
Table 9.14. Novartis AG: Product Portfolio
Table 9.15. Novartis AG: Recent Developments
Table 9.16. Pfizer Inc.: Company Overview
Table 9.17. Pfizer Inc.: Product Portfolio
Table 9.18. Pfizer Inc.: Recent Development
Table 9.19. Bayer AG: Company Overview
Table 9.20. Bayer AG: Product Portfolio
Table 9.21. Bayer AG: Recent Development
Table 9.22. AstraZeneca Plc.: Company Overview
Table 9.23. AstraZeneca Plc.: Product Portfolio
Table 9.24. Eli Lilly and Company: Company Overview
Table 9.25. Eli Lilly and Company: Product Portfolio
Table 9.26. Eli Lilly and Company: Recent Development
Table 9.27. Advaxis, Inc.: Company Overview
Table 9.28. Advaxis, Inc.: Recent Developments
Table 10.1 Worldwide Estimated Prevalence of Cancer, 2012
Table of Figures
Figure 1.1. Cancer immunotherapy Market Segmentation
Figure 2.1 Top winning Strategies of Market Players in Cancer Immunotherapy, 2014-2016
Figure 3.1 Cancer Immunotherapy Market, by Technology, ($m), 2016-2027
Figure 3.2 Cancer Immunotherapy Market, by Application, ($m), 2016-2027
Figure 3.3 Cancer Immunotherapy Market, by End-User, ($m), 2016-2027
Figure 4.1 Cancer Immunotherapy Market, by Technology, Market Share (%), 2016
Figure 4.2 Cancer Immunotherapy Market, by Technology, Forecast ($bn) 2016-2027
Figure 4.3 Global Monoclonal Antibodies for Cancer Immunotherapy Market Forecast, by Geography, ($m) 2016-2027
Figure 4.4 Global Cytokines & Immunomodulators for Cancer Immunotherapy Market Forecast, by Geography, ($m) 2016-2027
Figure 4.5 Global Other Technologies for Cancer Immunotherapy Market Forecast, by Geography, ($m) 2016-2027
Figure 5.1. Global Cancer Immunotherapy Market, by Application, ($m) 2016-2027
Figure 5.2. Global Cancer Immunotherapy Market, by Application, Market Share (%), 2016
Figure 5.3. Global Cancer Immunotherapy Market for Lung Cancer Forecast, by Geography ($m) 2016-2027
Figure 5.4. Global Cancer Immunotherapy Market for Breast Cancer Forecast, by Geography ($m) 2016-2027
Figure 5.5. Global Cancer Immunotherapy Market for Colorectal Cancer Forecast, by Geography ($m) 2016-2027
Figure 5.6. Global Cancer Immunotherapy Market for Melanoma Cancer Forecast, by Geography ($m) 2016-2027
Figure 5.7. Global Cancer Immunotherapy Market for Prostate Cancer Forecast, by Geography ($m) 2016-2027
Figure 5.8. Global Cancer Immunotherapy Market for Head & Neck Cancer Forecast, by Geography ($m) 2016-2027
Figure 5.9. Global Cancer Immunotherapy Market for Other Cancer types (Renal Cell Carcinoma, Cervical, Gastric, and Lymphoma) Forecast, by Geography ($m) 2016-2027
Figure 6.1. Global Cancer Immunotherapy Market Forecast, by End-User, ($m) 2016-2027
Figure 6.2. Global Cancer Immunotherapy Market, by End-User, Market Share (%), 2016
Figure 6.3. Global Cancer Immunotherapy Market Forecast for Hospital, by Geography, ($m) 2016-2027
Figure 6.4. Global Cancer Immunotherapy Market Forecast for Cancer Research Centres, by Geography ($m) 2016-2027
Figure 6.5. Global Cancer Immunotherapy Market Forecast for Clinic, by Geography ($m) 2016-2027
Figure 7.1. Global Cancer Immunotherapy Market Forecast, by Geography, by Geography ($m) 2016-2027
Figure 7.2. Global Cancer Immunotherapy Market Forecast, by Geography, Market Share (%), 2016
Figure 7.3. North America Cancer Immunotherapy Market Forecast, by Country ($m) 2016-2027
Figure 7.4. North America Cancer Immunotherapy Market, by Country, Market Share (%), 2016
Figure 7.5. USA Cancer Immunotherapy Market Forecast ($m) 2016-2027
Figure 7.6. Estimation of diagnosis of Canadian Cancer Immunotherapy
Figure 7.7. Cancer Immunotherapy Market Forecast ($m) 2016-2027
Figure 7.8 Mexico Cancer Immunotherapy Market Forecast ($m) 2016-2027
Figure 7.9 South America Cancer Immunotherapy Market Forecast, by Country ($m) 2016-2027
Figure 7.10. South America Cancer Immunotherapy Market, by Country, Market Share (%), 2016
Figure 7.11. Brazil Cancer Immunotherapy Market Forecast ($m) 2016-2027
Figure 7.12. Argentina Cancer Immunotherapy Market Forecast ($m) 2016-2027
Figure 7.13. Paraguay Cancer Immunotherapy Market Forecast ($m) 2016-2027
Figure 7.14. Bolivia Cancer Immunotherapy Market Forecast ($m) 2016-2027
Figure 7.15. Rest of South America Cancer Immunotherapy Market Forecast ($m) 2016-2027
Figure 7.16. Europe Cancer Immunotherapy Market Forecast, by Country ($m) 2016-2027
Figure 7.17. Europe Cancer Immunotherapy Market, by Country, Market Share (%), 2016
Figure 7.18. France Cancer Immunotherapy Market Forecast ($m) 2016-2027
Figure 7.19. Germany Cancer Immunotherapy Market Forecast ($m) 2016-2027
Figure 7.20. UK Cancer Immunotherapy Market Forecast ($m) 2016-2027
Figure 7.21. Spain Cancer Immunotherapy Market Forecast ($m) 2016-2027
Figure 7.22. Italy Cancer Immunotherapy Market Forecast ($m) 2016-2027
Figure 7.23. Rest of Europe Cancer Immunotherapy Market Forecast ($m) 2016-2027
Figure 7.24. Asia-Pacific Cancer Immunotherapy Market Forecast, by Country ($m) 2016-2027
Figure 7.25. Asia-Pacific Cancer Immunotherapy Market, Market Share (%), 2016
Figure 7.26. Cancer Immunotherapy Market Forecast ($m) 2016-2027
Figure 7.27. Japan Cancer Immunotherapy Market Forecast ($m) 2016-2027
Figure 7.28. India Cancer Immunotherapy Market Forecast ($m) 2016-2027
Figure 7.29. Australia Cancer Immunotherapy Market Forecast ($m) 2016-2027
Figure 7.30. Thailand Cancer Immunotherapy Market Forecast ($m) 2016-2027
Figure 7.31. Rest of Asia-Pacific Cancer Immunotherapy Market Forecast ($m) 2016-2027
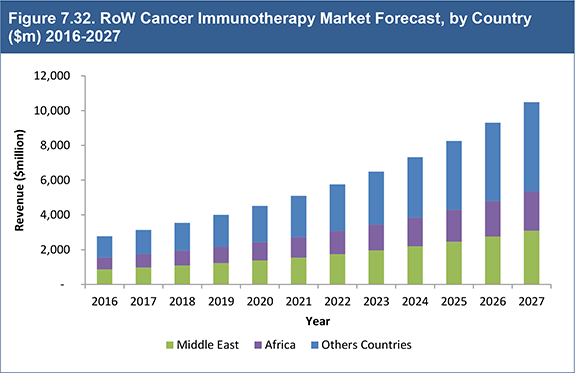
Figure 7.32. RoW Cancer Immunotherapy Market Forecast, by Country ($m) 2016-2027
Figure 7.33. Rest of World Cancer Immunotherapy Market, by Country, Market Share (%), 2016
Figure 7.34. Middle East Cancer Immunotherapy Market Forecast ($m) 2016-2027
Figure 7.35. Africa Cancer Immunotherapy Market Forecast ($m) 2016-2027
Figure 7.36. Other Countries Cancer Immunotherapy Market Forecast ($m) 2016-2027
Figure 8.1 Porter’s Five Forces Analysis of the Cancer Immunotherapy Market
Figure 9.1. F. Hoffmann-La Roche AG: Historical Revenue, ($m), 2012-2016
Figure 9.2. F. Hoffmann-La Roche AG, Product Segments Share (%), 2016
Figure 9.3. F. Hoffmann-La Roche AG, Geographical Presence Share (%), 2016
Figure 9.4. Merck & Co., Inc.: Historical Revenue, ($m), 2012–2016
Figure 9.5. Merck & Co., Inc., Product Segments Share (%), 2016
Figure 9.6. Merck & Co., Inc., Geographical Presence Share (%), 2016
Figure 9.7. Medtronic plc., Historical Revenue, ($m), 2012-2016
Figure 9.8. Medtronic plc., Product Segments Share (%), 2016
Figure 9.9. Medtronic plc., Geographical Presence Share (%), 2016
Figure 9.10. Bristol-Myers Squibb, Historical Revenue, ($m), 2012-2016
Figure 9.11. Bristol-Myers Squibb, Product Segments Share (%), 2016
Figure 9.12. Bristol-Myers Squibb, Geographical Presence Share (%), 2016
Figure 9.13. Novartis AG, Historical Revenue, ($m), 2012-2016
Figure 9.14. Novartis AG, Product Segments Share (%), 2016
Figure 9.15. Novartis AG, Geographical Presence Share (%), 2016
Figure 9.16. Pfizer Inc., Historical Revenue, ($m), 2012-2016
Figure 9.17. Pfizer Inc., Product Segments Share (%), 2016
Figure 9.18. Pfizer Inc., Geographical Presence Share (%), 2016
Figure 9.19. Bayer AG, Historical Revenue, ($m), 2012-2016
Figure 9.20. Bayer AG, Product Segments Share (%), 2016
Figure 9.21. Bayer AG, Geography Presence Share (%), 2016
Figure 9.22. AstraZeneca Plc., Historical Revenue, ($m), 2012-2016
Figure 9.23. AstraZeneca Plc., Product Segments Share (%), 2016
Figure 9.24. AstraZeneca Plc., Geographical Presence Share (%), 2016
Figure 9.25. Eli Lilly and Company, Historical Revenue, ($m), 2012-2016
Figure 9.26. Eli Lilly and Company, Product Segments Share (%), 2016
Figure 9.27. Eli Lilly and Company, Geographical Presence Share (%), 2016
Figure 9.28. Advaxis, Inc., Historical Revenue, ($m), 2014-2016
Figure 9.29. Advaxis, Inc., Product Segments Share (%), 2016
Figure 10.1 World Cancer Immunotherapy, by Technology, ($m), 2016-2027
Figure 10.2 World Cancer Immunotherapy, by Application, ($m), 2016-2027
Figure 10.3 World Cancer Immunotherapy, by End-User, ($m), 2016-2027
Figure 10.4 World Cancer Immunotherapy, by Geography, ($m) 2016-2027


