The Electric Motors Market Report 2023-2033: This report will prove invaluable to leading firms striving for new revenue pockets if they wish to better understand the industry and its underlying dynamics. It will be useful for companies that would like to expand into different industries or to expand their existing operations in a new region.
Accelerated Transition to Electric Mobility is Driving the Market Growth
The electric motor market is being driven by the soaring demand for electric vehicles (EVs) as governments, consumers, and industries worldwide seek cleaner and more sustainable transportation options. With growing concerns over greenhouse gas emissions and fossil fuel dependence, EVs offer a compelling solution, powered by electric motors. These motors are at the heart of EV propulsion, converting electrical energy into mechanical power to drive the vehicle. As governments implement stricter emission regulations and consumers embrace eco-friendly choices, the electric motor market is witnessing substantial growth. The trend is particularly evident in passenger cars, commercial vehicles, and public transport systems, fostering innovation and investment in electric motor technologies to meet the rising demand for efficient and powerful propulsion solutions.
Consumers Are Increasingly Valuing Sustainability with Their Vehicle Choices
Consumers are increasingly valuing sustainability, and their vehicle choices often reflect their commitment to reducing their environmental footprint. Electric vehicles powered by electric motors are seen as symbols of responsible consumption and environmental consciousness. Owning an electric vehicle enhances the owner’s image as an eco-conscious individual contributing to a greener future. This positive perception is reinforced by media coverage, celebrity endorsements, and government campaigns promoting electric mobility. As consumers seek to align their lifestyles with their values, the electric motor market benefits from this consumer-driven demand for environmentally friendly transportation options.
What Questions Should You Ask before Buying a Market Research Report?
• How is the electric motors market evolving?
• What is driving and restraining the electric motors market?
• How will each electric motors submarket segment grow over the forecast period and how much revenue will these submarkets account for in 2033?
• How will the market shares for each electric motor submarket develop from 2023 to 2033?
• What will be the main driver for the overall market from 2023 to 2033?
• Will leading electric motors markets broadly follow the macroeconomic dynamics, or will individual national markets outperform others?
• How will the market shares of the national markets change by 2033 and which geographical region will lead the market in 2033?
• Who are the leading players and what are their prospects over the forecast period?
• What are the electric motors projects for these leading companies?
• How will the industry evolve during the period between 2023 and 2033? What are the implications of electric motors projects taking place now and over the next 10 years?
• Is there a greater need for product commercialisation to further scale the electric motors market?
• Where is the electric motors market heading and how can you ensure you are at the forefront of the market?
• What are the best investment options for new product and service lines?
• What are the key prospects for moving companies into a new growth path and C-suite?
You need to discover how this will impact the electric motors market today, and over the next 10 years:
• Our 410-page report provides 127 tables and 196 charts/graphs exclusively to you.
• The report highlights key lucrative areas in the industry so you can target them – NOW.
• It contains in-depth analysis of global, regional and national sales and growth.
• It highlights for you the key successful trends, changes and revenue projections made by your competitors.
This report tells you TODAY how the electric motors market will develop in the next 10 years, and in line with the variations in COVID-19 economic recession and bounce. This market is more critical now than at any point over the last 10 years.
Forecasts to 2033 and other analyses reveal commercial prospects
• In addition to revenue forecasting to 2033, our new study provides you with recent results, growth rates, and market shares.
• You will find original analyses, with business outlooks and developments.
• Discover qualitative analyses (including market dynamics, drivers, opportunities, restraints and challenges), cost structure, impact of rising electric motors prices and recent developments.
This report includes data analysis and invaluable insight into how COVID-19 will affect the industry and your company. Four COVID-19 recovery patterns and their impact, namely, “V”, “L”, “W” and “U” are discussed in this report.
Segments Covered in the Report
Market Segment by Type
• AC Motors
• DC Motors
Market Segment by Power Output
• Integral HP Output
• Fractional HP Output
Market Segment by Voltage
• Low Voltage Motors
• Medium Voltage Motors
• High Voltage Motors
Market Segment by Power Rating
• <1 kW Motors
• 1–2.2 kW Motors
• 2.2–375 kW Motors
• 375 -500 kW Motors
• >500 kW Motors
Market Segment by Application
• Motor Vehicles
• Industrial Machinery
• HVAC Equipment
• Aerospace & Transportation
• Household Appliances
• Other Application

In addition to the revenue predictions for the overall world market and segments, you will also find revenue forecasts for four regional and 20 leading national markets:
North America
• U.S.
• Canada
Europe
• Germany
• Italy
• France
• Hungary
• Switzerland
• Rest of Europe
Asia Pacific
• China
• Japan
• India
• Vietnam
• South Korea
• Rest of Asia Pacific
Latin America
• Brazil
• Mexico
• Rest of Latin America
Middle East & Africa
• GCC
• South Africa
• Rest of Middle East & Africa
Need industry data? Please contact us today.
The report also includes profiles and for some of the leading companies in the Electric Motors Market, 2023 to 2033, with a focus on this segment of these companies’ operations.
Leading companies and the potential for market growth
• ABB Ltd
• AMETEK, Inc.
• ARC Systems, Inc.
• ASMO Co. Ltd.
• DENSO Corporation
• Emerson Electric Co.
• General Electric Company
• Hitachi, Ltd
• Johnson Electric
• Maxon Motor AG
• Nidec Corporation
• Robert Bosch GmbH
• Rockwell Automation, Inc.
• Siemens AG
• Toshiba Corporation
Overall world revenue for Electric Motors Market, 2023 to 2033 in terms of value the market will surpass US$132.8 billion in 2023, our work calculates. We predict strong revenue growth through to 2033. Our work identifies which organizations hold the greatest potential. Discover their capabilities, progress, and commercial prospects, helping you stay ahead.
How will the Electric Motors Market, 2023 to 2033 report help you?
In summary, our 410-page report provides you with the following knowledge:
• Revenue forecasts to 2033 for Electric Motors Market, 2023 to 2033 Market, with forecasts for type, power output, voltage, power rating, application, each forecast at a global and regional level – discover the industry’s prospects, finding the most lucrative places for investments and revenues.
• Revenue forecasts to 2033 for four regional and 20 key national markets – See forecasts for the Electric Motors Market, 2023 to 2033 market in North America, Europe, Asia-Pacific, Latin America and Middle East & Africa. Also forecasted is the market in the US, Canada, Brazil, Germany, France, Hungary, Switzerland, Italy, China, India, Japan, and Australia among other prominent economies.
• Prospects for established firms and those seeking to enter the market – including company profiles for 20 of the major companies involved in the Electric Motors Market, 2023 to 2033.
Find quantitative and qualitative analyses with independent predictions. Receive information that only our report contains, staying informed with invaluable business intelligence.
Information found nowhere else
With our new report, you are less likely to fall behind in knowledge or miss out on opportunities. See how our work could benefit your research, analyses, and decisions. Visiongain’s study is for everybody needing commercial analyses for the Electric Motors Market, 2023 to 2033, market-leading companies. You will find data, trends and predictions.
To access the data contained in this document please email contactus@visiongain.com
Buy our report today Electric Motors Market Report 2023-2033: Forecasts by Type (AC Motors, DC Motors), by Power Output (Integral HP Output, Fractional HP Output), by Voltage (Low Voltage Motors, Medium Voltage Motors, High Voltage Motors), by Power Rating (<1 kW Motors, 1–2.2 kW Motors, 2.2–375 kW Motors, 375-500 kW Motors, >500 kW Motors), by Application (Motor Vehicles, Industrial Machinery, HVAC Equipment, Aerospace & Transportation, Household Appliances, Other) AND Regional and Leading National Market Analysis PLUS Analysis of Leading Companies AND COVID-19 Impact and Recovery Pattern Analysis. Avoid missing out by staying informed – order our report now.
Visiongain is a trading partner with the US Federal Government
CCR Ref number: KD4R6
Do you have any custom requirements we can help you with? Any need for a specific country, geo region, market segment or specific company information? Contact us today, we can discuss your needs and see how we can help: contactus@visiongain.com
1 Report Overview
1.1 Objectives of the Study
1.2 Introduction to Electric Motors Market
1.3 What This Report Delivers
1.4 Why You Should Read This Report
1.5 Key Questions Answered by This Analytical Report
1.6 Who Is This Report for?
1.7 Methodology
1.7.1 Market Definitions
1.7.2 Market Evaluation & Forecasting Methodology
1.7.3 Data Validation
1.7.3.1 Primary Research
1.7.3.2 Secondary Research
1.8 Frequently Asked Questions (FAQs)
1.9 Associated Visiongain Reports
1.10 About Visiongain
2 Executive Summary
3 Market Overview
3.1 Key Findings
3.2 Market Dynamics
3.2.1 Market Driving Factors
3.2.1.1 Rising Demand for Energy-Efficient Motors in Industrial Applications
3.2.1.2 Increasing Adoption of Electric Vehicles (Evs) and Hybrid Vehicles
3.2.1.3 Integration of Electric Motors in Consumer Electronics and Appliances for Improved Efficiency
3.2.2 Market Restraining Factors
3.2.2.1 High Initial Cost and Maintenance of Electric Motors
3.2.2.2 Electric Motors Rely on Critical Materials Such as Rare Earth Elements, Which Can Lead to Supply Chain Vulnerabilities
3.2.2.3 Overheating and Potential Fire Hazards are Safety Concerns With High-Power Electric Motors, Necessitating Advanced Safety Measures
3.2.3 Market Opportunities
3.2.3.1 Improvement in Design Methods to Reduce Carbon Emissions
3.2.3.2 Technological Advancements in Electric Motor Technology
3.2.3.3 The Increasing Adoption of Automation and Robotics in Industries Creates a Demand for Precision Electric Motors
3.3 Porter’s Five Forces Analysis
3.3.1 Bargaining Power of Suppliers (Moderate)
3.3.2 Bargaining Power of Buyers (Moderate to High)
3.3.3 Competitive Rivalry (High)
3.3.4 Threat from Substitutes (Moderate)
3.3.5 Threat of New Entrants (Low)
3.4 COVID-19 Impact Analysis
3.4.1 “V-Shaped Recovery”
3.4.2 “U-Shaped Recovery”
3.4.3 “W-Shaped Recovery”
3.4.4 “L-Shaped Recovery”
3.5 PEST Analysis
4 Electric Motors Market Analysis by Type
4.1 Key Findings
4.2 Type Segment: Market Attractiveness Index
4.3 Electric Motors Market Size Estimation and Forecast by Type
4.4 AC Motors
4.4.1 Market Size by Region, 2023-2033 (US$ Billion)
4.4.2 Market Share by Region, 2023 & 2033 (%)
4.5 DC Motors
4.5.1 Market Size by Region, 2023-2033 (US$ Billion)
4.5.2 Market Share by Region, 2023 & 2033 (%)
5 Electric Motors Market Analysis by Power Output
5.1 Key Findings
5.2 Power Output Segment: Market Attractiveness Index
5.3 Electric Motors Market Size Estimation and Forecast by Power Output
5.4 Integral HP Output
5.4.1 Market Size by Region, 2023-2033 (US$ Billion)
5.4.2 Market Share by Region, 2023 & 2033 (%)
5.5 Fractional HP Output
5.5.1 Market Size by Region, 2023-2033 (US$ Billion)
5.5.2 Market Share by Region, 2023 & 2033 (%)
6 Electric Motors Market Analysis by Voltage
6.1 Key Findings
6.2 Voltage Segment: Market Attractiveness Index
6.3 Electric Motors Market Size Estimation and Forecast by Voltage
6.4 Low Voltage Motors
6.4.1 Market Size by Region, 2023-2033 (US$ Billion)
6.4.2 Market Share by Region, 2023 & 2033 (%)
6.5 Medium Voltage Motors
6.5.1 Market Size by Region, 2023-2033 (US$ Billion)
6.5.2 Market Share by Region, 2023 & 2033 (%)
6.6 High Voltage Motors
6.6.1 Market Size by Region, 2023-2033 (US$ Billion)
6.6.2 Market Share by Region, 2023 & 2033 (%)
7 Electric Motors Market Analysis by Power Rating
7.1 Key Findings
7.2 Power Rating Segment: Market Attractiveness Index
7.3 Electric Motors Market Size Estimation and Forecast by Power Rating
7.4 500 kW Motors
7.8.1 Market Size by Region, 2023-2033 (US$ Billion)
7.8.2 Market Share by Region, 2023 & 2033 (%)
8 Electric Motors Market Analysis by Application
8.1 Key Findings
8.2 Application Segment: Market Attractiveness Index
8.3 Electric Motors Market Size Estimation and Forecast by Application
8.4 Industrial Machinery
8.4.1 Market Size by Region, 2023-2033 (US$ Billion)
8.4.2 Market Share by Region, 2023 & 2033 (%)
8.5 Motor Vehicles
8.5.1 Market Size by Region, 2023-2033 (US$ Billion)
8.5.2 Market Share by Region, 2023 & 2033 (%)
8.6 HVAC Equipment
8.6.1 Market Size by Region, 2023-2033 (US$ Billion)
8.6.2 Market Share by Region, 2023 & 2033 (%)
8.7 Aerospace
8.7.1 Market Size by Region, 2023-2033 (US$ Billion)
8.7.2 Market Share by Region, 2023 & 2033 (%)
8.8 Household Appliances
8.8.1 Market Size by Region, 2023-2033 (US$ Billion)
8.8.2 Market Share by Region, 2023 & 2033 (%)
8.9 Others
8.9.1 Market Size by Region, 2023-2033 (US$ Billion)
8.9.2 Market Share by Region, 2023 & 2033 (%)
9 Electric Motors Market Analysis by Region
9.1 Key Findings
9.2 Regional Market Size Estimation and Forecast
10 North America Electric Motors Market Analysis
10.1 Key Findings
10.2 North America Electric Motors Market Attractiveness Index
10.3 North America Electric Motors Market by Country, 2023, 2028 & 2033 (US$ Billion)
10.4 North America Electric Motors Market Size Estimation and Forecast
10.5 North America Electric Motors Market Size Estimation and Forecast by Country
10.6 North America Electric Motors Market Size Estimation and Forecast by Type
10.7 North America Electric Motors Market Size Estimation and Forecast by Power Output
10.8 North America Electric Motors Market Size Estimation and Forecast by Voltage
10.9 North America Electric Motors Market Size Estimation and Forecast by Power Rating
10.10 North America Electric Motors Market Size Estimation and Forecast by Application
10.11 U.S. Electric Motors Market Analysis
10.12 Canada Electric Motors Market Analysis
11 Europe Electric Motors Market Analysis
11.1 Key Findings
11.2 Europe Electric Motors Market Attractiveness Index
11.3 Europe Electric Motors Market by Country, 2023, 2028 & 2033 (US$ Billion)
11.4 Europe Electric Motors Market Size Estimation and Forecast
11.5 Europe Electric Motors Market Size Estimation and Forecast by Country
11.6 Europe Electric Motors Market Size Estimation and Forecast by Type
11.7 Europe Electric Motors Market Size Estimation and Forecast by Power Output
11.8 Europe Electric Motors Market Size Estimation and Forecast by Voltage
11.9 Europe Electric Motors Market Size Estimation and Forecast by Power Rating
11.10 Europe Electric Motors Market Size Estimation and Forecast by Application
11.11 Germany Electric Motors Market Analysis
11.12 Italy Electric Motors Market Analysis
11.13 France Electric Motors Market Analysis
11.14 Hungary Electric Motors Market Analysis
11.15 Switzerland Electric Motors Market Analysis
11.16 Rest of Europe Electric Motors Market Analysis
12 Asia-Pacific Electric Motors Market Analysis
12.1 Key Findings
12.2 Asia-Pacific Electric Motors Market Attractiveness Index
12.3 Asia-Pacific Electric Motors Market by Country, 2023, 2028 & 2033 (US$ Billion)
12.4 Asia-Pacific Electric Motors Market Size Estimation and Forecast
12.5 Asia-Pacific Electric Motors Market Size Estimation and Forecast by Country
12.6 Asia-Pacific Electric Motors Market Size Estimation and Forecast by Type
12.7 Asia-Pacific Electric Motors Market Size Estimation and Forecast by Power Output
12.8 Asia-Pacific Electric Motors Market Size Estimation and Forecast by Voltage
12.9 Asia-Pacific Electric Motors Market Size Estimation and Forecast by Power Rating
12.10 Asia-Pacific Electric Motors Market Size Estimation and Forecast by Application
12.11 China Electric Motors Market Analysis
12.12 India Electric Motors Market Analysis
12.13 Japan Electric Motors Market Analysis
12.14 South Korea Electric Motors Market Analysis
12.15 Vietnam Electric Motors Market Analysis
12.16 Rest of Asia-Pacific Electric Motors Market Analysis
13 Middle East and Africa Electric Motors Market Analysis
13.1 Key Findings
13.2 Middle East and Africa Electric Motors Market Attractiveness Index
13.3 Middle East and Africa Electric Motors Market by Country, 2023, 2028 & 2033 (US$ Billion)
13.4 Middle East and Africa Electric Motors Market Size Estimation and Forecast
13.5 Middle East and Africa Electric Motors Market Size Estimation and Forecast by Country
13.6 Middle East and Africa Electric Motors Market Size Estimation and Forecast by Type
13.7 Middle East and Africa Electric Motors Market Size Estimation and Forecast by Power Output
13.8 Middle East and Africa Electric Motors Market Size Estimation and Forecast by Voltage
13.9 Middle East and Africa Electric Motors Market Size Estimation and Forecast by Power Rating
13.10 Middle East and Africa Electric Motors Market Size Estimation and Forecast by Application
13.11 GCC Electric Motors Market Analysis
13.12 South Africa Electric Motors Market Analysis
13.13 Rest of Middle East & Africa Electric Motors Market Analysis
14 Latin America Electric Motors Market Analysis
14.1 Key Findings
14.2 Latin America Electric Motors Market Attractiveness Index
14.3 Latin America Electric Motors Market by Country, 2023, 2028 & 2033 (US$ Billion)
14.4 Latin America Electric Motors Market Size Estimation and Forecast
14.5 Latin America Electric Motors Market Size Estimation and Forecast by Country
14.6 Latin America Electric Motors Market Size Estimation and Forecast by Type
14.7 Latin America Electric Motors Market Size Estimation and Forecast by Power Output
14.8 Latin America Electric Motors Market Size Estimation and Forecast by Voltage
14.9 Latin America Electric Motors Market Size Estimation and Forecast by Power Rating
14.10 Latin America Electric Motors Market Size Estimation and Forecast by Application
14.11 Brazil Electric Motors Market Analysis
14.12 Mexico Electric Motors Market Analysis
14.13 Rest of Latin America Electric Motors Market Analysis
15 Company Profiles
15.1 Competitive Landscape, 2022
15.2 Strategic Outlook
15.3 ABB Ltd
15.3.1 Company Snapshot
15.3.2 Company Overview
15.3.3 Financial Analysis
15.3.3.1 Net Revenue, 2018-2022
15.3.3.2 R&D, 2018-2022
15.3.3.3 Business Segment Revenue Share, 2022 (%)
15.3.4 Product Benchmarking
15.3.5 Strategic Outlook
15.4 General Electric Company
15.4.1 Company Snapshot
15.4.2 Company Overview
15.4.3 Financial Analysis
15.4.3.1 Net Revenue, 2018-2022
15.4.3.2 R&D, 2018-2022
15.4.3.3 Regional Revenue Share, 2022 (%)
15.4.3.4 Business Segment Revenue Share, 2022 (%)
15.4.4 Product Benchmarking
15.4.5 Strategic Outlook
15.5 Toshiba Corporation
15.5.1 Company Snapshot
15.5.2 Company Overview
15.5.3 Financial Analysis
15.5.3.1 Net Revenue, 2018-2022
15.5.3.2 R&D, 2018-2022
15.5.3.3 Regional Revenue Share, 2022 (%)
15.5.3.4 Business Segment Revenue Share, 2022 (%)
15.5.4 Product Benchmarking
15.5.5 Strategic Outlook
15.6 Hitachi, Ltd
15.6.1 Company Snapshot
15.6.2 Company Overview
15.6.3 Financial Analysis
15.6.3.1 Net Revenue, 2018-2022
15.6.3.2 Regional Revenue Share, 2022 (%)
15.6.3.3 Business Segment Revenue Share, 2022 (%)
15.6.4 Product Benchmarking
15.6.5 Strategic Outlook
15.7 Robert Bosch GmbH
15.7.1 Company Snapshot
15.7.2 Company Overview
15.7.3 Product Benchmarking
15.7.4 Strategic Outlook
15.8 Rockwell Automation, Inc.
15.8.1 Company Snapshot
15.8.2 Company Overview
15.8.3 Financial Analysis
15.8.3.1 Net Revenue, 2018-2022
15.8.3.2 R&D, 2018-2022
15.8.3.3 Regional Revenue Share, 2022 (%)
15.8.3.4 Business Segment Revenue Share, 2022 (%)
15.8.4 Product Benchmarking
15.9 Siemens AG
15.9.1 Company Snapshot
15.9.2 Company Overview
15.9.3 Financial Analysis
15.9.3.1 Net Revenue, 2018-2022
15.9.3.2 R&D, 2018-2022
15.9.3.3 Regional Revenue Share, 2022 (%)
15.9.3.4 Business Segment Revenue Share, 2022 (%)
15.9.4 Product Benchmarking
15.10 ARC Systems, Inc.
15.10.1 Company Snapshot
15.10.2 Company Overview
15.10.3 Product Benchmarking
15.11 ASMO Co. Ltd.
15.11.1 Company Snapshot
15.11.2 Company Overview
15.11.3 Product Benchmarking
15.12 Nidec Corporation
15.12.1 Company Snapshot
15.12.2 Company Overview
15.12.3 Financial Analysis
15.12.3.1 Net Revenue, 2018-2022
15.12.3.2 R&D, 2018-2022
15.12.3.3 Regional Revenue Share, 2022 (%)
15.12.3.4 Business Segment Revenue Share, 2022 (%)
15.12.4 Product Benchmarking
15.12.5 Strategic Outlook
15.13 DENSO Corporation
15.13.1 Company Snapshot
15.13.2 Company Overview
15.13.3 Financial Analysis
15.13.3.1 Net Revenue, 2018-2022
15.13.4 Product Benchmarking
15.13.5 Strategic Outlook
15.14 Emerson Electric Co.
15.14.1 Company Snapshot
15.14.2 Company Overview
15.14.3 Financial Analysis
15.14.3.1 Net Revenue, 2018-2022
15.14.3.2 R&D, 2018-2022
15.14.3.3 Regional Revenue Share, 2022 (%)
15.14.3.4 Business Segment Revenue Share, 2022 (%)
15.14.4 Product Benchmarking
15.15 Maxon Motor AG
15.15.1 Company Snapshot
15.15.2 Company Overview
15.15.3 Product Benchmarking
15.16 AMETEK, Inc.
15.16.1 Company Snapshot
15.16.2 Company Overview
15.16.3 Financial Analysis
15.16.3.1 Net Revenue, 2018-2022
15.16.3.2 R&D, 2018-2022
15.16.3.3 Regional Revenue Share, 2022 (%)
15.16.3.4 Business Segment Revenue Share, 2022 (%)
15.16.4 Product Benchmarking
15.16.5 Strategic Outlook
15.17 Johnson Electric
15.17.1 Company Snapshot
15.17.2 Company Overview
15.17.3 Financial Analysis
15.17.3.1 Net Revenue, 2018-2022
15.17.3.2 Regional Revenue Share, 2022 (%)
15.17.3.3 Business Segment Revenue Share, 2022 (%)
15.17.4 Product Benchmarking
15.17.5 Strategic Outlook
16 Conclusion and Recommendations
16.1 Concluding Remarks from Visiongain
16.2 Recommendations for Market Players
List of Tables
Table 1 Electric Motors Market Snapshot, 2023 & 2033 (US$ Billion, CAGR %)
Table 2 Production of Crude Oil, Natural Gas Production & Petroleum Products
Table 3 Appliances for Improved Efficiency and their watts
Table 4 Global Electric Motors Market by Region, 2023-2033 (US$ Bn, AGR (%), CAGR (%)) (V-Shaped Recovery Scenario)
Table 5 Global Electric Motors Market by Region, 2023-2033 (US$ Bn, AGR (%), CAGR (%)) (U-Shaped Recovery Scenario)
Table 6 Global Electric Motors Market by Region, 2023-2033 (US$ Bn, AGR (%), CAGR (%)) (W-Shaped Recovery Scenario)
Table 7 Global Electric Motors Market by Region, 2023-2033 (US$ Bn, AGR (%), CAGR (%)) (L-Shaped Recovery Scenario)
Table 8 Global Electric Motors Market by Type, 2023-2033 (US$ Bn, AGR (%), CAGR (%))
Table 9 AC motors Market by Region, 2023-2033 (US$ Bn, AGR (%), CAGR (%))
Table 10 DC motors Market by Region, 2023-2033 (US$ Bn, AGR (%), CAGR (%))
Table 11 Global Electric Motors Market by Power Output, 2023-2033 (US$ Bn, AGR (%), CAGR (%))
Table 12 Integral HP Output Market by Region, 2023-2033 (US$ Bn, AGR (%), CAGR (%))
Table 13 Fractional HP Output Market by Region, 2023-2033 (US$ Bn, AGR (%), CAGR (%))
Table 14 Global Electric Motors Market by Voltage, 2023-2033 (US$ Bn, AGR (%), CAGR (%))
Table 15 Low Voltage Motors Market by Region, 2023-2033 (US$ Bn, AGR (%), CAGR (%))
Table 16 Medium Voltage Motors Market by Region, 2023-2033 (US$ Bn, AGR (%), CAGR (%))
Table 17 High Voltage Motors Market by Region, 2023-2033 (US$ Bn, AGR (%), CAGR (%))
Table 18 Global Electric Motors Market by Power Rating, 2023-2033 (US$ Bn, AGR (%), CAGR (%))
Table 19 List of "<1 kW Motors Manufacturer in India
Table 20 500 kW Motors Market by Region, 2023-2033 (US$ Bn, AGR (%), CAGR (%))
Table 25 Global Electric Motors Market by Application, 2023-2033 (US$ Bn, AGR (%), CAGR (%))
Table 26 Industrial Machinery Market by Region, 2023-2033 (US$ Bn, AGR (%), CAGR (%))
Table 27 Motor Vehicles Market by Region, 2023-2033 (US$ Bn, AGR (%), CAGR (%))
Table 28 HVAC Equipment Market by Region, 2023-2033 (US$ Bn, AGR (%), CAGR (%))
Table 29 Aerospace & Transportation Market by Region, 2023-2033 (US$ Bn, AGR (%), CAGR (%))
Table 30 Household Appliances Market by Region, 2023-2033 (US$ Bn, AGR (%), CAGR (%))
Table 31 Other Application Market by Region, 2023-2033 (US$ Bn, AGR (%), CAGR (%))
Table 32 Electric Motors Market Forecast by Region, 2023-2033 (US$ Billion, AGR%, CAGR%)
Table 33 North America Electric Motors Market by Value, 2023-2033 (US$ Bn, AGR (%), CAGR (%))
Table 34 North America Electric Motors Market by Country, 2023-2033 (US$ Bn, AGR (%), CAGR (%))
Table 35 North America Electric Motors Market by Type, 2023-2033 (US$ Bn, AGR (%), CAGR (%))
Table 36 North America Electric Motors Market by Power Output, 2023-2033 (US$ Bn, AGR (%), CAGR (%))
Table 37 North America Electric Motors Market by Voltage, 2023-2033 (US$ Bn, AGR (%), CAGR (%))
Table 38 North America Electric Motors Market by Power Rating, 2023-2033 (US$ Bn, AGR (%), CAGR (%))
Table 39 North America Electric Motors Market by Application, 2023-2033 (US$ Bn, AGR (%), CAGR (%))
Table 40 US Electric Motors Market by Value, 2023-2033 (US$ Bn, AGR (%), CAGR (%))
Table 41 Canada Electric Motors Market by Value, 2023-2033 (US$ Bn, AGR (%), CAGR (%))
Table 42 Europe Electric Motors Market by Value, 2023-2033 (US$ Bn, AGR (%), CAGR (%))
Table 43 Europe Electric Motors Market by Country, 2023-2033 (US$ Bn, AGR (%), CAGR (%))
Table 44 Europe Electric Motors Market by Type, 2023-2033 (US$ Bn, AGR (%), CAGR (%))
Table 45 Europe Electric Motors Market by Power Output, 2023-2033 (US$ Bn, AGR (%), CAGR (%))
Table 46 Europe Electric Motors Market by Voltage, 2023-2033 (US$ Bn, AGR (%), CAGR (%))
Table 47 Europe Electric Motors Market by Power Rating, 2023-2033 (US$ Bn, AGR (%), CAGR (%))
Table 48 Europe Electric Motors Market by Application, 2023-2033 (US$ Bn, AGR (%), CAGR (%))
Table 49 Germany Electric Motors Market by Value, 2023-2033 (US$ Bn, AGR (%), CAGR (%))
Table 50 Italy Electric Motors Market by Value, 2023-2033 (US$ Bn, AGR (%), CAGR (%))
Table 51 France Electric Motors Market by Value, 2023-2033 (US$ Bn, AGR (%), CAGR (%))
Table 52 Hungary Electric Motors Market by Value, 2023-2033 (US$ Bn, AGR (%), CAGR (%))
Table 53 Switzerland Electric Motors Market by Value, 2023-2033 (US$ Bn, AGR (%), CAGR (%))
Table 54 Rest of Europe Electric Motors Market by Value, 2023-2033 (US$ Bn, AGR (%), CAGR (%))
Table 55 Asia-Pacific Electric Motors Market by Value, 2023-2033 (US$ Bn, AGR (%), CAGR (%))
Table 56 Asia-Pacific Electric Motors Market by Country, 2023-2033 (US$ Bn, AGR (%), CAGR (%))
Table 57 Asia-Pacific Electric Motors Market by Type, 2023-2033 (US$ Bn, AGR (%), CAGR (%))
Table 58 Asia-Pacific Electric Motors Market by Power Output, 2023-2033 (US$ Bn, AGR (%), CAGR (%))
Table 59 Asia-Pacific Electric Motors Market by Voltage, 2023-2033 (US$ Bn, AGR (%), CAGR (%))
Table 60 Asia-Pacific Electric Motors Market by Power Rating, 2023-2033 (US$ Bn, AGR (%), CAGR (%))
Table 61 Asia-Pacific Electric Motors Market by Application, 2023-2033 (US$ Bn, AGR (%), CAGR (%))
Table 62 China Electric Motors Market by Value, 2023-2033 (US$ Bn, AGR (%), CAGR (%))
Table 63 India Electric Motors Market by Value, 2023-2033 (US$ Bn, AGR (%), CAGR (%))
Table 64 Japan Electric Motors Market by Value, 2023-2033 (US$ Bn, AGR (%), CAGR (%))
Table 65 South Korea Electric Motors Market by Value, 2023-2033 (US$ Bn, AGR (%), CAGR (%))
Table 66 Vietnam Electric Motors Market by Value, 2023-2033 (US$ Bn, AGR (%), CAGR (%))
Table 67 Rest of Asia-Pacific Electric Motors Market by Value, 2023-2033 (US$ Bn, AGR (%), CAGR (%))
Table 68 Middle East & Africa Electric Motors Market by Value, 2023-2033 (US$ Bn, AGR (%), CAGR (%))
Table 69 Middle East & Africa Electric Motors Market by Country, 2023-2033 (US$ Bn, AGR (%), CAGR (%))
Table 70 Middle East & Africa Electric Motors Market by Type, 2023-2033 (US$ Bn, AGR (%), CAGR (%))
Table 71 Middle East & Africa Electric Motors Market by Power Output, 2023-2033 (US$ Bn, AGR (%), CAGR (%))
Table 72 Middle East & Africa Electric Motors Market by Voltage, 2023-2033 (US$ Bn, AGR (%), CAGR (%))
Table 73 Middle East & Africa Electric Motors Market by Power Rating, 2023-2033 (US$ Bn, AGR (%), CAGR (%))
Table 74 Middle East & Africa Electric Motors Market by Application, 2023-2033 (US$ Bn, AGR (%), CAGR (%))
Table 75 GCC Electric Motors Market by Value, 2023-2033 (US$ Bn, AGR (%), CAGR (%))
Table 76 South Africa Electric Motors Market by Value, 2023-2033 (US$ Bn, AGR (%), CAGR (%))
Table 77 Rest of Middle East & Africa Electric Motors Market by Value, 2023-2033 (US$ Bn, AGR (%), CAGR (%))
Table 78 Latin America Electric Motors Market by Value, 2023-2033 (US$ Bn, AGR (%), CAGR (%))
Table 79 Latin America Electric Motors Market by Country, 2023-2033 (US$ Bn, AGR (%), CAGR (%))
Table 80 Latin America Electric Motors Market by Type, 2023-2033 (US$ Bn, AGR (%), CAGR (%))
Table 81 Latin America Electric Motors Market by Power Output, 2023-2033 (US$ Bn, AGR (%), CAGR (%))
Table 82 Latin America Electric Motors Market by Voltage, 2023-2033 (US$ Bn, AGR (%), CAGR (%))
Table 83 Latin America Electric Motors Market by Power Rating, 2023-2033 (US$ Bn, AGR (%), CAGR (%))
Table 84 Latin America Electric Motors Market by Application, 2023-2033 (US$ Bn, AGR (%), CAGR (%))
Table 85 Brazil Electric Motors Market by Value, 2023-2033 (US$ Bn, AGR (%), CAGR (%))
Table 86 Mexico Electric Motors Market by Value, 2023-2033 (US$ Bn, AGR (%), CAGR (%))
Table 87 Rest of Latin America Electric Motors Market by Value, 2023-2033 (US$ Bn, AGR (%), CAGR (%))
Table 88 Strategic Outlook - Contract
Table 89 ABB Ltd: Key Details, (CEO, HQ, Revenue, Founded, No. of Employees, Company Type, Website, Business Segment)
Table 90 ABB Ltd: Product Benchmarking
Table 91 ABB Ltd: Strategic Outlook
Table 92 General Electric Company:Key Details, (CEO, HQ, Revenue, Founded, No. of Employees, Company Type, Website, Business Segment)
Table 93 General Electric Company: Product Benchmarking
Table 94 General Electric Company: Strategic Outlook
Table 95 Toshiba Corporation: Key Details, (CEO, HQ, Revenue, Founded, No. of Employees, Company Type, Website, Business Segment)
Table 96 Toshiba Corporation: Product Benchmarking
Table 97 Toshiba Corporation: Strategic Outlook
Table 98 Hitachi, Ltd:Key Details, (CEO, HQ, Revenue, Founded, No. of Employees, Company Type, Website, Business Segment)
Table 99 Hitachi, Ltd: Product Benchmarking
Table 100 Hitachi, Ltd: Strategic Outlook
Table 101 Robert Bosch GmbH:Key Details, (CEO, HQ, Revenue, Founded, No. of Employees, Company Type, Website, Business Segment)
Table 102 Robert Bosch GmbH: Product Benchmarking
Table 103 Robert Bosch GmbH: Strategic Outlook
Table 104 Rockwell Automation, Inc. :Key Details, (CEO, HQ, Revenue, Founded, No. of Employees, Company Type, Website, Business Segment)
Table 105 Rockwell Automation, Inc: Product Benchmarking
Table 106 Siemens AG :Key Details, (CEO, HQ, Revenue, Founded, No. of Employees, Company Type, Website, Business Segment)
Table 107 Siemens AG: Product Benchmarking
Table 108 ARC Systems, Inc.:Key Details, (CEO, HQ, Revenue, Founded, No. of Employees, Company Type, Website, Business Segment)
Table 109 ARC Systems, Inc.: Product Benchmarking
Table 110 ASMO Co. Ltd.:Key Details, (CEO, HQ, Revenue, Founded, No. of Employees, Company Type, Website, Business Segment)
Table 111 ASMO Co. Ltd.: Product Benchmarking
Table 112 Nidec Corporation: Key Details, (CEO, HQ, Revenue, Founded, No. of Employees, Company Type, Website, Business Segment)
Table 113 Nidec Corporation: Product Benchmarking
Table 114 Nidec Corporation: Strategic Outlook
Table 115 DENSO Corporation :Key Details, (CEO, HQ, Revenue, Founded, No. of Employees, Company Type, Website, Business Segment)
Table 116 DENSO Corporation: Product Benchmarking
Table 117 DENSO Corporation: Strategic Outlook
Table 118 Emerson Electric Co.:Key Details, (CEO, HQ, Revenue, Founded, No. of Employees, Company Type, Website, Business Segment)
Table 119 Emerson Electric Co: Product Benchmarking
Table 120 Maxon Motor AG:Key Details, (CEO, HQ, Revenue, Founded, No. of Employees, Company Type, Website, Business Segment)
Table 121 Maxon Motor AG: Product Benchmarking
Table 122 AMETEK, Inc.:Key Details, (CEO, HQ, Revenue, Founded, No. of Employees, Company Type, Website, Business Segment)
Table 123 AMETEK, Inc: Product Benchmarking
Table 124 AMETEK, Inc: Strategic Outlook
Table 125 Johnson Electric: Key Details, (CEO, HQ, Revenue, Founded, No. of Employees, Company Type, Website, Business Segment)
Table 126 Johnson Electric: Product Benchmarking
Table 127 Johnson Electric: Strategic Outlook
List of Figures
Figure 1 Electric Motors Market Segmentation
Figure 2 Electric Motors Market by Type: Market Attractiveness Index
Figure 3 Electric Motors Market by Power Output: Market Attractiveness Index
Figure 4 Electric Motors Market by Voltage: Market Attractiveness Index
Figure 5 Electric Motors Market by Power Rating: Market Attractiveness Index
Figure 6 Electric Motors Market by Application: Market Attractiveness Index
Figure 7 Electric Motors Market Attractiveness Index by Region
Figure 8 Electric Motors Market: Market Dynamics
Figure 1 Production of Crude Oil, Natural Gas Production & Petroleum Products
Figure 2 EV sales, cars, World, 2018-2022
Figure 1 Major Domestic Appliances Sales(in million US$)
Figure 2 Electric Motors Market: Porter’s Five Forces Analysis
Figure 3 Global Electric Motors Market Share Forecast by COVID, 2023-2033 (%)
Figure 4 Global Electric Motors Market by Region, 2023-2033 (US$ Bn, AGR (%)) (V-Shaped Recovery Scenario)
Figure 5 Global Electric Motors Market by Region, 2023-2033 (US$ Bn, AGR (%)) (U-Shaped Recovery Scenario)
Figure 6 Global Electric Motors Market by Region, 2023-2033 (US$ Bn, AGR (%)) (W-Shaped Recovery Scenario)
Figure 7 Global Electric Motors Market by Region, 2023-2033 (US$ Bn, AGR (%)) (L-Shaped Recovery Scenario)
Figure 8 Electric Motors Market: PEST Analysis
Figure 9 Electric Motors Market by Type: Market Attractiveness Index
Figure 10 Global Electric Motors Market by Type, 2023-2033 (US$ Bn, AGR (%))
Figure 11 Electric Motors Market Share Forecast by Type, 2023, 2028, 2033 (%)
Figure 12 AC motors Market by Region, 2023-2033 (US$ Bn, AGR (%))
Figure 13 AC motors Market Share Forecast by Region, 2023 & 2033 (%)
Figure 14 DC motors Market by Region, 2023-2033 (US$ Bn, AGR (%))
Figure 15 DC Motors Market Share Forecast by Region, 2023 & 2033 (%)
Figure 16 Electric Motors Market by Power Output: Market Attractiveness Index
Figure 17 Global Electric Motors Market by Power Output, 2023-2033 (US$ Bn, AGR (%))
Figure 18 Electric Motors Market Share Forecast by Power Output, 2023, 2028, 2033 (%)
Figure 19 Integral HP Output Market by Region, 2023-2033 (US$ Bn, AGR (%))
Figure 20 Integral HP Output Market Share Forecast by Region, 2023 & 2033 (%)
Figure 21 Fractional HP Output Market by Region, 2023-2033 (US$ Bn, AGR (%))
Figure 22 Fractional HP Output Market Share Forecast by Region, 2023 & 2033 (%)
Figure 23 Electric Motors Market by Voltage: Market Attractiveness Index
Figure 24 Global Electric Motors Market by Voltage, 2023-2033 (US$ Bn, AGR (%))
Figure 25 Electric Motors Market Share Forecast by Voltage, 2023, 2028, 2033 (%)
Figure 26 Low Voltage Motors Market by Region, 2023-2033 (US$ Bn, AGR (%))
Figure 27 Low Voltage Motors Market Share Forecast by Region, 2023 & 2033 (%)
Figure 28 Medium Voltage Motors Market by Region, 2023-2033 (US$ Bn, AGR (%))
Figure 29 Medium Voltage Motors Market Share Forecast by Region, 2023 & 2033 (%)
Figure 30 High Voltage Motors Market by Region, 2023-2033 (US$ Bn, AGR (%))
Figure 31 High Voltage Motors Market Share Forecast by Region, 2023 & 2033 (%)
Figure 32 Electric Motors Market by Power Rating: Market Attractiveness Index
Figure 33 Global Electric Motors Market by Power Rating, 2023-2033 (US$ Bn, AGR (%))
Figure 34 Electric Motors Market Share Forecast by Power Rating, 2023, 2028, 2033 (%)
Figure 35 <1 kW Motors Market by Region, 2023-2033 (US$ Bn, AGR (%))
Figure 36 500 kW Motors Market by Region, 2023-2033 (US$ Bn, AGR (%))
Figure 44 >500 kW Motors Market Share Forecast by Region, 2023 & 2033 (%)
Figure 45 Electric Motors Market by Application: Market Attractiveness Index
Figure 46 Global Electric Motors Market by Application, 2023-2033 (US$ Bn, AGR (%))
Figure 47 Electric Motors Market Share Forecast by Application, 2023, 2028, 2033 (%)
Figure 48 Industrial Machinery Market by Region, 2023-2033 (US$ Bn, AGR (%))
Figure 49 Industrial Machinery Market Share Forecast by Region, 2023 & 2033 (%)
Figure 50 Motor Vehicles Market by Region, 2023-2033 (US$ Bn, AGR (%))
Figure 51 Motor Vehicles Market Share Forecast by Region, 2023 & 2033 (%)
Figure 52 HVAC Equipment Market by Region, 2023-2033 (US$ Bn, AGR (%))
Figure 53 HVAC Equipment Market Share Forecast by Region, 2023 & 2033 (%)
Figure 54 Aerospace & Transportation Market by Region, 2023-2033 (US$ Bn, AGR (%))
Figure 55 Aerospace & Household Appliances Market Share Forecast by Region, 2023 & 2033 (%)
Figure 56 Household Appliances Market by Region, 2023-2033 (US$ Bn, AGR (%))
Figure 57 Household Appliances Market Share Forecast by Region, 2023 & 2033 (%)
Figure 58 Other Application Market by Region, 2023-2033 (US$ Bn, AGR (%))
Figure 59 Others Market Share Forecast by Region, 2023 & 2033 (%)
Figure 60 Electric Motors Market Forecast by Region 2023 and 2033 (Revenue, CAGR%)
Figure 61 Electric Motors Market Share Forecast by Region 2023, 2028, 2033 (%)
Figure 62 Electric Motors Market by Region, 2023-2033 (US$ Billion, AGR %)
Figure 63 North America Electric Motors Market Attractiveness Index
Figure 64 North America Electric Motors Market by Region, 2023, 2028 & 2033 (US$ Billion)
Figure 65 North America Electric Motors Market by Value, 2023-2033 (US$ Bn, AGR (%))
Figure 66 North America Electric Motors Market by Country, 2023-2033 (US$ Bn, AGR (%))
Figure 67 North America Electric Motors Market Share Forecast by Country, 2023 & 2033 (%)
Figure 68 North America Electric Motors Market by Type, 2023-2033 (US$ Bn, AGR (%))
Figure 69 North America Electric Motors Market Share Forecast Type, 2023 & 2033 (%)
Figure 70 North America Electric Motors Market by Power Output, 2023-2033 (US$ Bn, AGR (%))
Figure 71 North America Electric Motors Market Share Forecast by Power Output, 2023 & 2033 (%)
Figure 72 North America Electric Motors Market by Voltage, 2023-2033 (US$ Bn, AGR (%))
Figure 73 North America Electric Motors Market Share Forecast by Voltage, 2023 & 2033 (%)
Figure 74 North America Electric Motors Market by Power Rating, 2023-2033 (US$ Bn, AGR (%))
Figure 75 North America Electric Motors Market Share Forecast by Power Rating, 2023 & 2033 (%)
Figure 76 North America Electric Motors Market by Application, 2023-2033 (US$ Bn, AGR (%))
Figure 77 North America Electric Motors Market Share Forecast by Application, 2023 & 2033 (%)
Figure 78 US Electric Motors Market by Value, 2023-2033 (US$ Bn, AGR (%))
Figure 79 Canada Electric Motors Market by Value, 2023-2033 (US$ Bn, AGR (%))
Figure 80 Europe Electric Motors Market Attractiveness Index
Figure 81 Europe Electric Motors Market by Region, 2023, 2028 & 2033 (US$ Billion)
Figure 82 Europe Electric Motors Market by Value, 2023-2033 (US$ Bn, AGR (%))
Figure 83 Europe Electric Motors Market by Country, 2023-2033 (US$ Bn, AGR (%))
Figure 84 Europe Electric Motors Market Share Forecast by Country, 2023 & 2033 (%)
Figure 85 Europe Electric Motors Market by Type, 2023-2033 (US$ Bn, AGR (%))
Figure 86 Europe Electric Motors Market Share Forecast Type, 2023 & 2033 (%)
Figure 87 Europe Electric Motors Market by Power Output, 2023-2033 (US$ Bn, AGR (%))
Figure 88 Europe Electric Motors Market Share Forecast by Power Output, 2023 & 2033 (%)
Figure 89 Europe Electric Motors Market by Voltage, 2023-2033 (US$ Bn, AGR (%))
Figure 90 Europe Electric Motors Market Share Forecast by Voltage, 2023 & 2033 (%)
Figure 91 Europe Electric Motors Market by Power Rating, 2023-2033 (US$ Bn, AGR (%))
Figure 92 Europe Electric Motors Market Share Forecast by Power Rating, 2023 & 2033 (%)
Figure 93 Europe Electric Motors Market by Application, 2023-2033 (US$ Bn, AGR (%))
Figure 94 Europe Electric Motors Market Share Forecast by Application, 2023 & 2033 (%)
Figure 95 Germany Electric Motors Market by Value, 2023-2033 (US$ Bn, AGR (%))
Figure 96 Italy Electric Motors Market by Value, 2023-2033 (US$ Bn, AGR (%))
Figure 97 France Electric Motors Market by Value, 2023-2033 (US$ Bn, AGR (%))
Figure 98 Hungary Electric Motors Market by Value, 2023-2033 (US$ Bn, AGR (%))
Figure 99 Switzerland Electric Motors Market by Value, 2023-2033 (US$ Bn, AGR (%))
Figure 100 Rest of Europe Electric Motors Market by Value, 2023-2033 (US$ Bn, AGR (%))
Figure 101 Asia-Pacific Electric Motors Market Attractiveness Index
Figure 102 Asia-Pacific Electric Motors Market by Region, 2023, 2028 & 2033 (US$ Billion)
Figure 103 Asia-Pacific Electric Motors Market by Value, 2023-2033 (US$ Bn, AGR (%))
Figure 104 Asia-Pacific Electric Motors Market by Country, 2023-2033 (US$ Bn, AGR (%))
Figure 105 Asia-Pacific Electric Motors Market Share Forecast by Country, 2023 & 2033 (%)
Figure 106 Asia-Pacific Electric Motors Market by Type, 2023-2033 (US$ Bn, AGR (%))
Figure 107 Asia-Pacific Electric Motors Market Share Forecast Type, 2023 & 2033 (%)
Figure 108 Asia-Pacific Electric Motors Market by Power Output, 2023-2033 (US$ Bn, AGR (%))
Figure 109 Asia-Pacific Electric Motors Market Share Forecast by Power Output, 2023 & 2033 (%)
Figure 110 Asia-Pacific Electric Motors Market by Voltage, 2023-2033 (US$ Bn, AGR (%))
Figure 111 Asia-Pacific Electric Motors Market Share Forecast by Voltage, 2023 & 2033 (%)
Figure 112 Asia-Pacific Electric Motors Market by Power Rating, 2023-2033 (US$ Bn, AGR (%))
Figure 113 Asia-Pacific Electric Motors Market Share Forecast by Power Rating, 2023 & 2033 (%)
Figure 114 Asia-Pacific Electric Motors Market by Application, 2023-2033 (US$ Bn, AGR (%))
Figure 115 Asia-Pacific Electric Motors Market Share Forecast by Application, 2023 & 2033 (%)
Figure 116 China Electric Motors Market by Value, 2023-2033 (US$ Bn, AGR (%))
Figure 117 India Electric Motors Market by Value, 2023-2033 (US$ Bn, AGR (%))
Figure 118 Japan Electric Motors Market by Value, 2023-2033 (US$ Bn, AGR (%))
Figure 119 South Korea Electric Motors Market by Value, 2023-2033 (US$ Bn, AGR (%))
Figure 120 Vietnam Electric Motors Market by Value, 2023-2033 (US$ Bn, AGR (%))
Figure 121 Rest of Asia-Pacific Electric Motors Market by Value, 2023-2033 (US$ Bn, AGR (%))
Figure 122 Middle East and Africa Electric Motors Market Attractiveness Index
Figure 123 Middle East and Africa Electric Motors Market by Region, 2023, 2028 & 2033 (US$ Billion)
Figure 124 Middle East & Africa Electric Motors Market by Value, 2023-2033 (US$ Bn, AGR (%))
Figure 125 Middle East & Africa Electric Motors Market by Country, 2023-2033 (US$ Bn, AGR (%))
Figure 126 Middle East and Africa Electric Motors Market Share Forecast by Country, 2023 & 2033 (%)
Figure 127 Middle East & Africa Electric Motors Market by Type, 2023-2033 (US$ Bn, AGR (%))
Figure 128 Middle East and Africa Electric Motors Market Share Forecast Type, 2023 & 2033 (%)
Figure 129 Middle East & Africa Electric Motors Market by Power Output, 2023-2033 (US$ Bn, AGR (%))
Figure 130 Middle East and Africa Electric Motors Market Share Forecast by Power Output, 2023 & 2033 (%)
Figure 131 Middle East & Africa Electric Motors Market by Voltage, 2023-2033 (US$ Bn, AGR (%))
Figure 132 Middle East and Africa Electric Motors Market Share Forecast by Voltage, 2023 & 2033 (%)
Figure 133 Middle East & Africa Electric Motors Market by Power Rating, 2023-2033 (US$ Bn, AGR (%))
Figure 134 Middle East and Africa Electric Motors Market Share Forecast by Power Rating, 2023 & 2033 (%)
Figure 135 Middle East & Africa Electric Motors Market by Application, 2023-2033 (US$ Bn, AGR (%))
Figure 136 Middle East and Africa Electric Motors Market Share Forecast by Application, 2023 & 2033 (%)
Figure 137 GCC Electric Motors Market by Value, 2023-2033 (US$ Bn, AGR (%))
Figure 138 South Africa Electric Motors Market by Value, 2023-2033 (US$ Bn, AGR (%))
Figure 139 Rest of Middle East & Africa Electric Motors Market by Value, 2023-2033 (US$ Bn, AGR (%))
Figure 140 Latin America Electric Motors Market Attractiveness Index
Figure 141 Latin America Electric Motors Market by Region, 2023, 2028 & 2033 (US$ Billion)
Figure 142 Latin America Electric Motors Market by Value, 2023-2033 (US$ Bn, AGR (%))
Figure 143 Latin America Electric Motors Market by Country, 2023-2033 (US$ Bn, AGR (%))
Figure 144 Latin America Electric Motors Market Share Forecast by Country, 2023 & 2033 (%)
Figure 145 Latin America Electric Motors Market by Type, 2023-2033 (US$ Bn, AGR (%))
Figure 146 Latin America Electric Motors Market Share Forecast Type, 2023 & 2033 (%)
Figure 147 Latin America Electric Motors Market by Power Output, 2023-2033 (US$ Bn, AGR (%))
Figure 148 Latin America Electric Motors Market Share Forecast by Power Output, 2023 & 2033 (%)
Figure 149 Latin America Electric Motors Market by Voltage, 2023-2033 (US$ Bn, AGR (%))
Figure 150 Latin America Electric Motors Market Share Forecast by Voltage, 2023 & 2033 (%)
Figure 151 Latin America Electric Motors Market by Power Rating, 2023-2033 (US$ Bn, AGR (%))
Figure 152 Latin America Electric Motors Market Share Forecast by Power Rating, 2023 & 2033 (%)
Figure 153 Latin America Electric Motors Market by Application, 2023-2033 (US$ Bn, AGR (%))
Figure 154 Latin America Electric Motors Market Share Forecast by Application, 2023 & 2033 (%)
Figure 155 Brazil Electric Motors Market by Value, 2023-2033 (US$ Bn, AGR (%))
Figure 156 Mexico Electric Motors Market by Value, 2023-2033 (US$ Bn, AGR (%))
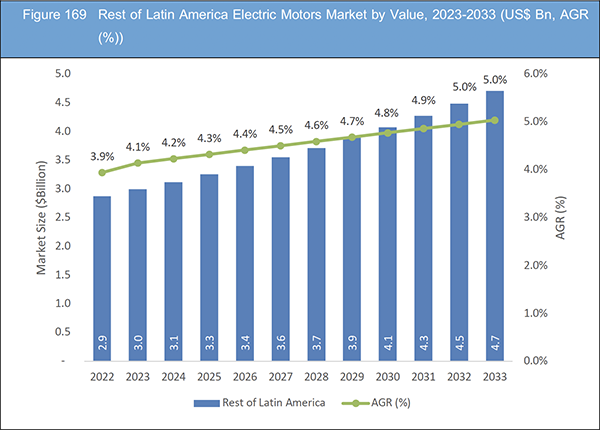
Figure 157 Rest of Latin America Electric Motors Market by Value, 2023-2033 (US$ Bn, AGR (%))
Figure 158 Electric Motors Market: Company Share, 2022
Figure 159 ABB Ltd.: Net Revenue, 2018-2022 (US$ Billion, AGR%)
Figure 160 ABB Ltd.: R&D, 2018-2022 (US$ Billion, AGR%)
Figure 161 ABB Ltd.: Business Segment Revenue Share, 2022 (%)
Figure 162 General Electric Company.: Net Revenue, 2018-2022 (US$ Billion, AGR%)
Figure 163 General Electric Company.: R&D, 2018-2022 (US$ Billion, AGR%)
Figure 164 General Electric Company.: Regional Revenue Share, 2022 (%)
Figure 165 General Electric Company.: Business Segment Revenue Share, 2022 (%)
Figure 166 Toshiba Corporation.: Net Revenue, 2018-2022 (US$ Billion, AGR%)
Figure 167 Toshiba Corporation.: R&D, 2018-2022 (US$ Billion, AGR%)
Figure 168 Toshiba Corporation.: Regional Revenue Share, 2022 (%)
Figure 169 Toshiba Corporation.: Business Segment Revenue Share, 2022 (%)
Figure 170 Hitachi, Ltd.: Net Revenue, 2018-2022 (US$ Billion, AGR%)
Figure 171 Hitachi, Ltd.: Regional Revenue Share, 2022 (%)
Figure 172 Hitachi, Ltd.: Business Segment Revenue Share, 2022 (%)
Figure 173 Rockwell Automation, Inc.: Net Revenue, 2018-2022 (US$ Billion, AGR%)
Figure 174 Rockwell Automation, Inc.: R&D, 2018-2022 (US$ Billion, AGR%)
Figure 175 Rockwell Automation, Inc.: Regional Revenue Share, 2022 (%)
Figure 176 Rockwell Automation, Inc.: Business Segment Revenue Share, 2022 (%)
Figure 177 Siemens AG.: Net Revenue, 2018-2022 (US$ Billion, AGR%)
Figure 178 Siemens AG.: R&D, 2018-2022 (US$ Billion, AGR%)
Figure 179 Siemens AG.: Regional Revenue Share, 2022 (%)
Figure 180 Siemens AG.: Business Segment Revenue Share, 2022 (%)
Figure 181 Nidec Corporation.: Net Revenue, 2018-2022 (US$ Billion, AGR%)
Figure 182 Nidec Corporation.: R&D, 2018-2022 (US$ Billion, AGR%)
Figure 183 Nidec Corporation.: Regional Revenue Share, 2022 (%)
Figure 184 Nidec Corporation.: Business Segment Revenue Share, 2022 (%)
Figure 185 DENSO Corporation.: Net Revenue, 2018-2022 (US$ Billion, AGR%)
Figure 186 Emerson Electric Co.: Net Revenue, 2018-2022 (US$ Billion, AGR%)
Figure 187 Emerson Electric Co.: R&D, 2018-2022 (US$ Billion, AGR%)
Figure 188 Emerson Electric Co.: Regional Revenue Share, 2022 (%)
Figure 189 Emerson Electric Co.: Business Segment Revenue Share, 2022 (%)
Figure 190 AMETEK, Inc..: Net Revenue, 2018-2022 (US$ Billion, AGR%)
Figure 191 AMETEK, Inc.: R&D, 2018-2022 (US$ Billion, AGR%)
Figure 192 AMETEK, Inc.: Regional Revenue Share, 2022 (%)
Figure 193 AMETEK, Inc.: Business Segment Revenue Share, 2022 (%)
Figure 194 Johnson Electric.: Net Revenue, 2018-2022 (US$ Billion, AGR%)
Figure 195 Johnson Electric.: Regional Revenue Share, 2022 (%)
Figure 196 Johnson Electric.: Business Segment Revenue Share, 2022 (%)
List of Companies Profiled in the report
ABB Ltd
AMETEK, Inc.
ARC Systems, Inc.
ASMO Co. Ltd.
DENSO Corporation
Emerson Electric Co.
General Electric Company
Hitachi, Ltd
Johnson Electric
Maxon Motor AG
Nidec Corporation
Robert Bosch GmbH
Rockwell Automation, Inc.
Siemens AG
Toshiba Corporation
List of Other Companies Mentioned in the report
Audi
Aura Aero
BorgWarner
Bosch
BrightDrop
Ceer
Collins Aerospace
Daikin
Dat Bike
Embraer
Euro Group
Fisker Inc
GAC New Energy Automobile
Gemera
GM
Great Wall Motor (GWM)
Haier India
HAPSMobile Inc
Hitachi
Hyundai Motors
Kia Motors
Kirloskar Motors
Kirloskar Oil Engines Limited (KOEL)
Koenigsegg
Leaos
LG
Mahle
Mazda
Mercedes-Benz
MG Motor India
NEMA motor
Nidec Corporation
Nidec Motor Corporation
Nidec's
Nidec-Shimpo Corporation
Novelic
Peugeot
QuietKat
Safran Electrical & Power
Samsung Electronics
Schneider Electric
Siemens Limited
SoftBank Corp
Sona Comstar
Stellantis N.V.
TAG
Toshiba
U.S. MOTORS® brand
Volkswagen Group
VoltAero
List of Associations Mentioned in the Report
Advanced driver assistance systems (ADAS)
Bureau of Indian Standards (BIS)
Consumer Electronics and Appliances Manufacturers Association (CEAMA)
Control Panel and Switchgear Manufacturers Association
Electric Lamp and Component Manufacturers Association of India (ELCOMA)
GCC (Gulf Cooperation Council)
High Altitude Platform Stations (HAPS)
India Electronics and Semiconductor Association
Indian Tranformers Manufacturers Association
International Electrotechnical Commission (IEC)
MIT
National Accreditation Board for Testing and Calibration Laboratories (NABL)
National Renewable Energy Laboratory (NREL)
Petroleum & Explosives Safety Organization (PESO)
The National Renewable Energy Laboratory (NREL)
The Superior Continuous Torque (SCT)
Urban Air Mobility (UAM)