This latest report by business intelligence provider visiongain assesses that digital oilfield spending will reach $22bn in 2019. Operational technology like the use of supervisory control and data acquisition system (SCADA), OPC servers, field devices and distributed control systems aid companies in efficiency measures. This technology is needed now more than ever as companies seek to provide the maximum amount of oil while maintaining the lowest price possible, in order to meet the continuously growing global demand. It is therefore critical that you have your timescales correct and your forecasting plans ready. This report will ensure that you do. Visiongain’s report will ensure that you keep informed and ahead of your competitors. Gain that competitive advantage.
The Digital Oilfield Market Forecast 2019-2029 responds to your need for definitive market data:
Read on to discover how you can exploit the future business opportunities emerging in this sector. Visiongain’s new study tells you and tells you NOW.
In this brand new report, you find 150+ in-depth tables, charts and graphs all unavailable elsewhere.
The 155-page report provides clear, detailed insight into the global Digital Oilfield market. Discover the key drivers and challenges affecting the market.
By ordering and reading our brand new report today, you stay better informed and ready to act.
5 Reasons why you must order and read this report today:
1) Profiles of 10 leading companies operating within the Digital Oilfield Market
• Schlumberger
• Weatherford
• Baker Hughes
• Halliburton
• National Oilwell Varco
• Siemens
• Honeywell
• Rockwell
• ABB
• Emerson
2) 150+ tables & charts illustrating global, regional and digital oilfield submarket forecasts and analysis from 2019-2029
3) Regional forecasts from 2019-2029
North America
• U.S. Market 2019-2029
• Canada Market 2019-2029
• Mexico Market 2019-2029
Asia-Pacific
• China Market 2019-2029
• India Market 2019-2029
• Rest of APAC Market 2019-2029
Europe
• Russia Market 2019-2029
• Norway Market 2019-2029
• Rest of Europe Market 2019-2029
Middle East and Africa
• Saudi Arabia Market 2019-2029
• Iran Market 2019-2029
• Iraq Market 2019-2029
• UAE Market 2019-2029
• Kuwait Market 2019-2029
• Nigeria Market 2019-2029
• Qatar Market 2019-2029
• Rest of MEA Market 2019-2029
Latin America
• Brazil Market 2019-2029
• Venezuela Market 2019-2029
• Rest of Latin America Market 2019-2029
4) Forecasts by Digital Oilfield component from 2019-2029
• Hardware
• Software
• Services
5) Forecasts by Process in Digital Oilfield Market from 2019-2029
• Production optimization
• Drilling optimization
• Reservoir Optimization
• Others
How will you benefit from this report?
• Keep your knowledge base up to speed. Don’t get left behind
• Reinforce your strategic decision-making with definitive and reliable market data
• Learn how to exploit new technological trends
• Realise your company’s full potential within the market
• Understand the competitive landscape and identify potential new business opportunities & partnerships
Who should read this report?
• Anyone with involvement in the digital oilfield market
• Oil & gas operators
• Engineering contractors
• Natural gas traders
• Commodity traders
• Investment managers
• Arbitrage companies and divisions
• Energy price reporting companies
• Energy company managers
• Energy consultants
• Oil and gas company executives and analysts
• Heads of strategic development
• Business development managers
• Marketing managers
• Market analysts,
• Technologists
• Suppliers
• Investors
• Banks
• Government agencies
Visiongain’s study is intended for anyone requiring commercial analyses for thedigital oilfield market and leading companies. You find data, trends and predictions.
Buy our report today the Digital Oilfield Optimisation Market Forecast 2019-2029: Forecasts by Process (Production Optimization, Drilling Optimization, Reservoir Optimization, and Others), by Component (Hardware, Software, Services), and Geography (North America, Europe, Asia-Pacific, Middle East and Africa, and Latin America) Plus Analysis of Leading Digital Oilfield Companies. Avoid missing out by staying informed – get our report now.
Visiongain is a trading partner with the US Federal Government
CCR Ref number: KD4R6
Do you have any custom requirements we can help you with? Any need for specific country, geo region, market segment or specific company information? Contact us today, we can discuss your needs and see how we can help: sara.peerun@visiongain.com
1. Report Overview
1.1 Global Digital Oilfield Market Overview
1.2 Why You Should Read This Report
1.3 How This Report Delivers
1.4 Key Questions Answered by This Analytical Report Include:
1.5 Who is This Report For?
1.6 Methodology
1.6.1 Primary Research
1.6.2 Secondary Research
1.6.3 Market Evaluation& Forecasting Methodology
1.7 Frequently Asked Questions (FAQ).
1.8 Associated Visiongain Reports.
1.9 About Visiongain
2. Introduction to Digital Oilfield Market
2.1 Digital Oilfield Market Definition
2.2 Digital Oilfield Market Structure
2.3 Evolution of Digital Oilfield.
2.4 Advantages of the Digital Oilfield.
2.5 Digital Oilfield Connect Upstream, Midstream and Downstream Operations
2.6 Problems Associated With the Adaption of Digital Oilfield
2.7 Overview of Digital Oilfield by Process
2.7.1 Overview of Digital Oilfield by Production Optimisation Process
2.7.2 Overview of Digital Oilfield by Drilling Optimisation Process
2.7.4 Overview of Digital Oilfield by Others Process
2.8 Overview of Digital Oilfield by Components
2.8.1 Overview of Digital Oilfield by Hardware
2.8.2 Overview of Digital Oilfield by Software
2.8.3 Overview of Digital Oilfield by Services
3. Global Digital Oilfield Market 2019-2029
3.1 Global Digital Oilfield Market Forecast 2019-2029
3.2 Global Digital Oilfield Market Drivers & Restraints 2019
3.2.1 Global Digital Oilfields Market Drivers 2019
3.2.2 Global Digital Oilfield Market Restraints 2019
4. Global Digital Oilfield Process Forecast 2019-2029
4.1 Digital Oilfield Production Optimisation Forecast by Regional 2019-2029
4.2 Digital Oilfield Drilling Optimisation Forecast by Regional 2019-2029
4.3 Digital Oilfield Reservoir Optimisation Forecast by Regional 2019-2029
4.4 Digital Oilfield Others Forecast by Regional 2019-2029
5. Global Digital Oilfield Component Forecast 2019-2029
5.1 Digital Oilfield Hardware Forecast by Regional 2019-2029
5.1.1 Digital Oilfield Hardware Forecast by Process 2019-2029
5.2 Digital Oilfield Software Forecast by Regional 2019-2029
5.2.1 Digital Oilfield Software Forecast by Process 2019-2029
5.3 Digital Oilfield Services Forecast by Regional 2019-2029
5.3.1 Digital Oilfield Services Forecast by Process 2019-2029
6. Regional Digital Oilfield Market Forecast 2019-2029
6.1 North America Digital Oilfield Market Forecast 2019-2029
6.1.1 North America Digital Oilfield Market by Process Forecast 2019-2029
6.1.2 North America Digital Oilfield Market by Components Forecast 2019-2029
6.1.3 North America Digital Oilfield Market by Country Forecast 2019-2029
6.2 Europe Digital Oilfield Market Forecast 2019-2029
6.2.1 Europe Digital Oilfield Market by Process Forecast 2019-2029
6.2.2 Europe Digital Oilfield Market by Components Forecast 2019-2029
6.2.3 Europe Digital Oilfield Market by Country Forecast 2019-2029
6.3 Asia-Pacific Digital Oilfield Market Forecast 2019-2029
6.3.1 Asia-Pacific Digital Oilfield Market by Process Forecast 2019-2029
6.3.2 Asia-Pacific Digital Oilfield Market by Components Forecast 2019-2029
6.3.3 Asia-Pacific Digital Oilfield Market by Country Forecast 2019-2029
6.4 The Middle East and Africa Digital Oilfield Market Forecast 2019-2029
6.4.1 The Middle East and Africa Digital Oilfield Market by Process Forecast 2019-2029
6.4.2 The Middle East and Africa Digital Oilfield Market by Components Forecast 2019-2029
6.4.3 Middle East and Africa Digital Oilfield Market by Country Forecast 2019-2029
6.5 Latin America Digital Oilfield Market Forecast 2019-2029
6.5.1 Latin America Digital Oilfield Market by Process Forecast 2019-2029
6.5. 2 Latin America Digital Oilfield Market by Components Forecast 2019-2029
6.5.3 Latin America Digital Oilfield Market by Country Forecast 2019-2029
7. Leading Companies in Digital Oilfield Market
7.1 Schlumberger (US)
7.1.1Schlumberger Introduction
7.1.2 Schlumberger Total Company Sales/ Profits and Expenditure 2013-2018
7.1.3 Schlumberger Strategic Alliances
7.1.5 Digital Oilfield Experience of Schlumberger
7.2 Weatherford
7.2.1 Weatherford Introduction
7.2.2 Weatherford Total Company Sales/ Profits and Expenditure 2013-2018
7.2.3 Weatherford Strategic Alliances
7.3 Baker Hughes, a GE company (BHGE):
7.3.1 Baker Hughes Introduction
7.3.2 Baker Hughes Total Company Sales/ Profits and Expenditure 2013-2018
7.3.3 Baker Hughes Strategic Alliances
7.3.4 Digital Oilfield Experience of Baker Hughes
7.4 Halliburton
7.4.1 Halliburton Introduction
7.4.2 Halliburton Total Company Sales/ Profits and Expenditure 2013-2018
7.4.3 Halliburton Strategic Alliances
7.4.6 Digital Oilfield Experience of Halliburton
7.5 National Oilwell Varco
7.5.1 National Oilwell Varco Introduction
7.5.2 National Oilwell Varco Total Company Sales/ Income and Expenditure 2013-2018
7.5.3 National Oilwell Varco Strategic Alliances
7.5.4 Digital Oilfield Experience of National Oilwell Varco
7.6 Siemens
7.6.1 Siemens Introduction
7.6.2 Siemens Total Company Sales and Incomes 2013-2018
7.6.3 Siemens Strategic Alliances
7.6.4 Digital Oilfield Experience of Siemens
7.7 Honeywell
7.7.1 Honeywell Introduction
7.7.2 Honeywell Total Company Sales/ Income and Expenditure 2013-2018
7.7.3 Honeywell Strategic Alliances
7.7.5 Digital Oilfield Experience of Honeywell
7.8 Rockwell
7.8.1 Rockwell Introduction
7.8.2 Rockwell Total Company Sales/Income and Expenditure 2013-2018
7.8.3 Rockwell Strategic Alliances
7.8.4 Digital Oilfield Experience of Rockwell
7.9 ABB
7.9.1 ABB Introduction
7.9.2 ABB Total Company Sales/ Income and Expenditure 2013-2018
7.9.3 ABB Strategic Alliances
7.9.6 Digital Oilfield Experience of ABB
7.10 Emerson
7.10.1 Emerson Introduction
7.10.2 Emerson Total Company Sales/ Income and Expenditure 2013-2018
7.10.3 Emerson Strategic Alliances
7.10.4 Digital Oilfield Experience of Emerson
7.11 Other Companies in the Digital Oilfield Market
8. Conclusions and Recommendations
8.1 Key Findings
8.2 Recommendations
9. Glossary
Associated Visiongain Reports
Visiongain Report Sales Order Form
Appendix A
Appendix B
Visiongain report evaluation form
List of Tables
Table 3.1 Global Digital Oilfield Market Forecast 2019-2029 (US$m, AGR %, CAGR %, Cumulative)
Table 3.2 Global Digital Oilfield Market Drivers & Restraints 2019
Table 4.1 Global Digital Oilfield Market By Process Forecast 2019-2029 (US$mn, AGR %, Cumulative)
Table 4.2 Global Digital Oilfield Production Optimization by Regional Market Forecast 2019-2029 (US$m, AGR %, CAGR %, Cumulative)
Table 4.3 Global Digital Oilfield Drilling Optimization by Regional Market Forecast 2019-2029 (US$m, AGR %, CAGR %, Cumulative)
Table 4.4 Global Digital Oilfield Reservoir Optimization by Regional Market Forecast 2019-2029 (US$m, AGR %, CAGR %, Cumulative)
Table 4.5 Global Digital Oilfield Others by Regional Market Forecast 2019-2029 (US$m, AGR %, CAGR %, Cumulative)
Table 5.1 Global Digital Oilfield Market By Component Forecast 2019-2029 (US$mn, AGR %, Cumulative)
Table 5.2 Global Digital Oilfield Hardware by Regional Market Forecast 2019-2029 (US$m, AGR %, CAGR %, Cumulative)
Table 5.3 Global Digital Oilfield Hardware by Process Market Forecast 2019-2029 (US$m, AGR %, CAGR %, Cumulative)
Table 5.4 Global Digital Oilfield Software by Regional Market Forecast 2019-2029 (US$m, AGR %, CAGR %, Cumulative)
Table 5.5 Global Digital Oilfield Software by Process Market Forecast 2019-2029 (US$m, AGR %, CAGR %, Cumulative)
Table 5.6 Global Digital Oilfield Services by Regional Market Forecast 2019-2029 (US$m, AGR %, CAGR %, Cumulative)
Table 5.7 Global Digital Oilfield Services by Process Market Forecast 2019-2029 (US$m, AGR %, CAGR %, Cumulative)
Table 6.1 Regional Digital Oilfield Market Forecast 2019-2029 (US$m, AGR %, CAGR %, Cumulative)
Table 6.2 North America Digital Oilfield Market Forecast 2019-2029 (US$mn, AGR %, CAGR %, Cumulative)
Table 6.3 North America Digital Oilfield Market By Process Forecast 2019-2029 (US$mn, AGR %, Cumulative)
Table 6.4 North America Digital Oilfield Market By Component Forecast 2019-2029 (US$mn, AGR %, Cumulative)
Table 6.5 North America Digital Oilfield Market By Country Forecast 2019-2029 (US$mn, AGR %, Cumulative)
Table 6.6 Europe Digital Oilfield Market Forecast 2019-2029 (US$mn, AGR %, CAGR %, Cumulative)
Table 6.7 Europe Digital Oilfield Market By Process Forecast 2019-2029 (US$mn, AGR %, Cumulative)
Table 6.8 Europe Digital Oilfield Market By Component Forecast 2019-2029 (US$mn, AGR %, Cumulative)
Table 6.9 Europe Digital Oilfield Market By Country Forecast 2019-2029 (US$mn, AGR %, Cumulative)
Table 6.10 Asia-Pacific Digital Oilfield Market Forecast 2019-2029 (US$mn, AGR %, CAGR %, Cumulative)
Table 6.11 Asia-Pacific Digital Oilfield Market By Process Forecast 2019-2029 (US$mn, AGR %, Cumulative)
Table 6.12 Asia Pacific Digital Oilfield Market By Component Forecast 2019-2029 (US$mn, AGR %, Cumulative)
Table 6.13 Asia-Pacific Digital Oilfield Market By Country Forecast 2019-2029 (US$mn, AGR %, Cumulative)
Table 6.14 Middle East and Africa Digital Oilfield Market Forecast 2019-2029 (US$mn, AGR %, CAGR %, Cumulative)
Table 6.15 Middle East and Africa Digital Oilfield Market By Process Forecast 2019-2029 (US$mn, AGR %, Cumulative)
Table 6.16 Middle East and Africa Digital Oilfield Market By Component Forecast 2019-2029 (US$mn, AGR %, Cumulative)
Table 6.17 Middle East and Africa Digital Oilfield Market By Country Forecast 2019-2029 (US$mn, AGR %, Cumulative)
Table 6.18 Latin America Digital Oilfield Market Forecast 2019-2029 (US$mn, AGR %, CAGR %, Cumulative)
Table 6.19 Latin America Digital Oilfield Market By Process Forecast 2019-2029 (US$mn, AGR %, Cumulative)
Table 6.20 Latin America Digital Oilfield Market By Component Forecast 2019-2029 (US$mn, AGR %, Cumulative)
Table 6.21 Latin America Digital Oilfield Market By Country Forecast 2019-2029 (US$mn, AGR %, Cumulative)
Table 7.1 Schlumberger 2018 (CEO, Strongest Business Region, Total Revenue $m, HQ, Founded, No. of Employees, IR Contact, Ticker, Website)
Table 7.2 Schlumberger Total Company Sales 2013-2018 (US$m, AGR %)
Table 7.3 Schlumberger Total Company Net Income/ Loss 2013-2018 (US$m, AGR %)
Table 7.4 Schlumberger Total Company Capital Expenditure 2013-2018 (US$m, AGR %)
Table 7.5 Schlumberger Strategic Alliances
Table 7.6 Weatherford: 2018 (CEO, Strongest Business Region, Total Revenue $m, HQ, Founded, No. of Employees, IR Contact, Ticker, Website)
Table 7.7 Weatherford Total Company Sales 2013-2018 (US$m, AGR %)
Table 7.8 Weatherford Total Company Net Income / Loss 2013-2018 (US$m, AGR %)
Table 7.9 Weatherford Total Company Capital Expenditure 2013-2018 (US$m, AGR %)
Table 7.10 Weatherford Strategic Alliances
Table 7.11 BHGE: 2018 (CEO, Strongest Business Region, Total Revenue $m, HQ, Founded, No. of Employees, IR Contact, Ticker, Website)
Table 7.12 Baker Hughes Total Company Sales 2013-2018 (US$m, AGR %)
Table 7.13 Baker Hughes Total Company Net Income 2013-2018 (US$m, AGR %)
Table 7.14 Baker Hughes Total Company Capital Expenditure 2013-2018 (US$m, AGR %)
Table 7.15 Baker Hughes Strategic Alliances
Table 7.16 Halliburton: 2018 (CEO, Strongest Business Region, Total Revenue $m, HQ, Founded, No. of Employees, IR Contact, Ticker, Website)
Table 7.17 Halliburton Total Company Sales 2013-2018 (US$m, AGR %)
Table 7.18 Halliburton Total Company Net Income / Loss 2013-2018 (US$m, AGR %)
Table 7.19 Halliburton Total Company Capital Expenditure 2013-2018 (US$m, AGR %)
Table 7.20 Halliburton Strategic Alliances
Table 7.21 National Oilwell Varco: 2018 (CEO, Strongest Business Region, Total Revenue $m, HQ, Founded, No. of Employees, IR Contact, Ticker, Website)
Table 7.22 National Oilwell Varco Total Company Sales 2013-2018 (US$m, AGR %)
Table 7.23 National Oilwell Varco Total Company Net Income / Loss 2013-2018 (US$m, AGR %)
Table 7.24 National Oilwell Varco Total Company Capital Expenditure 2013-2018 (US$m, AGR %)
Table 7.25 National Oilwell Verco Strategic Alliances
Table 7.26 Siemens 2018 (CEO, Strongest Business Region, Total Revenue $m, HQ, Founded, No. of Employees, IR Contact, Ticker, Website)
Table 7.27 Siemens Total Company Sales 2013-2018 (US$m, AGR %)
Table 7.28 Siemens Total Company Net Income 2013-2018 (US$m, AGR %)
Table 7.29 Siemens Strategic Alliances
Table 7.30 Honeywell 2018 (CEO, Strongest Business Region, Total Revenue $m, HQ, Founded, No. of Employees, IR Contact, Ticker, Website)
Table 7.31 Honeywell Total Company Sales 2013-2018 (US$m, AGR %)
Table 7.32 Honeywell Total Company Net Income / Loss 2013-2018 (US$m, AGR %)
Table 7.33 Honeywell Total Company Capital Expenditure 2013-2018 (US$m, AGR %)
Table 7.34 Honeywell Strategic Alliances
Table 7.35 Rockwell 2018 (CEO, Strongest Business Region, Total Revenue $m, HQ, Founded, No. of Employees, IR Contact, Ticker, Website)
Table 7.36 Rockwell Total Company Sales 2013-2018 (US$m, AGR %)
Table 7.37 Rockwell Total Company Net Income / Loss 2013-2018 (US$m, AGR %)
Table 7.38 Rockwell Total Company Capital Expenditure 2013-2018 (US$m, AGR %)
Table 7.39 Rockwell Strategic Alliances
Table 7.40 ABB 2018 (CEO, Strongest Business Region, Total Revenue $m, HQ, Founded, No. of Employees, IR Contact, Ticker, Website)
Table 7.41 ABB Total Company Sales 2013-2018(US$m, AGR %)
Table 7.42 ABB Total Company Net Income / Loss 2013-2018 (US$m, AGR %)
Table 7.43 ABB Total Company Capital Expenditure 2013-2018 (US$m, AGR %)
Table 7.44 ABB Strategic Alliances
Table 7.45 Emerson 2018 (CEO, Strongest Business Region, Total Revenue $m, HQ, Founded, No. of Employees, IR Contact, Ticker, Website)
Table 7.46 Emerson Total Company Sales 2013-2018 (US$m, AGR %)
Table 7.47 Emerson Total Company Net Income / Loss2013-2018 (US$m, AGR %)
Table 7.48 Emerson Total Company Capital Expenditure 2013-2018 (US$m, AGR %)
Table 7.49 Emerson Strategic Alliances
List of Figures
Figure 2.1 Global Digital Oilfield Market Segmentation Overview
Figure 3.1 Global Digital Oilfield Market Forecast 2019-2029 (US$mn, AGR %)
Figure 4.1 Global Digital Oilfield Market By Process AGR Forecast 2019-2029 (AGR %)
Figure 4.2 Global Digital Oilfield Market By Process Forecast 2019-2029 (US$mn)
Figure 5.1 Global Digital Oilfield Market By Components AGR Forecast 2019-2029 (AGR %)
Figure 5.2 Global Digital Oilfield Market By Components Forecast 2019-2029 (US$mn)
Figure 5.3 Global Digital Oilfield Hardware by Regional Market Forecast 2019-2029 (US$m and Global AGR %)
Figure 5.4 Global Digital Oilfield Hardware by Process Market Forecast 2019-2029 (US$m and Global AGR %)
Figure 5.5 Global Digital Oilfield Software by Regional Market Forecast 2019-2029 (US$m and Global AGR %)
Figure 5.6 Global Digital Oilfield Software by Process Market Forecast 2019-2029 (US$m and Global AGR %)
Figure 5.7 Global Digital Oilfield Services by Regional Market Forecast 2019-2029 (US$m and Global AGR %)
Figure 5.8 Global Digital Oilfield Services by Process Market Forecast 2019-2029 (US$m and Global AGR %)
Figure 6.1 Regional Digital Oilfield Market Forecast 2019-2029 (US$m and Global AGR %)
Figure 6.2 North America Digital Oilfield Market Forecast 2019-2029 (US$mn and AGR %)
Figure 6.3 North America Digital Oilfield Market By Process AGR Forecast 2019-2029 (AGR %)
Figure 6.4 North America Digital Oilfield Market By Process Forecast 2019-2029 (US$mn)
Figure 6.5 North America Digital Oilfield Market By Components AGR Forecast 2019-2029 (AGR %)
Figure 6.6 North America Digital Oilfield Market By Components Forecast 2019-2029 (US$mn)
Figure 6.7 North America Digital Oilfield Market By Country AGR Forecast 2019-2029 (AGR %)
Figure 6.8 North America Digital Oilfield Market By Country Forecast 2019-2029 (US$mn)
Figure 6.9 Europe Digital Oilfield Market Forecast 2019-2029 (US$mn and AGR %)
Figure 6.10 Europe Digital Oilfield Market By Process AGR Forecast 2019-2029 (AGR %)
Figure 6.11 Europe Digital Oilfield Market By Process Forecast 2019-2029 (US$mn)
Figure 6.12 Europe Digital Oilfield Market By Components AGR Forecast 2019-2029 (AGR %)
Figure 6.13 Europe Digital Oilfield Market By Components Forecast 2019-2029 (US$mn)
Figure 6.14 Europe Digital Oilfield Market By Country AGR Forecast 2019-2029 (AGR %)
Figure 6.15 Europe Digital Oilfield Market By Country Forecast 2019-2029 (US$mn)
Figure 6.16 Asia-Pacific Digital Oilfield Market Forecast 2019-2029 (US$mn and AGR %)
Figure 6.17 Asia Pacific Digital Oilfield Market By Process AGR Forecast 2019-2029 (AGR %)
Figure 6.18 Asia-Pacific Digital Oilfield Market By Process Forecast 2019-2029 (US$mn)
Figure 6.19 Asia-Pacific Digital Oilfield Market By Components AGR Forecast 2019-2029 (AGR %)
Figure 6.20 Asia-Pacific Digital Oilfield Market By Components Forecast 2019-2029 (US$mn)
Figure 6.21 Asia-Pacific Digital Oilfield Market By Country AGR Forecast 2019-2029 (AGR %)
Figure 6.22 Asia Pacific Digital Oilfield Market By Country Forecast 2019-2029 (US$mn)
Figure 6.23 Middle East and Africa Digital Oilfield Market Forecast 2019-2029 (US$mn and AGR %)
Figure 6.24 Middle East and Africa Digital Oilfield Market By Process AGR Forecast 2019-2029 (AGR %)
Figure 6.25 Middle East and Africa Digital Oilfield Market By Process Forecast 2019-2029 (US$mn)
Figure 6.26 Middle East and Africa Digital Oilfield Market By Components AGR Forecast 2019-2029 (AGR %)
Figure 6.27 Middle East and Africa Digital Oilfield Market By Components Forecast 2019-2029 (US$mn)
Figure 6.28 Middle East and Africa Digital Oilfield Market By Country AGR Forecast 2019-2029 (AGR %)
Figure 6.29 Middle East and Africa Digital Oilfield Market By Country Forecast 2019-2029 (US$mn and AGR %)
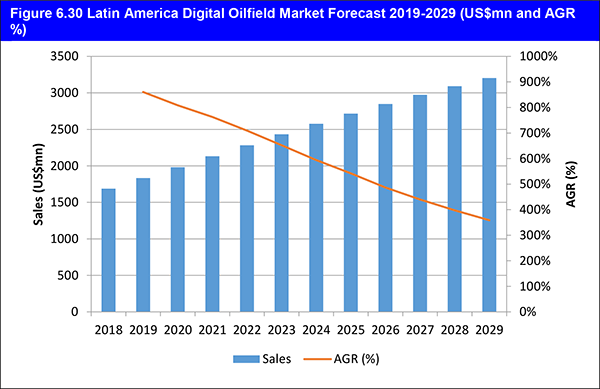
Figure 6.30 Latin America Digital Oilfield Market Forecast 2019-2029 (US$mn and AGR %)
Figure 6.31 Latin America Digital Oilfield Market By Process AGR Forecast 2019-2029 (AGR %)
Figure 6.32 Latin America Digital Oilfield Market By Process Forecast 2019-2029 (US$mn and AGR %)
Figure 6.33Latin America Digital Oilfield Market By Components AGR Forecast 2019-2029 (AGR %)
Figure 6.34 Latin America Digital Oilfield Market By Components Forecast 2019-2029 (US$mn)
Figure 6.35 Latin America Digital Oilfield Market By Country AGR Forecast 2019-2029 (AGR %)
Figure 6.36 Latin America Digital Oilfield Market By Country Forecast 2019-2029 (US$mn)
Figure 7.1 Schlumberger Total Company Sales 2013-2018(US$m, AGR %)
Figure 7.2 Schlumberger Total Company Net Income / Loss 2013-2018(US$m, AGR %)
Figure 7.3 Schlumberger Total Company Capital Expenditure 2013-2018(US$m, AGR %)
Figure 7.4 Weatherford Total Company Sales 2013-2018 (US$m, AGR %)
Figure 7.5 Weatherford Total Company Net Income / Loss 2013-2018(US$m, AGR %)
Figure 7.6 Weatherford Total Company Capital Expenditure 2013-2018(US$m, AGR %)
Figure 7.7 Baker Hughes Total Company Sales 2013-2018(US$m, AGR %)
Figure 7.8 Baker Hughes Total Company Net Income / Loss 2013-2018(US$m, AGR %)
Figure 7.9 Baker Hughes Total Company Capital Expenditure 2013-2018(US$m, AGR %)
Figure 7.10 Halliburton Total Company Sales 2013-2018(US$m, AGR %)
Figure 7.11 Halliburton Total Company Net Income / Loss 2013-2018(US$m, AGR %)
Figure 7.12 Halliburton Total Company Capital Expenditure 2013-2018(US$m, AGR %)
Figure 7.13 National Oilwell Varco Total Company Sales 2013-2018(US$m, AGR %)
Figure 7.14 National Oilwell Varco Total Company Net Income / Loss 2013-2018(US$m, AGR %)
Figure 7.15 National Oilwell Varco Total Company Capital Expenditure 2013-2018(US$m, AGR %)
Figure 7.16 Siemens Total Company Sales 2013-2018(US$m, AGR %)
Figure 7.17 Siemens Total Company Net Income / Loss 2013-2018(US$m, AGR %)
Figure 7.18 Honeywell Total Company Sales 2013-2018(US$m, AGR %)
Figure 7.19 Honeywell Total Company Net Income / Loss 2013-2018(US$m, AGR %)
Figure 7.20 Honeywell Total Company Capital Expenditure 2013-2018(US$m, AGR %)
Figure 7.21 Rockwell Total Company Sales2013-2018(US$m, AGR %)
Figure 7.22 Rockwell Total Company Net Income / Loss 2013-2018(US$m, AGR %)
Figure 7.23 Rockwell Total Company Capital Expenditure 2013-2018(US$m, AGR %)
Figure 7.24 ABB Total Company Sales 2013-2018(US$m, AGR %)
Figure 7.25 ABB Total Company Net Income / Loss 2013-2018(US$m, AGR %)
Figure 7.26 ABB Total Company Capital Expenditure 2013-2018(US$m, AGR %)
Figure 7.27 Emerson Total Company Sales 2013-2018(US$m, AGR %)
Figure 7.28 Emerson Total Company Net Income / Loss 2013-2018(US$m, AGR %)
Figure 7.29 Emerson Total Company Capital Expenditure 2013-2018(US$m, AGR %)
ABB
Baker Hughes
BP
Cisco
Cyviz
Elf Acquitaine
Emerson
Equinor
ExxonMobil
GA Drilling
GE Oil & Gas
Halliburton
Healthineers
Hexacom
Honeywell
IBM
Infosys
Kongsberg
Microsoft
National Oilwell Varco
Oracle
Rockwell Automation
Saudi Aramco
Schlumberger
Schneider Electric
Shell
Siemens
Siemens Gamesa Renewable Energy (SGRE).
Sinopec Oilfield Service Corporation
TechnipFMC Plc
VSG
Weatherford
Organisations Mentioned
European Union
Institute Francis du Perol
State Oil Company of Azerbaijan Republic (SOCAR)