The Biological Drug API Manufacturing Services World Industry and Market Predictions 2017-2027: Analysis and Forecasts for Mammalian Cell Cultures, Microbial Fermentations, Other Expression Systems, Human Growth Hormones, Insulin, Interferons, Monoclonal Antibodies, Vaccines and Geography report reviews the contract active pharmaceutical ingredient (API) manufacturing market for biologics. This study gives quantitative and qualitative analysis for that overall world market, as well as for countries and other submarkets, including the mammalian cell culture and microbial fermentation segments. This report assesses leading applications and significant developments within each, as well as drivers and restraints for them. Future trends that will affect the biotech API manufacturing services market are also examined. In addition, this study profiles leading contract manufacturing organisations (CMOs) in the outsourcing market and assesses their outlooks. Visiongain provides forecasts revenues for the period 2016 to 2027 for the biotech API manufacturing services market, as well as for therapeutic applications.
How this 227 page report delivers:
• Provides qualitative and quantitative analysis of the leading submarkets the period 2017-2027. Visiongain forecasts revenues and their growth for these submarkets:
– Mammalian cell culture
– Microbial fermentation
– Other expression platforms
• Provides qualitative and quantitative analysis of the leading contract API biological drug applications for the period 2017-2027. Visiongain forecasts contract API drug revenues to 2027 for these individual segments:
– Monoclonal antibody (mAb) therapies
– Vaccines
– Insulin therapies
– Interferon therapies
– Growth hormones.
• Find forecasts of the leading therapeutic and national markets from 2016 to 2027:
– The EU, including the five leading markets (UK, Germany, France, Italy and Spain).
– The US
– Japan
– Switzerland
– Emerging markets such as the BRIC (Brazil, Russia, India, and China) countries, South Korea and Singapore.
• Profiles leading global and national companies that offer biotech API manufacturing services to the pharmaceutical industry. For each company, current services offered, recent developments and outlooks are discussed. Leading CMOs profiled in this chapter are:
– Boehringer Ingelheim BioXcellence
– Celltrion
– DSM Biologics
– Lonza
– Samsung BioLogics
– Cytovance Biologics
– Fujifilm Diosynth Biotechnologies
– Operations of leading biopharma companies, such as AbbVie, GSK and Novartis.
• Discover the regulatory outlook for biotech API manufacturing in leading regional and national markets in 2017, as well as predicted developments for the period to 2027.
• Identify important drug development and technology trends that will affect CMOs, their clients and other market participants from 2017. The report also contains SWOT and STEP analysis of the industry and market.
• Find profiles for leading CMOs offering biological drug API manufacturing services to pharmaceutical companies.
Visiongain is a trading partner with the US Federal Government
CCR Ref number: KD4R6
1. Report Overview
1.1 Contract Biotech API Manufacturing: World Market Review 2017
1.2 Benefits of this Report
1.2.1 How This Report Delivers
1.2.2 Main Questions Answered by This Analytical Report
1.3 Who is This Report For?
1.4 Methods of the Study
1.5 Frequently Asked Questions (FAQ)
1.6 Some Associated Reports
1.7 About Visiongain
2. Introduction to Biotech API Manufacturing Services
2.1 What are Biotech API Manufacturing Services?
2.1.1 Producing Biotech API: An Overview of the Manufacturing Process
2.1.2 Defining the Biotech API Manufacturing Market
2.1.2 Differing Expression Systems to Manufacture APIs
2.2 Challenges in Manufacturing Biotech API
2.3 Outsourcing: A Common Trend in Biotech API Manufacturing Services
2.4 Future Trends for the Biotech API Manufacturing Services Market
3. Biotech API Manufacturing Services: World Market Outlook and Forecast 2017-2027
3.1 The Contract Biotech API Manufacturing Services Market Performance, 2016
3.1.1 Contract Biotech API Manufacturing Services: Forecast 2017-2027
3.2 Drivers and Restraints in the Biotech API Manufacturing Services Market
3.2.1.1 The Ageing Population is a Driver for Growth
3.2.1.2 The Patent Cliff Effect Will Stimulate Biologics and Biosimilar Development
3.2.1.3 Outsourcing as a Driver for Growth
3.2.1.4 Opportunities from the Long Pipeline Will Drive Growth
3.2.1.5 Increased Investment in Orphan Drugs from Companies
3.2.1.6 Emerging Markets Will Grow and Influence the Market
3.2.1.7 Technological Changes: Single-Use Technology Will Become Essential in the Next 10 Years
3.2.2 Restraints on Growth in the Biotech API Manufacturing Services Market
3.2.2.1 Pricing Pressures Will Limit Market Growth
3.2.2.2 Regulatory Restrictions Will Increase
3.2.2.3 Overcapacity Will Be Adverse to Market Growth for CMOs
3.2.2.4 Complexity of API Production is a Challenge
3.3 Outlook for the Outsourced Biotech API Services: Increased Demand
4. Biotech API Manufacturing Services Submarkets: World Market Outlook and Forecasts 2017-2027
4.1 Submarkets for the Biotech API Manufacturing Services Industry
4.1.1 The Mammalian Cell Culture Submarket
4.1.2 The Mammalian Cell Culture Submarket Forecast 2017-2027
4.1.3 ADCs and Next-Generation Antibodies Will Drive Growth 2017-2027
4.1.4 The Microbial Fermentation Submarket
4.1.5 The Microbial Fermentation Submarket Forecast 2017-2027
4.1.5.1 Increase in Demand for Insulin Will Drive Growth 2017-2027
4.1.6 Other APIs Expression Systems Are Still in Development
4.1.6.1 Plant-Made Pharmaceuticals
4.1.6.2 Yeast Cell Expression Systems
4.1.6.3 Insect Cell Expression Systems
4.1.6.4 Other Expression Systems Submarket Forecast 2017-2027
4.2 Chapter Summary: Positive Growth for the Market
5. Biotech API Manufacturing: Outlook for Leading Biological Drug Contract API Sectors: 2017-2027
5.1 Antibody Therapies: An Introduction to the Largest Contract API Biological Drug Sector
5.1.1 Contract API Monoclonal Antibody Manufacturing Forecast 2017-2027
5.1.2 Outlook: Outsourced Manufacturing for Monoclonal Antibody APIs Will Increase
5.2 Contract API Vaccine Manufacturing: A Promising Opportunity for CMOs
5.2.1 Contract API Vaccine Market: Outlook and Forecast 2017-2027
5.2.2 Challenges in Manufacturing Vaccines
5.3 Introduction to the Insulin Therapies Market and Outlook for the Contract API Insulin Therapies Market
5.3.1 Contract API Insulin Analogues Forecast 2017-2027
5.3.2 Insulin Analogues: In-House Production Restrains Contract API Insulin Therapies Market Growth
5.3.3 Development Trends in the Contract API Insulin Market to 2027
5.4 Introduction to the Interferon Therapy Market and Outlook for the Contract API Interferon Therapy Market
5.4.1 Contract API Interferon Market Forecast 2017-2027
5.4.2 Unlikely to be Opportunities in the Contract API Interferon Market
5.5 Introduction to the Growth Hormone Market and Outlook for the Contract API Growth Hormone Manufacturing Market
5.5.1 Contract API Growth Hormone Market Forecast 2016 to 2027
5.5.2 Most Manufacturing is In-House for Growth Hormone Production
5.5.3 Long-Acting Therapies Provide Opportunity for Outsourcing
5.6 Chapter Summary: Outsourcing for Key Biological Products 2017-2027
6. Leading National Markets for Contract Biotech API Manufacturing Services 2017-2027
6.1 Regional Breakdown of the World Biotech API Manufacturing Services Market
6.1.1 US and EU Dominate Growth for Leading National Submarkets 2017-2027
6.1.2 National Revenue Shares by 2027: Emerging Market Growth
6.2 Contract Biotech API Manufacturing in EU Market 2017-2027
6.2.1 Strong Growth for the EU Revenue Forecasts 2017-2027
6.2.2 Forecasts for Switzerland and Leading EU National Revenues 2017-2027
6.2.2.1 Germany Leads the EU Biotech Market with Strong Growth
6.2.2.2 UK: Strong Research Sector Will Drive Market Growth
6.2.2.3 France: Strong Vaccine Development Industry
6.2.2.4 Switzerland: Headquarters for Leading Companies
6.2.2.5 Spain: Numerous Biotech Companies
6.2.2.6 Italy: Outlook and Forecast 2017-2027
6.2.3 US: A Market Leader in Biotech API Manufacturing
6.2.4 Japan: A Less Mature Contract Manufacturing Market
6.2.5 BRIC Market: Outlook and Forecasts for Emerging Markets 2016- 2027
6.2.5.1 Emerging Nations May Develop a Presence in the Biologics Market
6.2.5.2 Increased Demand for Biosimilars and Biological Drugs 2017-2027
6.2.5.3 China is Poised for Growth: Forecast for 2017-2027
6.2.5.4 India Offers a Lower-Cost Advantage for Biotech API Manufacturing Services: Forecast 2017-2027
6.2.5.5 Brazilian and Russian Governments Promoting Domestic Biotech Development
6.2.5.6 Russian Biotech API Manufacturing Services Forecast: 2017-2027
6.2.5.7 Brazilian Biotech API Manufacturing Services Forecast: 2017-2027
6.2.6 South Korea: Market Forecast, 2017-2027
6.2.6.1 Leading CMOs Celltrion and Samsung BioLogics Drive the Market
6.2.7 Singapore: Market Forecast, 2017-2027
6.3 Summary of Chapter: Outlook for Leading National Submarkets 2017-2027
7. Leading CMOs in the Biotech API Manufacturing Services Market 2016
7.1 Four Companies Led the Market in 2016
7.2 Leading Companies by Capacity
7.2.1 Small-Scale Biopharmaceutical Manufacturing is a Common Trend
7.2.2 Barriers to Market Entry 2017-2027
7.2.2.1 The High Cost of Facilities: Acquisition as a Cheaper Alternative
7.3 FDA Opens Barriers for the Biosimilars Market
7.4 Boehringer Ingelheim BioXcellence
7.4.1 Strategic Outlook: Expanding into the Asian Market
7.5 Celltrion: Biologics Leader in Asia
7.5.1 Celltrion: Likely Target for Mergers and Acquisitions?
7.6 DSM Biologics: Strategically Increasing Capacity
7.7 Lonza Has the Largest Worldwide Cell Culture Capacity
7.7.1 Lonza: Biopharmaceutical Core Competency as a Strategy for Growth
7.8 Other Market Players of Interest in 2016
7.8.1 Samsung BioLogics: Focusing on Biosimilars
7.8.2 Cytovance Biologics: Plans to Expand
7.8.3 Fujifilm Diosynth Biotechnologies
7.8.3.1 Facility and Service Expansion for the Future
7.9 Leading Biopharma Companies Operate CMO Divisions
7.9.1 AbbVie Contract Manufacturing: Strength through Acquisition
7.9.2 GSK Biopharmaceuticals
7.9.3 Sandoz: Expertise in Biologics and Biosimilars
7.9.4 Rentschler Biotechnologie: Recent Expansions
7.10 Teva: A Future Player in the Biologics Market
7.11 Catalent Offers a New Platform through Partnership
7.12 Chapter Summary: Leading Companies 2016-2027
8. Biotech API Manufacturing Services Market Industry Trends 2017-2027: Qualitative Analysis
8.1 SWOT Analysis: Strengths and Weaknesses of the Biotech API Manufacturing Services Market 2017
8.1.1 Biopharmaceutical Demand for Outsourcing is Increasing
8.1.2 A Fragmented Market with a Costly and Difficult Manufacturing Process
8.2 Opportunities for the Biotech API Manufacturing Services Market 2017-2027
8.3 Threats for the Biotech API Manufacturing Services Market 2017-2027
8.4 STEP Analysis of the Biotech API Manufacturing Services Market
8.4.1 Social Factors: Drug Pricing Pressures to Meet Demand for an Increasing Ageing Population
8.4.2 Technological Factors: Advances Will Drive Growth
8.4.2.1 Single-Use Technology: A Vital Trend for the Future
8.4.3 Economic Factors: The High Cost of Manufacturing Will Lead to Outsourcing
8.4.4 Political Factors: Regulatory Requirements Need to Be Met
8.5 Trends in Biological Drug Development 2017-2027
8.5.1 Biosimilars Will Be an Important Opportunity for CMOs
8.5.2 CMOs are Investing in Next-Generation Antibody Development
8.5.3 Orphan Drugs and Personalised Medicine: Trend for Smaller Batches
8.5.4 Outlook for Single-Use Technologies in Biotech API Manufacturing 2017-2027
8.5.5 Outsourcing Trends for Biotech API Manufacturing 2017-2027
8.5.5.1 Biopharma Companies Continue to Invest in In-House Facilities
8.5.5.2 Off-shoring Biotech API Manufacturing to Emerging Markets: Not a Trend for this Decade?
8.5.5.3 Overcapacity is a Risk for the Biotech CMO Industry
8.5.5.4 Future Trends: Strategic Partnering
8.5.5.5 Alternative Expression Methods
8.6 Regulations and Effects on the Biotech API Manufacturing Services Industry
8.6.1 Effect on the Emerging Biotech API Manufacturing Services Market 2017-2027
8.6.2 Regulations in Other Countries in the Biotech API Market
8.7 Chapter Summary: Industry Trends for Contract Biotech API Manufacturing to 2027
9. Conclusions
9.1 The Contract Biotech API Manufacturing Services Market
9.2 Outlook for the Biotech API Manufacturing Services Market
9.2.1 Mammalian Cell Culture is the Leading Expression Platform for Outsourced Biotech API Manufacturing
9.2.2 The US and EU Markets Lead for the Global Biotech API Manufacturing Services Market in 2016
9.2.3 Single-Use Technology Will Become Indispensable for Success in the Market
9.3 Growth in the Market 2017-2027
9.3.1 The Future of the Biotech API Manufacturing Services Marketplace
10. Glossary
Some Associated Reports
Visiongain Report Sales Order Form
Appendix A
About Visiongain
Appendix B
List of Figures
Figure 1.1 Biological Drug API Manufacturing Services Submarkets 2017
Figure 2.1 Steps for Biological Drug Manufacturing, 2017
Figure 2.2 Contract API Manufacturing: Market Shares by Sector (%), 2016
Figure 2.3 Future Trends in the Biotech API Manufacturing Market, 2017-2027
Figure 3.1 Contract Biotech API Manufacturing Services Market: Revenue Forecast ($bn), AGR (%), 2017-2027
Figure 3.2 Contract Biotech API Manufacturing: Market Drivers, 2017-2027
Figure 3.3 Contract Biotech API Manufacturing: Market Restraints, 2017-2027
Figure 4.1 Contract Biotech API Manufacturing: Market Shares (%) by Sector, 2016
Figure 4.2 Mammalian Cell Culture Submarket Forecast, Revenue ($bn), AGR(%), 2017-2027
Figure 4.3 Mammalian Cell Culture Submarket: Drivers and Restraints, 2017-2027
Figure 4.4 Microbial Fermentation Submarket Forecast($bn), AGR (%), 2017-2027
Figure 4.5 Microbial Fermentation Submarket: Drivers and Restraints, 2016
Figure 4.9 Forecast for Other Expression Systems Submarket Forecast ($bn), AGR (%), CAGR (%), 2016-2021
Figure 4.10 Forecast for Other Expression Systems Submarket Forecast ($bn), AGR (%), CAGR (%), 2022-2027
Figure 5.1 Leading Contract API Biological Drug by Sector, 2016
Figure 5.2 Monoclonal Antibody Market: Contract API Revenues Forecast ($bn), AGR (%), 2017-2027
Figure 5.3 Vaccines Market: Contract API Revenues Forecast ($bn), AGR(%) 2017-2027
Figure 5.4 Comparison between biomanufacturing platforms for Vaccine production: VLP
Figure 5.5 Insulin Therapies Market: Contract API Revenues Forecast ($bn), AGR (%), 2017-2027
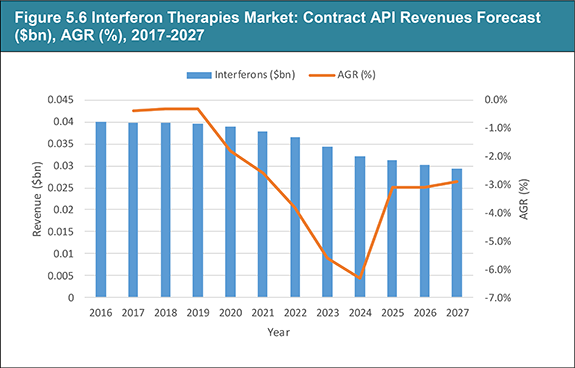
Figure 5.6 Interferon Therapies Market: Contract API Revenues Forecast ($bn), AGR (%), 2017-2027
Figure 5.7 Growth Hormones Market: Contract API Revenues Forecast ($bn), AGR (%), 2017-2027
Figure 6.1 Contract Biotech API Manufacturing: Market Shares by Region (%), 2016
Figure 6.2 Contract Biotech API Manufacturing: Market Shares by Region (%) 2020
Figure 6.3 Contract Biotech API Manufacturing: Market Shares by Region (%) 2026
Figure 6.4 EU and Switzerland Contract Biotech API Manufacturing Revenue Forecast ($bn), AGR (%), 2017-2027
Figure 6.5 EU Contract Biotech API Manufacturing: Leading National Revenue Shares (%), 2016
Figure 6.6 Germany Contract Biotech API Manufacturing Revenue Forecast ($bn), 2017-2027
Figure 6.7 UK Contract Biotech API Manufacturing Revenue Forecast ($bn), AGR (%), 2017-2027
Figure 6.8 France Contract Biotech API Manufacturing Revenue Forecast ($bn), AGR (%), 2017-2027
Figure 6.9 Switzerland Contract Biotech API Manufacturing Revenue Forecast ($bn), AGR (%), 2017-2027
Figure 6.10 Spanish Contract Biotech API Manufacturing Revenue Forecast ($bn), AGR (%), 2017-2027
Figure 6.11 Italian Contract Biotech API Manufacturing Revenue Forecast ($bn), AGR (%), 2017-2027
Figure 6.12 US Contract Biotech API Manufacturing Revenue Forecast ($bn), AGR (%), 2017-2027
Figure 6.13 Japanese Contract Biotech API Manufacturing Revenue Forecast ($bn), AGR (%), 2017-2027
Figure 6.14 Contract Biotech API Manufacturing Market: BRIC National Revenue Forecasts ($bn), AGR (%), 2016 -2027
Figure 6.15 Biologics Market: BRIC Revenue Shares (%), 2016
Figure 6.16 Chinese Contract Biotech API Manufacturing Revenue Forecast ($bn), CAGR (%), AGR (%), 2017-2027
Figure 6.17 India Contract Biotech API Manufacturing Revenue Forecast ($bn), AGR (%), 2017-2027
Figure 6.18 Russia Contract Biotech API Manufacturing Revenue Forecast ($bn), AGR (%), 2017-2027
Figure 6.19 Brazilian Contract Biotech API Manufacturing Revenue Forecast ($bn), AGR (%), 2017-2027
Figure 6.20 South Korean Contract Biotech API Manufacturing Revenue Forecast ($bn), AGR (%), 2017-2027
Figure 6.21 Singaporean Contract Biotech API Manufacturing Revenue Forecast ($bn), AGR (%), 2017-2027
Figure 7.1 Leading Biotech API CMOs: Mammalian Cell Culture Manufacturing Scale, 2016
Figure 7.2 Leading Biotech API CMOs: Microbial Fermentation Manufacturing Scale, 2015
Figure 7.3 Boehringer Ingelheim BioXcellence: Revenue ($bn), 2014-2016
Figure 7.4 Celltrion: Revenue ($bn), 2009-2015
Figure 7.5 DSP: Pharmaceutical Biotech Manufacturing Revenue ($bn), 2011-2015
Figure 7.6 Lonza: Pharmaceutical Contract Manufacturing Revenue ($bn), 2012-2016
Figure 9.1 Contract Biotech API Manufacturing Market: Revenue Forecasts ($bn) by Sector, 2016 - 2027
Figure 9.2 Contract Biotech API Manufacturing Market: Revenue Forecasts ($bn) by Region, 2016, 2018, 2020, 2022, 2024 and 2026
List of Tables
Table 1.1: Redacted Submarket Forecast : Revenue Forecasts by Sector ($bn), Annual Growth (%) and CAGR, 2017-2027
Table 2.1 Contract API Manufacturing: Revenues ($bn) and Market Share (%) by Sector, 2016
Table 3.1 Contract Biotech API Manufacturing Services Market: Overall Revenue Forecast ($bn), AGR (%), CAGR (%), 2016-2021
Table 3.2 Contract Biotech API Manufacturing Services Market: Overall Revenue Forecast ($bn), AGR (%), CAGR (%), 2022-2027
Table 4.1 Contract Biotech API Manufacturing: Overall World Market and Main Submarket Revenue Forecasts ($bn), AGR(%), CAGR(%), 2016-2021
Table 4.2 Contract Biotech API Manufacturing: Overall World Market and Main Submarket Revenue Forecasts ($bn), AGR(%), CAGR(%), 2022-2027
Table 4.3 ADC Pipeline 2016
Table 4.3 ADC Pipeline 2016 (continued)
Table 4.3 ADC Pipeline 2016 (continued)
Table 4.4 Mammalian Cell Culture Submarket: API Revenue Forecast ($bn), AGR(%), CAGR(%), 2016-2021
Table 4.5 Mammalian Cell Culture Submarket: API Revenue Forecast ($bn), AGR(%), CAGR(%), 2022-2027
Table 4.6 Other Expression Systems Submarket Two Year Forecast Revenues ($bn), AGR (%), 2017-2027
Table 4.6 Selected CMOs Investing in Biological API Manufacturing Capacity, 2016
Table 4.7 Microbial Fermentation: API Submarket Revenue Forecast ($bn), AGR (%), CAGR (%), 2016-2021
Table 4.8 Microbial Fermentation: API Submarket Revenue Forecast ($bn), AGR (%), CAGR (%), 2022-2027
Table 5.1 Top Ten Best-Selling Drugs in 2016: Revenue ($bn)
Table 5.2 Contract API Biological Drug Revenue Forecasts ($bn), AGR (%), CAGR (%), by Therapeutic Area, 2016-2021
Table 5.3 Leading Contract API Biological Drug Revenue Forecasts ($bn) AGR (%), CAGR (%), by Therapeutic Area, 2022-2027
Table 5.4 Monoclonal Antibody Types and Sources
Table 5.5 Monoclonal Antibody Market: Contract API Revenue Forecast ($bn), CAGR (%), AGR (%), 2016-2021
Table 5.6 Monoclonal Antibody Market: Contract API Revenue Forecast ($bn), CAGR (%), AGR (%), 2022-2027
Table 5.7 The Four Classes of Next- Generation Antibody Therapies
Table 5.8 Vaccines Market: Contract API Revenue Forecast ($bn), GAGR (%), AGR (%) 2016-2021
Table 5.9 Vaccines Market: Contract API Revenue Forecast ($bn), GAGR (%), AGR (%) 2022-2027
Table 5.10 Insulin Therapies Market: Contract API Revenue Forecast ($bn), AGR (%), CAGR (%), 2016-2021
Table 5.11 Insulin Therapies Market: Contract API Revenue Forecast ($bn), AGR (%), CAGR (%), 2022-2027
Table 5.12 Interferon Therapies Market: Contract API Revenue Forecast ($bn), CAGR (%), AGR (%), 2016-2021
Table 5.13 Interferon Therapies Market: Contract API Revenue Forecast ($bn), ), CAGR (%), AGR (%), 2022-2027
Table 5.14 Growth Hormones Market: Contract API Revenue Forecast ($bn), CAGR (%), AGR (%), 2016-2021
Table 5.15 Growth Hormones Market: Contract API Revenue Forecast ($bn), CAGR (%), AGR (%), 2022-2027
Table 5.16 Selected Long-Acting Growth Hormones in Development, 2016
Table 6.1 Contract Biotech API Manufacturing Market: Revenues ($bn) and Market Shares (%) by Region, 2016
Table 6.2 Contract Biotech API Manufacturing Market: Leading Regional and National Revenue Forecasts ($bn), CAGR (%), AGR (%), 2016-2021
Table 6.3 Contract Biotech API Manufacturing Market: Leading Regional and National Revenue Forecasts ($bn), CAGR (%), AGR (%), 2022-2027
Table 6.4 Contract Biotech API Manufacturing Market: National Revenue Two Year Shares (%), 2016-2026
Table 6.5 EU and Switzerland Contract Biotech API Manufacturing: Revenue Forecasts ($bn), GAGR (%), AGR (%), 2016-2021
Table 6.6 EU and Switzerland Contract Biotech API Manufacturing: Revenue Forecasts ($bn), GAGR (%), AGR (%), 2021-2026
Table 6.7 EU and Switzerland Contract Biotech API Manufacturing: Revenues ($bn) and Shares (%) by Leading Country, 2016
Table 6.8 Germany Contract Biotech API Manufacturing Revenue Forecast ($bn), GAGR (%), AGR (%), 2016-2021
Table 6.9 Germany Contract Biotech API Manufacturing Revenue Forecast ($bn), GAGR (%), AGR (%), 2022-2027
Table 6.10 UK Contract Biotech API Manufacturing Revenue Forecast ($bn), GARG (%), AGR (%), 2016-2021
Table 6.11 UK Contract Biotech API Manufacturing Revenue Forecast ($bn), GARG (%), AGR (%), 2022-2027
Table 6.12 France Contract Biotech API Manufacturing Revenue Forecast ($bn), GARG (%), AGR (%), 2016-2021
Table 6.13 France Contract Biotech API Manufacturing Revenue Forecast ($bn), GARG (%), AGR (%), 2022-2027
Table 6.14 Switzerland Contract Biotech API Manufacturing Revenue Forecast ($bn), CAGR (%), AGR (%), 2016-2021
Table 6.15 Switzerland Contract Biotech API Manufacturing Revenue Forecast ($bn), CAGR (%), AGR (%), 2022-2027
Table 6.16 Spain Contract Biotech API Manufacturing Revenue Forecast ($bn), CAGR (%), AGR (%),2016-2021
Table 6.17 Spain Contract Biotech API Manufacturing Revenue Forecast ($bn), CAGR (%), AGR (%), 2022-2027
Table 6.18 Italian Contract Biotech API Manufacturing Revenue Forecast ($bn), CAGR (%), AGR (%), 2016-2021
Table 6.19 Italian Contract Biotech API Manufacturing Revenue Forecast ($bn), CAGR (%), AGR (%), 2022-2027
Table 6.20 US Contract Biotech API Manufacturing Revenue Forecast ($bn), CAGR (%), AGR (%), 2016-2021
Table 6.21 US Contract Biotech API Manufacturing Revenue Forecast ($bn), CAGR (%), AGR (%), 2022-2027
Table 6.22 Japanese Contract Biotech API Manufacturing Revenue Forecast ($bn), CAGR (%), AGR (%), 2016-2021
Table 6.23 Japanese Contract Biotech API Manufacturing Revenue Forecast, CAGR (%), AGR (%), ($bn),2022-2027
Table 6.24 Contract Biotech API Manufacturing Market: BRIC National Revenue Forecasts ($bn), CAGR (%), AGR (%), 2016-2021
Table 6.25 Contract Biotech API Manufacturing Market: BRIC National Revenue Forecasts ($bn), CAGR (%), AGR (%), 2022-2027
Table 6.26 BRIC Markets: API Revenues ($bn) and Market Shares (%), 2016
Table 6.27 Chinese Contract Biotech API Manufacturing Revenue Forecast ($bn), CAGR (%), AGR (%), 2016-2021
Table 6.28 Chinese Contract Biotech API Manufacturing Revenue Forecast ($bn), CAGR (%), AGR (%), 2022-2027
Table 6.29 India Contract Biotech API Manufacturing Revenue Forecast ($bn), GAGR (%), AGR (%) 2016-2021
Table 6.30 India Contract Biotech API Manufacturing Revenue Forecast ($bn), CAGR (%), AGR (%), 2022-2027
Table 6.31 Russia Contract Biotech API Manufacturing Revenue Forecast ($bn), CAGR (%), AGR (%), 2016-2021
Table 6.32 Russia Contract Biotech API Manufacturing Revenue Forecast ($bn), CAGR (%), AGR (%), 2022-2027
Table 6.33 Brazilian Contract Biotech API Manufacturing Revenue Forecast ($bn), CAGR (%), AGR (%), 2016-2021
Table 6.34 Brazilian Contract Biotech API Manufacturing Revenue Forecast ($bn), CAGR (%), AGR (%), 2022-2027
Table 6.35 South Korean Contract Biotech API Manufacturing Revenue Forecast ($bn), CAGR (%), AGR (%), 2016-2021
Table 6.36 South Korean Contract Biotech API Manufacturing Revenue Forecast ($bn), CAGR (%), AGR (%), 2022-2027
Table 6.37 Selected Biotechs and Pharmaceutical Companies with Manufacturing Facilities in Tuas, 2015
Table 6.38 Singaporean Contract Biotech API Manufacturing Revenue Forecast ($bn), CAGR (%), AGR (%), 2016-2021
Table 6.39 Singaporean Contract Biotech API Manufacturing Revenue Forecast ($bn), CAGR (%), AGR (%), 2022-2027
Table 7.1 Leading Biotech API CMOs: Mammalian Cell Culture and Microbial Fermentation Manufacturing Scale, 2015
Table 7.2 Selected Other Biotech API CMOs: Mammalian Cell Culture and Microbial Fermentation Manufacturing Scale, 2015
Table 7.3 Boehringer Ingelheim BioXcellence: Manufacturing Capacity, 2015
Table 7.4 Boehringer Ingelheim BioXcellence: Revenue ($bn), 2014-2016
Table 7.5 Celltrion: Revenue ($bn), CAGR (%), AGR (%), 2009-2015
Table 7.6 Lonza: Pharmaceutical Contract Manufacturing Revenue ($bn), CAGR (%), AGR (%), 2012-2016
Table 7.7 Lonza: New Biological Drug Sector Manufacturing Agreements, 2015
Table 7.8 Sandoz Biosimilar Pipelines: Selected Biosimilars, 2016
Table 8.1 Contract Biotech API Manufacturing Market: Strengths and Weaknesses, 2016-2017
Table 8.2 Contract Biotech API Manufacturing Market: Opportunities and Threats, 2017-2027
Table 8.3 Biotech API Manufacturing Services Market: STEP Analysis, 2017
Table 8.4 Selected EU-Approved Biosimilars: Manufacturers and Companies, 2016
Table 8.5 Approved Next-Generation Antibody Therapies, 2016
Table 9.1 Contract Biotech API Manufacturing Market: Revenue Forecasts ($bn) by Sector, 2016, 2018, 2020, 2022, 2024 and 2026
Table 9.2 Contract Biotech API Manufacturing Market: Revenue Forecasts ($bn) by Region, 2016, 2018, 2020, 2022, 2024 and 2026


