The Autonomous Underwater Vehicle Market Report 2023-2033: This report will prove invaluable to leading firms striving for new revenue pockets if they wish to better understand the industry and its underlying dynamics. It will be useful for companies that would like to expand into different industries or to expand their existing operations in a new region.
Growing Marine Research and Oceanographic Studies
The increasing focus on marine research and oceanographic studies is fuelling the demand for AUVs. Researchers and scientists utilize AUVs to study marine ecosystems, map seafloor habitats, and monitor underwater environments. AUVs provide a cost-effective and non-intrusive means of collecting valuable data in challenging and remote marine locations, contributing to a deeper understanding of ocean dynamics and marine life.
Surging Demand for Underwater Surveys and Inspections
The need for efficient underwater surveys and inspections in industries such as oil and gas, offshore renewables, and marine infrastructure drives the adoption of AUVs. These vehicles can autonomously perform detailed inspections of underwater structures, pipelines, and seabed, reducing the reliance on manned diving operations and ensuring comprehensive data collection for maintenance and safety assessments.
What Questions Should You Ask before Buying a Market Research Report?
• How is the autonomous underwater vehicle market evolving?
• What is driving and restraining the autonomous underwater vehicle market?
• How will each autonomous underwater vehicle submarket segment grow over the forecast period and how much revenue will these submarkets account for in 2033?
• How will the market shares for each autonomous underwater vehicle submarket develop from 2023 to 2033?
• What will be the main driver for the overall market from 2023 to 2033?
• Will leading autonomous underwater vehicle markets broadly follow the macroeconomic dynamics, or will individual national markets outperform others?
• How will the market shares of the national markets change by 2033 and which geographical region will lead the market in 2033?
• Who are the leading players and what are their prospects over the forecast period?
• What are the autonomous underwater vehicle projects for these leading companies?
• How will the industry evolve during the period between 2023 and 2033? What are the implications of autonomous underwater vehicle projects taking place now and over the next 10 years?
• Is there a greater need for product commercialisation to further scale the autonomous underwater vehicle market?
• Where is the autonomous underwater vehicle market heading and how can you ensure you are at the forefront of the market?
• What are the best investment options for new product and service lines?
• What are the key prospects for moving companies into a new growth path and C-suite?
You need to discover how this will impact the autonomous underwater vehicle market today, and over the next 10 years:
• Our 411-page report provides 127 tables and 190 charts/graphs exclusively to you.
• The report highlights key lucrative areas in the industry so you can target them – NOW.
• It contains in-depth analysis of global, regional and national sales and growth.
• It highlights for you the key successful trends, changes and revenue projections made by your competitors.
This report tells you TODAY how the autonomous underwater vehicle market will develop in the next 10 years, and in line with the variations in COVID-19 economic recession and bounce. This market is more critical now than at any point over the last 10 years.
Forecasts to 2033 and other analyses reveal commercial prospects
• In addition to revenue forecasting to 2033, our new study provides you with recent results, growth rates, and market shares.
• You will find original analyses, with business outlooks and developments.
• Discover qualitative analyses (including market dynamics, drivers, opportunities, restraints and challenges), cost structure, impact of rising autonomous underwater vehicle prices and recent developments.
This report includes data analysis and invaluable insight into how COVID-19 will affect the industry and your company. Four COVID-19 recovery patterns and their impact, namely, “V”, “L”, “W” and “U” are discussed in this report.
Segments Covered in the Report
Market Segment by Type
• Shallow AUVs (up to 100 m)
• Medium AUVs (up to 1,000m)
• Large AUVs (more than 1,000m)
Market Segment by Shape
• Torpedo
• Laminar Flow Body
• Streamlined Rectangular Style
• Multi-hull Vehicle
Market Segment by Technology
• Collision Avoidance
• Communication
• Navigation
• Propulsion
• Imaging
Market Segment by Application
• Military & Defense
• Oil & Gas
• Environment Protection & Monitoring
• Oceanography
• Archeology & Exploration
• Search & Salvage Operations

In addition to the revenue predictions for the overall world market and segments, you will also find revenue forecasts for four regional and 20 leading national markets:
North America
• U.S.
• Canada
Europe
• Germany
• Spain
• United Kingdom
• France
• Italy
• Rest of Europe
Asia Pacific
• China
• Japan
• India
• Australia
• South Korea
• Rest of Asia Pacific
Latin America
• Brazil
• Mexico
• Rest of Latin America
Middle East & Africa
• GCC
• South Africa
• Rest of Middle East & Africa
Need industry data? Please contact us today.
The report also includes profiles and for some of the leading companies in the Autonomous Underwater Vehicle Market, 2023 to 2033, with a focus on this segment of these companies’ operations.
Leading companies and the potential for market growth
• Bluefin Robotics
• Boston Engineering Corporation
• ECA Group
• Fugro
• General Dynamics Mission Systems
• Hydromea
• Kongsberg Gruppen
• L3 OceanServer
• L3Harris Technologies Inc.
• Liquid Robotics
• Lockheed Martin Corporation
• Oceaneering International, Inc.
• Riptide Autonomous Solutions
• Saab AB
• Teledyne Technologies Incorporated
Overall world revenue for Autonomous Underwater Vehicle Market, 2023 to 2033 in terms of value the market will surpass US$1,079.6 million in 2023, our work calculates. We predict strong revenue growth through to 2033. Our work identifies which organizations hold the greatest potential. Discover their capabilities, progress, and commercial prospects, helping you stay ahead.
How will the Autonomous Underwater Vehicle Market, 2023 to 2033 report help you?
In summary, our 410+ page report provides you with the following knowledge:
• Revenue forecasts to 2033 for Autonomous Underwater Vehicle Market, 2023 to 2033 Market, with forecasts for type, application, technology, and shape, each forecast at a global and regional level – discover the industry’s prospects, finding the most lucrative places for investments and revenues.
• Revenue forecasts to 2033 for four regional and 20 key national markets – See forecasts for the Autonomous Underwater Vehicle Market, 2023 to 2033 market in North America, Europe, Asia-Pacific, Latin America and Middle East & Africa. Also forecasted is the market in the US, Canada, Brazil, Germany, France, UK, Italy, China, India, Japan, and Australia among other prominent economies.
• Prospects for established firms and those seeking to enter the market – including company profiles for 15 of the major companies involved in the Autonomous Underwater Vehicle Market, 2023 to 2033.
Find quantitative and qualitative analyses with independent predictions. Receive information that only our report contains, staying informed with invaluable business intelligence.
Information found nowhere else
With our new report, you are less likely to fall behind in knowledge or miss out on opportunities. See how our work could benefit your research, analyses, and decisions. Visiongain’s study is for everybody needing commercial analyses for the Autonomous Underwater Vehicle Market, 2023 to 2033, market-leading companies. You will find data, trends and predictions.
To access the data contained in this document please email contactus@visiongain.com
Buy our report today Autonomous Underwater Vehicle Market Report 2023-2033: Forecasts by Type (Shallow AUVs (up to 100 m), Medium AUVs (up to 1,000m), Large AUVs (more than 1,000m)), by Shape (Torpedo, Laminar Flow Body, Streamlined Rectangular Style, Multi-hull Vehicle), by Technology (Collision Avoidance, Communication, Navigation, Propulsion, Imaging), by Application (Military & Defence, Oil & Gas, Environment Protection & Monitoring, Oceanography, Archaeology & Exploration, Search & Salvage Operations) AND Regional and Leading National Market Analysis PLUS Analysis of Leading Companies AND COVID-19 Impact and Recovery Pattern Analysis. Avoid missing out by staying informed – order our report now.
Visiongain is a trading partner with the US Federal Government
CCR Ref number: KD4R6
Do you have any custom requirements we can help you with? Any need for a specific country, geo region, market segment or specific company information? Contact us today, we can discuss your needs and see how we can help: contactus@visiongain.com
1 Report Overview
1.1 Objectives of the Study
1.2 Introduction to Global Autonomous Underwater Vehicle Market
1.3 What This Report Delivers
1.4 Why You Should Read This Report
1.5 Key Questions Answered by This Analytical Report
1.6 Who Is This Report for?
1.7 Methodology
1.7.1 Market Definitions
1.7.2 Market Evaluation & Forecasting Methodology
1.7.3 Data Validation
1.7.3.1 Primary Research
1.7.3.2 Secondary Research
1.8 Frequently Asked Questions (FAQs)
1.9 Associated Visiongain Reports
1.10 About Visiongain
2 Executive Summary
3 Market Overview
3.1 Key Findings
3.2 Market Dynamics
3.2.1 Market Driving Factors
3.2.1.1 Increasing Deep- Water Offshore Oil & Gas Production to Propel Market Growth
3.2.1.2 The Risk of Injury or Death Is Greatly Reduced, Making Wavs Operations Much Safer than Traditional Methods
3.2.1.3 AUVs Can be Equipped with a Range of Sensors and Instruments for Collecting Data
3.2.2 Market Restraining Factors
3.2.2.1 AUVs Navigation and Control Is the Need for Precise, Accurate Location Tracking and Guidance
3.2.2.2 Slow Underwater Survey Speed Resulting from Use of Acoustic Communication Technology
3.2.2.3 AUVs Rely on Batteries to Power their Propulsion Systems and Onboard
3.2.3 Market Opportunities
3.2.3.1 Increasing Use of UUVs for Mine Disposal & Anti – Submarine Warfare Operations
3.2.3.2 AUVs in Commercial Settings Is their Ability to Reduce Operational Costs
3.2.3.3 Growing Demand for Underwater Exploration and Research
3.3 Porter’s Five Forces Analysis
3.3.1 Bargaining Power of Suppliers (Medium)
3.3.2 Bargaining Power of Buyers (Moderate to High)
3.3.3 Competitive Rivalry (Moderate to High)
3.3.4 Threat from Substitutes (Low)
3.3.5 Threat of New Entrants (Low)
3.4 COVID-19 Impact Analysis
3.4.1 “V-Shaped Recovery”
3.4.2 “U-Shaped Recovery”
3.4.3 “W-Shaped Recovery”
3.4.4 “L-Shaped Recovery”
3.5 PEST Analysis
4 Autonomous Underwater Vehicle (AUV) Market Analysis by Type
4.1 Key Findings
4.2 Type Segment: Market Attractiveness Index
4.3 Autonomous Underwater Vehicle (AUV) Market Size Estimation and Forecast by Type
4.4 Shallow AUVs (up to 100 m)
4.4.1 Market Size by Region, 2023-2033 (US$ Million)
4.4.2 Market Share by Region, 2023 & 2033 (%)
4.5 Medium AUVs (up to 1,000m)
4.5.1 Market Size by Region, 2023-2033 (US$ Million)
4.5.2 Market Share by Region, 2023 & 2033 (%)
4.6 Large AUVs (more than 1,000m)
4.6.1 Market Size by Region, 2023-2033 (US$ Million)
4.6.2 Market Share by Region, 2023 & 2033 (%)
5 Autonomous Underwater Vehicle (AUV) Market Analysis by Shape
5.1 Key Findings
5.2 Shape Segment: Market Attractiveness Index
5.3 Autonomous Underwater Vehicle (AUV) Market Size Estimation and Forecast by Shape
5.4 Torpedo
5.4.1 Market Size by Region, 2023-2033 (US$ Million)
5.4.2 Market Share by Region, 2023 & 2033 (%)
5.5 Laminar Flow Body
5.5.1 Market Size by Region, 2023-2033 (US$ Million)
5.5.2 Market Share by Region, 2023 & 2033 (%)
5.6 Streamlined Rectangular Style
5.6.1 Market Size by Region, 2023-2033 (US$ Million)
5.6.2 Market Share by Region, 2023 & 2033 (%)
5.7 Multi-Hull Vehicle
5.7.1 Market Size by Region, 2023-2033 (US$ Million)
5.7.2 Market Share by Region, 2023 & 2033 (%)
6 Autonomous Underwater Vehicle (AUV) Market Analysis by Technology
6.1 Key Findings
6.2 Technology Segment: Market Attractiveness Index
6.3 Autonomous Underwater Vehicle (AUV) Market Size Estimation and Forecast by Technology
6.4 Collision Avoidance
6.4.1 Market Size by Region, 2023-2033 (US$ Million)
6.4.2 Market Share by Region, 2023 & 2033 (%)
6.5 Communication
6.5.1 Market Size by Region, 2023-2033 (US$ Million)
6.5.2 Market Share by Region, 2023 & 2033 (%)
6.6 Navigation
6.6.1 Market Size by Region, 2023-2033 (US$ Million)
6.6.2 Market Share by Region, 2023 & 2033 (%)
6.7 Propulsion
6.7.1 Market Size by Region, 2023-2033 (US$ Million)
6.7.2 Market Share by Region, 2023 & 2033 (%)
6.8 Imaging
6.8.1 Market Size by Region, 2023-2033 (US$ Million)
6.8.2 Market Share by Region, 2023 & 2033 (%)
7 Autonomous Underwater Vehicle (AUV) Market Analysis by Application
7.1 Key Findings
7.2 Application Segment: Market Attractiveness Index
7.3 Autonomous Underwater Vehicle (AUV) Market Size Estimation and Forecast by Application
7.4 Military & Defence
7.4.1 Market Size by Region, 2023-2033 (US$ Million)
7.4.2 Market Share by Region, 2023 & 2033 (%)
7.5 Oil & Gas
7.5.1 Market Size by Region, 2023-2033 (US$ Million)
7.5.2 Market Share by Region, 2023 & 2033 (%)
7.6 Environment Protection & Monitoring
7.6.1 Market Size by Region, 2023-2033 (US$ Million)
7.6.2 Market Share by Region, 2023 & 2033 (%)
7.7 Oceanography
7.7.1 Market Size by Region, 2023-2033 (US$ Million)
7.7.2 Market Share by Region, 2023 & 2033 (%)
7.8 Archeology & Exploration
7.8.1 Market Size by Region, 2023-2033 (US$ Million)
7.8.2 Market Share by Region, 2023 & 2033 (%)
7.9 Search & Salvage Operations
7.9.1 Market Size by Region, 2023-2033 (US$ Million)
7.9.2 Market Share by Region, 2023 & 2033 (%)
8 Autonomous Underwater Vehicle (AUV) Market Analysis by Region
8.1 Key Findings
8.2 Regional Market Size Estimation and Forecast
9 North America Autonomous Underwater Vehicle (AUV) Market Analysis
9.1 Key Findings
9.2 North America Autonomous Underwater Vehicle (AUV) Market Attractiveness Index
9.3 North America Autonomous Underwater Vehicle (AUV) Market by Country, 2023, 2028 & 2033 (US$ Million)
9.4 North America Autonomous Underwater Vehicle (AUV) Market Size Estimation and Forecast
9.5 North America Autonomous Underwater Vehicle (AUV) Market Size Estimation and Forecast by Country
9.6 North America Autonomous Underwater Vehicle (AUV) Market Size Estimation and Forecast by Type
9.7 North America Autonomous Underwater Vehicle (AUV) Market Size Estimation and Forecast by Shape
9.8 North America Autonomous Underwater Vehicle (AUV) Market Size Estimation and Forecast by Technology
9.9 North America Autonomous Underwater Vehicle (AUV) Market Size Estimation and Forecast by Application
9.10 U.S. Autonomous Underwater Vehicle (AUV) Market Analysis
9.11 Canada Autonomous Underwater Vehicle (AUV) Market Analysis
10 Europe Autonomous Underwater Vehicle (AUV) Market Analysis
10.1 Key Findings
10.2 Europe Autonomous Underwater Vehicle (AUV) Market Attractiveness Index
10.3 Europe Autonomous Underwater Vehicle (AUV) Market by Country, 2023, 2028 & 2033 (US$ Million)
10.4 Europe Autonomous Underwater Vehicle (AUV) Market Size Estimation and Forecast
10.5 Europe Autonomous Underwater Vehicle (AUV) Market Size Estimation and Forecast by Country
10.6 Europe Autonomous Underwater Vehicle (AUV) Market Size Estimation and Forecast by Type
10.7 Europe Autonomous Underwater Vehicle (AUV) Market Size Estimation and Forecast by Shape
10.8 Europe Autonomous Underwater Vehicle (AUV) Market Size Estimation and Forecast by Technology
10.9 Europe Autonomous Underwater Vehicle (AUV) Market Size Estimation and Forecast by Application
10.10 Germany Autonomous Underwater Vehicle (AUV) Market Analysis
10.11 UK Autonomous Underwater Vehicle (AUV) Market Analysis
10.12 France Autonomous Underwater Vehicle (AUV) Market Analysis
10.13 Italy Autonomous Underwater Vehicle (AUV) Market Analysis
10.14 Russia Autonomous Underwater Vehicle (AUV) Market Analysis
10.15 Rest of Europe Autonomous Underwater Vehicle (AUV) Market Analysis
11 Asia-Pacific Autonomous Underwater Vehicle (AUV) Market Analysis
11.1 Key Findings
11.2 Asia-Pacific Autonomous Underwater Vehicle (AUV) Market Attractiveness Index
11.3 Asia-Pacific Autonomous Underwater Vehicle (AUV) Market by Country, 2023, 2028 & 2033 (US$ Million)
11.4 Asia-Pacific Autonomous Underwater Vehicle (AUV) Market Size Estimation and Forecast
11.5 Asia-Pacific Autonomous Underwater Vehicle (AUV) Market Size Estimation and Forecast by Country
11.6 Asia-Pacific Autonomous Underwater Vehicle (AUV) Market Size Estimation and Forecast by Type
11.7 Asia-Pacific Autonomous Underwater Vehicle (AUV) Market Size Estimation and Forecast by Shape
11.8 Asia-Pacific Autonomous Underwater Vehicle (AUV) Market Size Estimation and Forecast by Technology
11.9 Asia-Pacific Autonomous Underwater Vehicle (AUV) Market Size Estimation and Forecast by Application
11.10 China Autonomous Underwater Vehicle (AUV) Market Analysis
11.11 India Autonomous Underwater Vehicle (AUV) Market Analysis
11.12 Japan Autonomous Underwater Vehicle (AUV) Market Analysis
11.13 South Korea Autonomous Underwater Vehicle (AUV) Market Analysis
11.14 Australia Autonomous Underwater Vehicle (AUV) Market Analysis
11.15 Rest of Asia-Pacific Autonomous Underwater Vehicle (AUV) Market Analysis
12 Middle East and Africa Autonomous Underwater Vehicle (AUV) Market Analysis
12.1 Key Findings
12.2 Middle East and Africa Autonomous Underwater Vehicle (AUV) Market Attractiveness Index
12.3 Middle East and Africa Autonomous Underwater Vehicle (AUV) Market by Country, 2023, 2028 & 2033 (US$ Million)
12.4 Middle East and Africa Autonomous Underwater Vehicle (AUV) Market Size Estimation and Forecast
12.5 Middle East and Africa Autonomous Underwater Vehicle (AUV) Market Size Estimation and Forecast by Country
12.6 Middle East and Africa Autonomous Underwater Vehicle (AUV) Market Size Estimation and Forecast by Type
12.7 Middle East and Africa Autonomous Underwater Vehicle (AUV) Market Size Estimation and Forecast by Shape
12.8 Middle East and Africa Autonomous Underwater Vehicle (AUV) Market Size Estimation and Forecast by Technology
12.9 Middle East and Africa Autonomous Underwater Vehicle (AUV) Market Size Estimation and Forecast by Application
12.10 GCC Autonomous Underwater Vehicle (AUV) Market Analysis
12.11 South Africa Autonomous Underwater Vehicle (AUV) Market Analysis
12.12 Rest of Middle East & Africa Autonomous Underwater Vehicle (AUV) Market Analysis
13 Latin America Autonomous Underwater Vehicle (AUV) Market Analysis
13.1 Key Findings
13.2 Latin America Autonomous Underwater Vehicle (AUV) Market Attractiveness Index
13.3 Latin America Autonomous Underwater Vehicle (AUV) Market by Country, 2023, 2028 & 2033 (US$ Million)
13.4 Latin America Autonomous Underwater Vehicle (AUV) Market Size Estimation and Forecast
13.5 Latin America Autonomous Underwater Vehicle (AUV) Market Size Estimation and Forecast by Country
13.6 Latin America Autonomous Underwater Vehicle (AUV) Market Size Estimation and Forecast by Type
13.7 Latin America Autonomous Underwater Vehicle (AUV) Market Size Estimation and Forecast by Shape
13.8 Latin America Autonomous Underwater Vehicle (AUV) Market Size Estimation and Forecast by Technology
13.9 Latin America Autonomous Underwater Vehicle (AUV) Market Size Estimation and Forecast by Application
13.10 Brazil Autonomous Underwater Vehicle (AUV) Market Analysis
13.11 Mexico Autonomous Underwater Vehicle (AUV) Market Analysis
13.12 Rest of Latin America Autonomous Underwater Vehicle (AUV) Market Analysis
14 Company Profiles
14.1 Competitive Landscape, 2022
14.2 Strategic Outlook
14.3 Kongsberg Gruppen
14.3.1 Company Snapshot
14.3.2 Company Overview
14.3.3 Financial Analysis
14.3.3.1 Net Revenue, 2018-2022
14.3.3.2 Business Segment Revenue Share, 2022 (%)
14.3.4 Product Benchmarking
14.3.5 Strategic Outlook
14.4 Teledyne Technologies Incorporated
14.4.1 Company Snapshot
14.4.2 Company Overview
14.4.3 Financial Analysis
14.4.3.1 Net Revenue, 2018-2022
14.4.3.2 Business Segment Revenue Share, 2022 (%)
14.4.4 Product Benchmarking
14.4.5 Strategic Outlook
14.5 General Dynamics Mission Systems
14.5.1 Company Snapshot
14.5.2 Company Overview
14.5.3 Financial Analysis
14.5.3.1 Net Revenue, 2018-2022
14.5.3.2 R&D, 2018-2022
14.5.3.3 Regional Revenue Share, 2022 (%)
14.5.3.4 Business Segment Revenue Share, 2022 (%)
14.5.4 Product Benchmarking
14.5.5 Strategic Outlook
14.6 Saab AB
14.6.1 Company Snapshot
14.6.2 Company Overview
14.6.3 Financial Analysis
14.6.3.1 Net Revenue, 2018-2022
14.6.3.2 R&D, 2018-2022
14.6.3.3 Regional Revenue Share, 2022 (%)
14.6.3.4 Business Segment Revenue Share, 2022 (%)
14.6.4 Product Benchmarking
14.6.5 Strategic Outlook
14.7 ECA Group
14.7.1 Company Snapshot
14.7.2 Company Overview
14.7.3 Product Benchmarking
14.7.4 Strategic Outlook
14.8 Bluefin Robotics
14.8.1 Company Snapshot
14.8.2 Company Overview
14.8.3 Financial Analysis
14.8.3.1 Net Revenue, 2018-2022
14.8.3.2 R&D, 2018-2022
14.8.3.3 Regional Revenue Share, 2022 (%)
14.8.3.4 Business Segment Revenue Share, 2022 (%)
14.8.4 Product Benchmarking
14.8.5 Strategic Outlook
14.9 Lockheed Martin Corporation
14.9.1 Company Snapshot
14.9.2 Company Overview
14.9.3 Financial Analysis
14.9.3.1 Net Revenue, 2018-2022
14.9.3.2 R&D, 2018-2022
14.9.3.3 Regional Revenue Share, 2022 (%)
14.9.3.4 Business Segment Revenue Share, 2022 (%)
14.9.4 Product Benchmarking
14.10 L3Harris Technologies Inc
14.10.1 Company Snapshot
14.10.2 Company Overview
14.10.3 Financial Analysis
14.10.3.1 Net Revenue, 2018-2022
14.10.3.2 Regional Revenue Share, 2022 (%)
14.10.3.3 Business Segment Revenue Share, 2022 (%)
14.10.4 Product Benchmarking
14.10.5 Strategic Outlook
14.11 Fugro
14.11.1 Company Snapshot
14.11.2 Company Overview
14.11.3 Financial Analysis
14.11.3.1 Net Revenue, 2018-2022
14.11.3.2 R&D, 2018-2022
14.11.3.3 Regional Revenue Share, 2022 (%)
14.11.3.4 Business Segment Revenue Share, 2022 (%)
14.11.4 Product Benchmarking
14.11.5 Strategic Outlook
14.12 Boston Engineering Corporation
14.12.1 Company Snapshot
14.12.2 Company Overview
14.12.3 Product Benchmarking
14.13 Oceaneering International, Inc.
14.13.1 Company Snapshot
14.13.2 Company Overview
14.13.3 Financial Analysis
14.13.3.1 Net Revenue, 2018-2022
14.13.4 Product Benchmarking
14.13.5 Strategic Outlook
14.14 Hydromea
14.14.1 Company Snapshot
14.14.2 Company Overview
14.14.3 Product Benchmarking
14.14.4 Strategic Outlook
14.15 Liquid Robotics
14.15.1 Company Snapshot
14.15.2 Company Overview
14.15.3 Financial Analysis
14.15.3.1 Net Revenue, 2018-2022
14.15.3.2 R&D, 2018-2022
14.15.3.3 Regional Revenue Share, 2022 (%)
14.15.3.4 Business Segment Revenue Share, 2022 (%)
14.15.4 Product Benchmarking
14.15.5 Strategic Outlook
14.16 L3 OceanServer
14.16.1 Company Snapshot
14.16.2 Company Overview
14.16.3 Financial Analysis
14.16.3.1 Net Revenue, 2018-2022
14.16.3.2 Regional Revenue Share, 2022 (%)
14.16.3.3 Business Segment Revenue Share, 2022 (%)
14.16.4 Product Benchmarking
14.16.5 Strategic Outlook
14.17 Riptide Autonomous Solutions
14.17.1 Company Snapshot
14.17.2 Company Overview
14.17.3 Product Benchmarking
15 Conclusion and Recommendations
15.1 Concluding Remarks from Visiongain
15.2 Recommendations for Market Players
List of Tables
Table 1 Autonomous Underwater Vehicle (AUV) Market Snapshot, 2023 & 2033 (US$ Million, CAGR %)
Table 2 Crude Oil Production Worldwide, Thousand toe, 2021
Table 3 Natural gas production worldwide in 2021, by country, (in billion cubic meters)
Table 4 Autonomous Underwater Vehicle (AUV) Market Forecast, 2023-2033 (US$ Mn, AGR (%), CAGR (%)) (V-Shaped Recovery Scenario)
Table 5 Autonomous Underwater Vehicle (AUV) Market by Region, 2023-2033 (US$ Mn, AGR (%), CAGR (%)) (V-Shaped Recovery Scenario)
Table 6 Autonomous Underwater Vehicle (AUV) Market Forecast, 2023-2033 (US$ Mn, AGR (%), CAGR (%)) (U-Shaped Recovery Scenario)
Table 7 Autonomous Underwater Vehicle (AUV) Market by Region, 2023-2033 (US$ Mn, AGR (%), CAGR (%)) (U-Shaped Recovery Scenario)
Table 8 Autonomous Underwater Vehicle (AUV) Market Forecast, 2023-2033 (US$ Mn, AGR (%), CAGR (%)) (W-Shaped Recovery Scenario)
Table 9 Autonomous Underwater Vehicle (AUV) Market by Region, 2023-2033 (US$ Mn, AGR (%), CAGR (%)) (W-Shaped Recovery Scenario)
Table 10 Autonomous Underwater Vehicle (AUV) Market Forecast, 2023-2033 (US$ Mn, AGR (%), CAGR (%)) (L-Shaped Recovery Scenario)
Table 11 Autonomous Underwater Vehicle (AUV) Market by Region, 2023-2033 (US$ Mn, AGR (%), CAGR (%)) (L-Shaped Recovery Scenario)
Table 12 Autonomous Underwater Vehicle (AUV) Market by Type, 2023-2033 (US$ Mn, AGR (%), CAGR (%))
Table 13 Shallow AUVs (up to 100 m) Market by Region, 2023-2033 (US$ Mn, AGR (%), CAGR (%))
Table 14 Medium AUVs (up to 1,000m) Market by Region, 2023-2033 (US$ Mn, AGR (%), CAGR (%))
Table 15 Large AUVs (more than 1,000m) Market by Region, 2023-2033 (US$ Mn, AGR (%), CAGR (%))
Table 16 Autonomous Underwater Vehicle (AUV) Market by Shape, 2023-2033 (US$ Mn, AGR (%), CAGR (%))
Table 17 Torpedo Market by Region, 2023-2033 (US$ Mn, AGR (%), CAGR (%))
Table 18 Laminar Flow Body Market by Region, 2023-2033 (US$ Mn, AGR (%), CAGR (%))
Table 19 Streamlined Rectangular Style Market by Region, 2023-2033 (US$ Mn, AGR (%), CAGR (%))
Table 20 Multi-hull Vehicle Market by Region, 2023-2033 (US$ Mn, AGR (%), CAGR (%))
Table 21 Autonomous Underwater Vehicle (AUV) Market by Technology, 2023-2033 (US$ Mn, AGR (%), CAGR (%))
Table 22 Collision Avoidance Market by Region, 2023-2033 (US$ Mn, AGR (%), CAGR (%))
Table 23 Communication Market by Region, 2023-2033 (US$ Mn, AGR (%), CAGR (%))
Table 24 Navigation Market by Region, 2023-2033 (US$ Mn, AGR (%), CAGR (%))
Table 25 Propulsion Market by Region, 2023-2033 (US$ Mn, AGR (%), CAGR (%))
Table 26 Imaging Market by Region, 2023-2033 (US$ Mn, AGR (%), CAGR (%))
Table 27 Autonomous Underwater Vehicle (AUV) Market by Application, 2023-2033 (US$ Mn, AGR (%), CAGR (%))
Table 28 Military & Defence Market by Region, 2023-2033 (US$ Mn, AGR (%), CAGR (%))
Table 29 Oil & Gas Market by Region, 2023-2033 (US$ Mn, AGR (%), CAGR (%))
Table 30 Environment Protection & Monitoring Market by Region, 2023-2033 (US$ Mn, AGR (%), CAGR (%))
Table 31 Oceanography Market by Region, 2023-2033 (US$ Mn, AGR (%), CAGR (%))
Table 32 Archeology & Exploration Market by Region, 2023-2033 (US$ Mn, AGR (%), CAGR (%))
Table 33 Search & Salvage Operations Market by Region, 2023-2033 (US$ Mn, AGR (%), CAGR (%))
Table 34 Autonomous Underwater Vehicle (AUV) Market Forecast by Region, 2023-2033 (US$ Million, AGR%, CAGR%)
Table 35 North America Autonomous Underwater Vehicle (AUV) Market by Value, 2023-2033 (US$ Mn, AGR (%), CAGR (%))
Table 36 North America Autonomous Underwater Vehicle (AUV) Market by Country, 2023-2033 (US$ Mn, AGR (%), CAGR (%))
Table 37 North America Autonomous Underwater Vehicle (AUV) Market by Type, 2023-2033 (US$ Mn, AGR (%), CAGR (%))
Table 38 North America Autonomous Underwater Vehicle (AUV) Market by Shape, 2023-2033 (US$ Mn, AGR (%), CAGR (%))
Table 39 North America Autonomous Underwater Vehicle (AUV) Market by Technology, 2023-2033 (US$ Mn, AGR (%), CAGR (%))
Table 40 North America Autonomous Underwater Vehicle (AUV) Market by Application, 2023-2033 (US$ Mn, AGR (%), CAGR (%))
Table 41 US Autonomous Underwater Vehicle (AUV) Market by Value, 2023-2033 (US$ Mn, AGR (%), CAGR (%))
Table 42 Canada Autonomous Underwater Vehicle (AUV) Market by Value, 2023-2033 (US$ Mn, AGR (%), CAGR (%))
Table 43 Europe Autonomous Underwater Vehicle (AUV) Market by Value, 2023-2033 (US$ Mn, AGR (%), CAGR (%))
Table 44 Europe Autonomous Underwater Vehicle (AUV) Market by Country, 2023-2033 (US$ Mn, AGR (%), CAGR (%))
Table 45 Europe Autonomous Underwater Vehicle (AUV) Market by Type, 2023-2033 (US$ Mn, AGR (%), CAGR (%))
Table 46 Europe Autonomous Underwater Vehicle (AUV) Market by Shape, 2023-2033 (US$ Mn, AGR (%), CAGR (%))
Table 47 Europe Autonomous Underwater Vehicle (AUV) Market by Technology, 2023-2033 (US$ Mn, AGR (%), CAGR (%))
Table 48 Europe Autonomous Underwater Vehicle (AUV) Market by Application, 2023-2033 (US$ Mn, AGR (%), CAGR (%))
Table 49 Germany Autonomous Underwater Vehicle (AUV) Market by Value, 2023-2033 (US$ Mn, AGR (%), CAGR (%))
Table 50 UK Autonomous Underwater Vehicle (AUV) Market by Value, 2023-2033 (US$ Mn, AGR (%), CAGR (%))
Table 51 France Autonomous Underwater Vehicle (AUV) Market by Value, 2023-2033 (US$ Mn, AGR (%), CAGR (%))
Table 52 Italy Autonomous Underwater Vehicle (AUV) Market by Value, 2023-2033 (US$ Mn, AGR (%), CAGR (%))
Table 53 Russia Autonomous Underwater Vehicle (AUV) Market by Value, 2023-2033 (US$ Mn, AGR (%), CAGR (%))
Table 54 Rest of Europe Autonomous Underwater Vehicle (AUV) Market by Value, 2023-2033 (US$ Mn, AGR (%), CAGR (%))
Table 55 Asia-Pacific Autonomous Underwater Vehicle (AUV) Market by Value, 2023-2033 (US$ Mn, AGR (%), CAGR (%))
Table 56 Asia-Pacific Autonomous Underwater Vehicle (AUV) Market by Country, 2023-2033 (US$ Mn, AGR (%), CAGR (%))
Table 57 Asia-Pacific Autonomous Underwater Vehicle (AUV) Market by Type, 2023-2033 (US$ Mn, AGR (%), CAGR (%))
Table 58 Asia-Pacific Autonomous Underwater Vehicle (AUV) Market by Shape, 2023-2033 (US$ Mn, AGR (%), CAGR (%))
Table 59 Asia-Pacific Autonomous Underwater Vehicle (AUV) Market by Technology, 2023-2033 (US$ Mn, AGR (%), CAGR (%))
Table 60 Asia-Pacific Autonomous Underwater Vehicle (AUV) Market by Application, 2023-2033 (US$ Mn, AGR (%), CAGR (%))
Table 61 China Autonomous Underwater Vehicle (AUV) Market by Value, 2023-2033 (US$ Mn, AGR (%), CAGR (%))
Table 62 India Autonomous Underwater Vehicle (AUV) Market by Value, 2023-2033 (US$ Mn, AGR (%), CAGR (%))
Table 63 Japan Autonomous Underwater Vehicle (AUV) Market by Value, 2023-2033 (US$ Mn, AGR (%), CAGR (%))
Table 64 South Korea Autonomous Underwater Vehicle (AUV) Market by Value, 2023-2033 (US$ Mn, AGR (%), CAGR (%))
Table 65 Australia Autonomous Underwater Vehicle (AUV) Market by Value, 2023-2033 (US$ Mn, AGR (%), CAGR (%))
Table 66 Rest of Asia-Pacific Autonomous Underwater Vehicle (AUV) Market by Value, 2023-2033 (US$ Mn, AGR (%), CAGR (%))
Table 67 Middle East & Africa Autonomous Underwater Vehicle (AUV) Market by Value, 2023-2033 (US$ Mn, AGR (%), CAGR (%))
Table 68 Middle East & Africa Autonomous Underwater Vehicle (AUV) Market by Country, 2023-2033 (US$ Mn, AGR (%), CAGR (%))
Table 69 Middle East & Africa Autonomous Underwater Vehicle (AUV) Market by Type, 2023-2033 (US$ Mn, AGR (%), CAGR (%))
Table 70 Middle East & Africa Autonomous Underwater Vehicle (AUV) Market by Shape, 2023-2033 (US$ Mn, AGR (%), CAGR (%))
Table 71 Middle East & Africa Autonomous Underwater Vehicle (AUV) Market by Technology, 2023-2033 (US$ Mn, AGR (%), CAGR (%))
Table 72 Middle East & Africa Autonomous Underwater Vehicle (AUV) Market by Application, 2023-2033 (US$ Mn, AGR (%), CAGR (%))
Table 73 GCC Autonomous Underwater Vehicle (AUV) Market by Value, 2023-2033 (US$ Mn, AGR (%), CAGR (%))
Table 74 South Africa Autonomous Underwater Vehicle (AUV) Market by Value, 2023-2033 (US$ Mn, AGR (%), CAGR (%))
Table 75 Rest of Middle East & Africa Autonomous Underwater Vehicle (AUV) Market by Value, 2023-2033 (US$ Mn, AGR (%), CAGR (%))
Table 76 Latin America Autonomous Underwater Vehicle (AUV) Market by Value, 2023-2033 (US$ Mn, AGR (%), CAGR (%))
Table 77 Latin America Autonomous Underwater Vehicle (AUV) Market by Country, 2023-2033 (US$ Mn, AGR (%), CAGR (%))
Table 78 Latin America Autonomous Underwater Vehicle (AUV) Market by Type, 2023-2033 (US$ Mn, AGR (%), CAGR (%))
Table 79 Latin America Autonomous Underwater Vehicle (AUV) Market by Shape, 2023-2033 (US$ Mn, AGR (%), CAGR (%))
Table 80 Latin America Autonomous Underwater Vehicle (AUV) Market by Technology, 2023-2033 (US$ Mn, AGR (%), CAGR (%))
Table 81 Latin America Autonomous Underwater Vehicle (AUV) Market by Application, 2023-2033 (US$ Mn, AGR (%), CAGR (%))
Table 82 Brazil Autonomous Underwater Vehicle (AUV) Market by Value, 2023-2033 (US$ Mn, AGR (%), CAGR (%))
Table 83 Mexico Autonomous Underwater Vehicle (AUV) Market by Value, 2023-2033 (US$ Mn, AGR (%), CAGR (%))
Table 84 Rest of Latin America Autonomous Underwater Vehicle (AUV) Market by Value, 2023-2033 (US$ Mn, AGR (%), CAGR (%))
Table 85 Strategic Outlook - Contract
Table 86 Kongsberg Gruppen Key Details, (CEO, HQ, Revenue, Founded, No. of Employees, Company Type, Website, Business Segment)
Table 87 Kongsberg Gruppen: Product Benchmarking
Table 88 Kongsberg Gruppen: Strategic Outlook
Table 89 Teledyne Technologies Incorporated Key Details, (CEO, HQ, Revenue, Founded, No. of Employees, Company Type, Website, Business Segment)
Table 90 Teledyne Technologies Incorporated: Product Benchmarking
Table 91 Teledyne Technologies Incorporated: Strategic Outlook
Table 92 General Dynamics Mission Systems: Key Details, (CEO, HQ, Revenue, Founded, No. of Employees, Company Type, Website, Business Segment)
Table 93 General Dynamics Mission Systems: Product Benchmarking
Table 94 General Dynamics Mission Systems: Strategic Outlook
Table 95 Saab AB Key Details, (CEO, HQ, Revenue, Founded, No. of Employees, Company Type, Website, Business Segment)
Table 96 Saab AB: Product Benchmarking
Table 97 Saab AB: Strategic Outlook
Table 98 ECA Group: Key Details, (CEO, HQ, Revenue, Founded, No. of Employees, Company Type, Website, Business Segment)
Table 99 ECA Group: Product Benchmarking
Table 100 ECA Group: Strategic Outlook
Table 101 Bluefin Robotics: Key Details, (CEO, HQ, Revenue, Founded, No. of Employees, Company Type, Website, Business Segment)
Table 102 Bluefin Robotics: Product Benchmarking
Table 103 Bluefin Robotics: Strategic Outlook
Table 104 Lockheed Martin Corporation: Key Details, (CEO, HQ, Revenue, Founded, No. of Employees, Company Type, Website, Business Segment)
Table 105 Lockheed Martin Corporation: Product Benchmarking
Table 106 L3Harris Technologies Inc Key Details, (CEO, HQ, Revenue, Founded, No. of Employees, Company Type, Website, Business Segment)
Table 107 L3Harris Technologies Inc: Product Benchmarking
Table 108 L3Harris Technologies Inc: Strategic Outlook
Table 109 Fugro: Key Details, (CEO, HQ, Revenue, Founded, No. of Employees, Company Type, Website, Business Segment)
Table 110 Fugro: Product Benchmarking
Table 111 Fugro: Strategic Outlook
Table 112 Boston Engineering Corporation: Key Details, (CEO, HQ, Revenue, Founded, No. of Employees, Company Type, Website, Business Segment)
Table 113 Boston Engineering Corporation: Product Benchmarking
Table 114 Oceaneering International, Inc:. Key Details, (CEO, HQ, Revenue, Founded, No. of Employees, Company Type, Website, Business Segment)
Table 115 Oceaneering International, Inc.: Product Benchmarking
Table 116 Oceaneering International, Inc.: Strategic Outlook
Table 117 Hydromea: Key Details, (CEO, HQ, Revenue, Founded, No. of Employees, Company Type, Website, Business Segment)
Table 118 Hydromea: Product Benchmarking
Table 119 Hydromea: Strategic Outlook
Table 120 Liquid Robotics Key Details, (CEO, HQ, Revenue, Founded, No. of Employees, Company Type, Website, Business Segment)
Table 121 Liquid Robotics: Product Benchmarking
Table 122 Liquid Robotics: Strategic Outlook
Table 123 L3 OceanServer :Key Details, (CEO, HQ, Revenue, Founded, No. of Employees, Company Type, Website, Business Segment)
Table 124 L3 Ocean Server: Product Benchmarking
Table 125 L3 Ocean Server: Strategic Outlook
Table 126 Riptide Autonomous Solutions Key Details, (CEO, HQ, Revenue, Founded, No. of Employees, Company Type, Website, Business Segment)
Table 127 Riptide Autonomous Solutions: Product Benchmarking
List of Figures
Figure 1 Autonomous Underwater Vehicle (AUV) Market Segmentation
Figure 2 Autonomous Underwater Vehicle (AUV) Market by Type: Market Attractiveness Index
Figure 3 Autonomous Underwater Vehicle (AUV) Market by Shape: Market Attractiveness Index
Figure 4 Autonomous Underwater Vehicle (AUV) Market by Technology: Market Attractiveness Index
Figure 5 Autonomous Underwater Vehicle (AUV) Market by Application: Market Attractiveness Index
Figure 6 Autonomous Underwater Vehicle (AUV) Market Attractiveness Index by Region
Figure 7 Global Autonomous Underwater Vehicle Market: Market Dynamics
Figure 8 Global Autonomous Underwater Vehicle Market: Porter’s Five Forces Analysis
Figure 9 Autonomous Underwater Vehicle (AUV) Market Forecast by COVID, 2023-2033 (%)
Figure 10 Autonomous Underwater Vehicle (AUV) Market Forecast, 2023-2033 (US$ Mn, AGR (%)) (V-Shaped Recovery Scenario)
Figure 11 Autonomous Underwater Vehicle (AUV) Market by Region, 2023-2033 (US$ Mn, AGR (%)) (V-Shaped Recovery Scenario)
Figure 12 Autonomous Underwater Vehicle (AUV) Market Forecast, 2023-2033 (US$ Mn, AGR (%)) (U-Shaped Recovery Scenario)
Figure 13 Autonomous Underwater Vehicle (AUV) Market by Region, 2023-2033 (US$ Mn, AGR (%)) (U-Shaped Recovery Scenario)
Figure 14 Autonomous Underwater Vehicle (AUV) Market Forecast, 2023-2033 (US$ Mn, AGR (%)) (W-Shaped Recovery Scenario)
Figure 15 Autonomous Underwater Vehicle (AUV) Market by Region, 2023-2033 (US$ Mn, AGR (%)) (W-Shaped Recovery Scenario)
Figure 16 Autonomous Underwater Vehicle (AUV) Market Forecast, 2023-2033 (US$ Mn, AGR (%)) (L-Shaped Recovery Scenario)
Figure 17 Autonomous Underwater Vehicle (AUV) Market by Region, 2023-2033 (US$ Mn, AGR (%)) (L-Shaped Recovery Scenario)
Figure 18 Global Autonomous Underwater Vehicle Market: PEST Analysis
Figure 19 Autonomous Underwater Vehicle (AUV) Market by Type: Market Attractiveness Index
Figure 20 Autonomous Underwater Vehicle (AUV) Market by Type, 2023-2033 (US$ Mn, AGR (%))
Figure 21 Autonomous Underwater Vehicle (AUV) Market Share Forecast by Type, 2023, 2028, 2033 (%)
Figure 22 Shallow AUVs (up to 100 m) Market by Region, 2023-2033 (US$ Mn, AGR (%))
Figure 23 Shallow AUVs (up to 100 m) Market Share Forecast by Region, 2023 & 2033 (%)
Figure 24 Medium AUVs (up to 1,000m) Market by Region, 2023-2033 (US$ Mn, AGR (%))
Figure 25 Medium AUVs (up to 1,000m) Market Share Forecast by Region, 2023 & 2033 (%)
Figure 26 Large AUVs (more than 1,000m) Market by Region, 2023-2033 (US$ Mn, AGR (%))
Figure 27 Large AUVs (more than 1,000m) Market Share Forecast by Region, 2023 & 2033 (%)
Figure 28 Autonomous Underwater Vehicle (AUV) Market by Shape: Market Attractiveness Index
Figure 29 Autonomous Underwater Vehicle (AUV) Market by Shape, 2023-2033 (US$ Mn, AGR (%))
Figure 30 Autonomous Underwater Vehicle (AUV) Market Share Forecast by Shape, 2023, 2028, 2033 (%)
Figure 31 Torpedo Market by Region, 2023-2033 (US$ Mn, AGR (%))
Figure 32 Torpedo Market Share Forecast by Region, 2023 & 2033 (%)
Figure 33 Laminar Flow Body Market by Region, 2023-2033 (US$ Mn, AGR (%))
Figure 34 Laminar Flow Body Market Share Forecast by Region, 2023 & 2033 (%)
Figure 35 Streamlined Rectangular Style Market by Region, 2023-2033 (US$ Mn, AGR (%))
Figure 36 Streamlined Rectangular Style Market Share Forecast by Region, 2023 & 2033 (%)
Figure 37 Multi-hull Vehicle Market by Region, 2023-2033 (US$ Mn, AGR (%))
Figure 38 Multi-Hull Vehicle Market Share Forecast by Region, 2023 & 2033 (%)
Figure 39 Autonomous Underwater Vehicle (AUV) Market by Technology: Market Attractiveness Index
Figure 40 Autonomous Underwater Vehicle (AUV) Market by Technology, 2023-2033 (US$ Mn, AGR (%))
Figure 41 Autonomous Underwater Vehicle (AUV) Market Share Forecast by Technology, 2023, 2028, 2033 (%)
Figure 42 Collision Avoidance Market by Region, 2023-2033 (US$ Mn, AGR (%))
Figure 43 Collision Avoidance Market Share Forecast by Region, 2023 & 2033 (%)
Figure 44 Communication Market by Region, 2023-2033 (US$ Mn, AGR (%))
Figure 45 Communication Market Share Forecast by Region, 2023 & 2033 (%)
Figure 46 Navigation Market by Region, 2023-2033 (US$ Mn, AGR (%))
Figure 47 Navigation Market Share Forecast by Region, 2023 & 2033 (%)
Figure 48 Propulsion Market by Region, 2023-2033 (US$ Mn, AGR (%))
Figure 49 Propulsion Market Share Forecast by Region, 2023 & 2033 (%)
Figure 50 Imaging Market by Region, 2023-2033 (US$ Mn, AGR (%))
Figure 51 Imaging Market Share Forecast by Region, 2023 & 2033 (%)
Figure 52 Autonomous Underwater Vehicle (AUV) Market by Application: Market Attractiveness Index
Figure 53 Autonomous Underwater Vehicle (AUV) Market by Application, 2023-2033 (US$ Mn, AGR (%))
Figure 54 Autonomous Underwater Vehicle (AUV) Market Share Forecast by Application, 2023, 2028, 2033 (%)
Figure 55 Military & Defence Market by Region, 2023-2033 (US$ Mn, AGR (%))
Figure 56 Military & Defence Market Share Forecast by Region, 2023 & 2033 (%)
Figure 57 Oil & Gas Market by Region, 2023-2033 (US$ Mn, AGR (%))
Figure 58 Oil & Gas Market Share Forecast by Region, 2023 & 2033 (%)
Figure 59 Environment Protection & Monitoring Market by Region, 2023-2033 (US$ Mn, AGR (%))
Figure 60 Environment Protection & Monitoring Market Share Forecast by Region, 2023 & 2033 (%)
Figure 61 Oceanography Market by Region, 2023-2033 (US$ Mn, AGR (%))
Figure 62 Oceanography Market Share Forecast by Region, 2023 & 2033 (%)
Figure 63 Archeology & Exploration Market by Region, 2023-2033 (US$ Mn, AGR (%))
Figure 64 Archeology & Exploration Market Share Forecast by Region, 2023 & 2033 (%)
Figure 65 Search & Salvage Operations Market by Region, 2023-2033 (US$ Mn, AGR (%))
Figure 66 Search & Salvage Operations Market Share Forecast by Region, 2023 & 2033 (%)
Figure 67 Autonomous Underwater Vehicle (AUV) Market Forecast by Region 2023 and 2033 (Revenue, CAGR%)
Figure 68 Autonomous Underwater Vehicle (AUV) Market Share Forecast by Region 2023, 2028, 2033 (%)
Figure 69 Autonomous Underwater Vehicle (AUV) Market by Region, 2023-2033 (US$ Million, AGR %)
Figure 70 North America Autonomous Underwater Vehicle (AUV) Market Attractiveness Index
Figure 71 North America Autonomous Underwater Vehicle (AUV) Market by Region, 2023, 2028 & 2033 (US$ Million)
Figure 72 North America Autonomous Underwater Vehicle (AUV) Market by Value, 2023-2033 (US$ Mn, AGR (%))
Figure 73 North America Autonomous Underwater Vehicle (AUV) Market by Country, 2023-2033 (US$ Mn, AGR (%))
Figure 74 North America Autonomous Underwater Vehicle (AUV) Market Share Forecast by Country, 2023 & 2033 (%)
Figure 75 North America Autonomous Underwater Vehicle (AUV) Market by Type, 2023-2033 (US$ Mn, AGR (%))
Figure 76 North America Autonomous Underwater Vehicle (AUV) Market Share Forecast Type, 2023 & 2033 (%)
Figure 77 North America Autonomous Underwater Vehicle (AUV) Market by Shape, 2023-2033 (US$ Mn, AGR (%))
Figure 78 North America Autonomous Underwater Vehicle (AUV) Market Share Forecast by Shape, 2023 & 2033 (%)
Figure 79 North America Autonomous Underwater Vehicle (AUV) Market by Technology, 2023-2033 (US$ Mn, AGR (%))
Figure 80 North America Autonomous Underwater Vehicle (AUV) Market Share Forecast by Technology, 2023 & 2033 (%)
Figure 81 North America Autonomous Underwater Vehicle (AUV) Market by Application, 2023-2033 (US$ Mn, AGR (%))
Figure 82 North America Autonomous Underwater Vehicle (AUV) Market Share Forecast by Application, 2023 & 2033 (%)
Figure 83 US Autonomous Underwater Vehicle (AUV) Market by Value, 2023-2033 (US$ Mn, AGR (%))
Figure 84 Canada Autonomous Underwater Vehicle (AUV) Market by Value, 2023-2033 (US$ Mn, AGR (%))
Figure 85 Europe Autonomous Underwater Vehicle (AUV) Market Attractiveness Index
Figure 86 Europe Autonomous Underwater Vehicle (AUV) Market by Region, 2023, 2028 & 2033 (US$ Million)
Figure 87 Europe Autonomous Underwater Vehicle (AUV) Market by Value, 2023-2033 (US$ Mn, AGR (%))
Figure 88 Europe Autonomous Underwater Vehicle (AUV) Market by Country, 2023-2033 (US$ Mn, AGR (%))
Figure 89 Europe Autonomous Underwater Vehicle (AUV) Market Share Forecast by Country, 2023 & 2033 (%)
Figure 90 Europe Autonomous Underwater Vehicle (AUV) Market by Type, 2023-2033 (US$ Mn, AGR (%))
Figure 91 Europe Autonomous Underwater Vehicle (AUV) Market Share Forecast Type, 2023 & 2033 (%)
Figure 92 Europe Autonomous Underwater Vehicle (AUV) Market by Shape, 2023-2033 (US$ Mn, AGR (%))
Figure 93 Europe Autonomous Underwater Vehicle (AUV) Market Share Forecast by Shape, 2023 & 2033 (%)
Figure 94 Europe Autonomous Underwater Vehicle (AUV) Market by Technology, 2023-2033 (US$ Mn, AGR (%))
Figure 95 Europe Autonomous Underwater Vehicle (AUV) Market Share Forecast by Technology, 2023 & 2033 (%)
Figure 96 Europe Autonomous Underwater Vehicle (AUV) Market by Application, 2023-2033 (US$ Mn, AGR (%))
Figure 97 Europe Autonomous Underwater Vehicle (AUV) Market Share Forecast by Application, 2023 & 2033 (%)
Figure 98 Germany Autonomous Underwater Vehicle (AUV) Market by Value, 2023-2033 (US$ Mn, AGR (%))
Figure 99 UK Autonomous Underwater Vehicle (AUV) Market by Value, 2023-2033 (US$ Mn, AGR (%))
Figure 100 France Autonomous Underwater Vehicle (AUV) Market by Value, 2023-2033 (US$ Mn, AGR (%))
Figure 101 Italy Autonomous Underwater Vehicle (AUV) Market by Value, 2023-2033 (US$ Mn, AGR (%))
Figure 102 Russia Autonomous Underwater Vehicle (AUV) Market by Value, 2023-2033 (US$ Mn, AGR (%))
Figure 103 Rest of Europe Autonomous Underwater Vehicle (AUV) Market by Value, 2023-2033 (US$ Mn, AGR (%))
Figure 104 Asia-Pacific Autonomous Underwater Vehicle (AUV) Market Attractiveness Index
Figure 105 Asia-Pacific Autonomous Underwater Vehicle (AUV) Market by Region, 2023, 2028 & 2033 (US$ Million)
Figure 106 Asia-Pacific Autonomous Underwater Vehicle (AUV) Market by Value, 2023-2033 (US$ Mn, AGR (%))
Figure 107 Asia-Pacific Autonomous Underwater Vehicle (AUV) Market by Country, 2023-2033 (US$ Mn, AGR (%))
Figure 108 Asia-Pacific Autonomous Underwater Vehicle (AUV) Market Share Forecast by Country, 2023 & 2033 (%)
Figure 109 Asia-Pacific Autonomous Underwater Vehicle (AUV) Market by Type, 2023-2033 (US$ Mn, AGR (%))
Figure 110 Asia-Pacific Autonomous Underwater Vehicle (AUV) Market Share Forecast Type, 2023 & 2033 (%)
Figure 111 Asia-Pacific Autonomous Underwater Vehicle (AUV) Market by Shape, 2023-2033 (US$ Mn, AGR (%))
Figure 112 Asia-Pacific Autonomous Underwater Vehicle (AUV) Market Share Forecast by Shape, 2023 & 2033 (%)
Figure 113 Asia-Pacific Autonomous Underwater Vehicle (AUV) Market by Technology, 2023-2033 (US$ Mn, AGR (%))
Figure 114 Asia-Pacific Autonomous Underwater Vehicle (AUV) Market Share Forecast by Technology, 2023 & 2033 (%)
Figure 115 Asia-Pacific Autonomous Underwater Vehicle (AUV) Market by Application, 2023-2033 (US$ Mn, AGR (%))
Figure 116 Asia-Pacific Autonomous Underwater Vehicle (AUV) Market Share Forecast by Application, 2023 & 2033 (%)
Figure 117 China Autonomous Underwater Vehicle (AUV) Market by Value, 2023-2033 (US$ Mn, AGR (%))
Figure 118 India Autonomous Underwater Vehicle (AUV) Market by Value, 2023-2033 (US$ Mn, AGR (%))
Figure 119 Japan Autonomous Underwater Vehicle (AUV) Market by Value, 2023-2033 (US$ Mn, AGR (%))
Figure 120 South Korea Autonomous Underwater Vehicle (AUV) Market by Value, 2023-2033 (US$ Mn, AGR (%))
Figure 121 Australia Autonomous Underwater Vehicle (AUV) Market by Value, 2023-2033 (US$ Mn, AGR (%))
Figure 122 Rest of Asia-Pacific Autonomous Underwater Vehicle (AUV) Market by Value, 2023-2033 (US$ Mn, AGR (%))
Figure 123 Middle East and Africa Autonomous Underwater Vehicle (AUV) Market Attractiveness Index
Figure 124 Middle East and Africa Autonomous Underwater Vehicle (AUV) Market by Region, 2023, 2028 & 2033 (US$ Million)
Figure 125 Middle East & Africa Autonomous Underwater Vehicle (AUV) Market by Value, 2023-2033 (US$ Mn, AGR (%))
Figure 126 Middle East & Africa Autonomous Underwater Vehicle (AUV) Market by Country, 2023-2033 (US$ Mn, AGR (%))
Figure 127 Middle East and Africa Autonomous Underwater Vehicle (AUV) Market Share Forecast by Country, 2023 & 2033 (%)
Figure 128 Middle East & Africa Autonomous Underwater Vehicle (AUV) Market by Type, 2023-2033 (US$ Mn, AGR (%))
Figure 129 Middle East and Africa Autonomous Underwater Vehicle (AUV) Market Share Forecast Type, 2023 & 2033 (%)
Figure 130 Middle East & Africa Autonomous Underwater Vehicle (AUV) Market by Shape, 2023-2033 (US$ Mn, AGR (%))
Figure 131 Middle East and Africa Autonomous Underwater Vehicle (AUV) Market Share Forecast by Shape, 2023 & 2033 (%)
Figure 132 Middle East & Africa Autonomous Underwater Vehicle (AUV) Market by Technology, 2023-2033 (US$ Mn, AGR (%))
Figure 133 Middle East and Africa Autonomous Underwater Vehicle (AUV) Market Share Forecast by Technology, 2023 & 2033 (%)
Figure 134 Middle East & Africa Autonomous Underwater Vehicle (AUV) Market by Application, 2023-2033 (US$ Mn, AGR (%))
Figure 135 Middle East and Africa Autonomous Underwater Vehicle (AUV) Market Share Forecast by Application, 2023 & 2033 (%)
Figure 136 GCC Autonomous Underwater Vehicle (AUV) Market by Value, 2023-2033 (US$ Mn, AGR (%))
Figure 137 South Africa Autonomous Underwater Vehicle (AUV) Market by Value, 2023-2033 (US$ Mn, AGR (%))
Figure 138 Rest of Middle East & Africa Autonomous Underwater Vehicle (AUV) Market by Value, 2023-2033 (US$ Mn, AGR (%))
Figure 139 Latin America Autonomous Underwater Vehicle (AUV) Market Attractiveness Index
Figure 140 Latin America Autonomous Underwater Vehicle (AUV) Market by Region, 2023, 2028 & 2033 (US$ Million)
Figure 141 Latin America Autonomous Underwater Vehicle (AUV) Market by Value, 2023-2033 (US$ Mn, AGR (%))
Figure 142 Latin America Autonomous Underwater Vehicle (AUV) Market by Country, 2023-2033 (US$ Mn, AGR (%))
Figure 143 Latin America Autonomous Underwater Vehicle (AUV) Market Share Forecast by Country, 2023 & 2033 (%)
Figure 144 Latin America Autonomous Underwater Vehicle (AUV) Market by Type, 2023-2033 (US$ Mn, AGR (%))
Figure 145 Latin America Autonomous Underwater Vehicle (AUV) Market Share Forecast Type, 2023 & 2033 (%)
Figure 146 Latin America Autonomous Underwater Vehicle (AUV) Market by Shape, 2023-2033 (US$ Mn, AGR (%))
Figure 147 Latin America Autonomous Underwater Vehicle (AUV) Market Share Forecast by Shape, 2023 & 2033 (%)
Figure 148 Latin America Autonomous Underwater Vehicle (AUV) Market by Technology, 2023-2033 (US$ Mn, AGR (%))
Figure 149 Latin America Autonomous Underwater Vehicle (AUV) Market Share Forecast by Technology, 2023 & 2033 (%)
Figure 150 Latin America Autonomous Underwater Vehicle (AUV) Market by Application, 2023-2033 (US$ Mn, AGR (%))
Figure 151 Latin America Autonomous Underwater Vehicle (AUV) Market Share Forecast by Application, 2023 & 2033 (%)
Figure 152 Brazil Autonomous Underwater Vehicle (AUV) Market by Value, 2023-2033 (US$ Mn, AGR (%))
Figure 153 Mexico Autonomous Underwater Vehicle (AUV) Market by Value, 2023-2033 (US$ Mn, AGR (%))
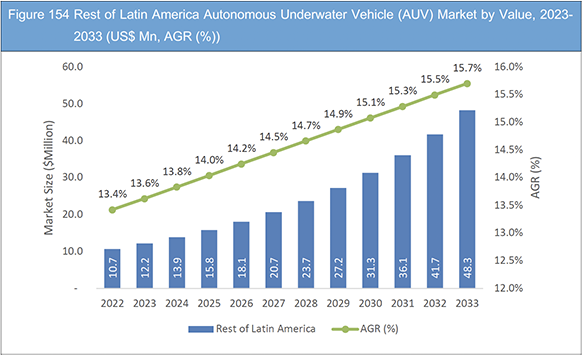
Figure 154 Rest of Latin America Autonomous Underwater Vehicle (AUV) Market by Value, 2023-2033 (US$ Mn, AGR (%))
Figure 155 Global Autonomous Underwater Vehicle Market: Company Share, 2022
Figure 156 Kongsberg Gruppen: Net Revenue, 2018-2022 (US$ Million, AGR%)
Figure 157 Kongsberg Gruppen: Business Segment Revenue Share, 2022 (%)
Figure 158 Teledyne Technologies Incorporated: Net Revenue, 2018-2022 (US$ Million, AGR%)
Figure 159 Teledyne Technologies Incorporated: Business Segment Revenue Share, 2022 (%)
Figure 160 General Dynamics Mission Systems: Net Revenue, 2018-2022 (US$ Million, AGR%)
Figure 161 General Dynamics Mission Systems: R&D, 2018-2022 (US$ Million, AGR%)
Figure 162 General Dynamics Mission Systems: Regional Revenue Share, 2022 (%)
Figure 163 General Dynamics Mission Systems: Business Segment Revenue Share, 2022 (%)
Figure 164 Saab AB: Net Revenue, 2018-2022 (US$ Million, AGR%)
Figure 165 Saab AB: R&D, 2018-2022 (US$ Million, AGR%)
Figure 166 Saab AB: Regional Revenue Share, 2022 (%)
Figure 167 Saab AB: Business Segment Revenue Share, 2022 (%)
Figure 168 Bluefin Robotics: Net Revenue, 2018-2022 (US$ Million, AGR%)
Figure 169 Bluefin Robotics: R&D, 2018-2022 (US$ Million, AGR%)
Figure 170 Bluefin Robotics: Regional Revenue Share, 2022 (%)
Figure 171 Bluefin Robotics: Business Segment Revenue Share, 2022 (%)
Figure 172 Lockheed Martin Corporation: Net Revenue, 2018-2022 (US$ Million, AGR%)
Figure 173 Lockheed Martin Corporation: R&D, 2018-2022 (US$ Million, AGR%)
Figure 174 Lockheed Martin Corporation: Regional Revenue Share, 2022 (%)
Figure 175 Lockheed Martin Corporation: Business Segment Revenue Share, 2022 (%)
Figure 176 L3Harris Technologies Inc: Net Revenue, 2018-2022 (US$ Million, AGR%)
Figure 177 L3Harris Technologies Inc: Regional Revenue Share, 2022 (%)
Figure 178 L3Harris Technologies Inc : Business Segment Revenue Share, 2022 (%)
Figure 179 Fugro: Net Revenue, 2018-2022 (US$ Million, AGR%)
Figure 180 Fugro: R&D, 2018-2022 (US$ Million, AGR%)
Figure 181 Fugro: Regional Revenue Share, 2022 (%)
Figure 182 Fugro: Business Segment Revenue Share, 2022 (%)
Figure 183 Oceaneering International, Inc.: Net Revenue, 2018-2022 (US$ Million, AGR%)
Figure 184 Liquid Robotics: Net Revenue, 2018-2022 (US$ Million, AGR%)
Figure 185 Liquid Robotics: R&D, 2018-2022 (US$ Million, AGR%)
Figure 186 Liquid Robotics: Regional Revenue Share, 2022 (%)
Figure 187 Liquid Robotics: Business Segment Revenue Share, 2022 (%)
Figure 188 L3 Ocean Server: Net Revenue, 2018-2022 (US$ Million, AGR%)
Figure 189 L3 Ocean Server: Regional Revenue Share, 2022 (%)
Figure 190 L3 Ocean Server: Business Segment Revenue Share, 2022 (%)
List of Companies Profiled in the report
Bluefin Robotics
Boston Engineering Corporation
ECA Group
Fugro
General Dynamics Mission Systems
Hydromea
Kongsberg Gruppen
L3 OceanServer
L3Harris Technologies Inc.
Liquid Robotics
Lockheed Martin Corporation
Oceaneering International, Inc.
Riptide Autonomous Solutions
Saab AB
Teledyne Technologies Incorporated
List of Other Companies Mentioned in the report
AeroVironment
Anduril Australia
ATLAS ELEKTRONIK UK (AEUK)
Bluefin Robotics
Boston Engineering Corporation
Chevron
China Shipbuilding Power Engineering Institute Co
CNBC
ECA Group
Equinor
Fugro
General Dynamics Mission Systems (GDMS)
HII(Huntington Ingalls Industries)
Hydromea
Hydropribor
Kawasaki Heavy Industries
Kongsberg Gruppen
L3 OceanServer
L3Harris Technologies
Larsen & Toubro (L&T)
Leidos
Liquid Robotics
Lockheed Martin Corporation
Martin Defence Group
Mitsubishi Heavy Industries (MHI)
Modus
Navantia
Northrop Grumman
Ocean Infinity
Oceaneering International, Inc
Oceaneering's Freedom
OceanServer
Perseo
Phase One
Riptide Autonomous Solutions
Saab AB
SAES
Sibiu
Sonardyne
Teledyne Technologies
The Italian Ministry of Defence (MoD)
TotalEnergies
List of Associations Mentioned in the Report
Defence Research and Development Organisation (DRDO)
Indian Ocean Region (IOR)
Japan Maritime Self-Defence Force (JMSDF)
NORAD
Republic of Korea Navy's (RoKN)
Royal Australian Navy
Snakehead Large Displacement Unmanned Undersea Vehicle (LDUUV)
South Korea's Agency for Defence Development (ADD)
South Korea's Defence Acquisition Program Administration (DAPA)
Teledyne Brown Engineering
The Australian Defence Force
The Canadian government's Remotely Piloted Aircraft System (RPAS)
The European Defence Agency
The French Navy
The Indian Navy
The Italian Ministry of Defence (MoD)
the Mine Hunting Capability (MHC) team
the Royal Canadian Air Force (RCAF)
The U.S. Navy
The U.S. Navy and Marine Corps
The UK Defence Equipment and Support (DE&S)
UK Ministry of Defence's Defence Science and Technology Laboratory (DSTL)
Xiamen University