Visiongain values the Global Anaerobic Digestion (AD) Market at 8,314m in 2017. Read on to discover the potential business opportunities available.
Energy produced from anaerobic digestion will come to play a greater role in the global energy mix as countries look to reduce GHG emissions and generate clean energy. The use of anaerobic digestion as a means to utilise organic waste means that it is being incorporated into waste management programmes, to reduce the amount of waste that we either send to landfill or to be incinerated. Through the process of anaerobic digestion, operators can produce a bio-fertiliser, proven to be a cost-effective and environmentally sensitive solution to increase crop yields. The main factors that dictate the potential for an anaerobic digestion market in countries across the world are linked to the availability of feedstock and the state of the regulatory environment.
The numerous benefits of anaerobic digestion to generate clean, baseload energy, improve waste management and produce a bio-fertiliser to improve agricultural yields will result in a large-scale adoption of the technology, as was seen in parts of Europe in the early part of the 21st Century. Anaerobic digestion facilities continue to receive high levels of investment, proving to be a cost-effective way to utilising biological waste/organic material to generate energy, as well as achieving significant reductions in greenhouse gas (GHG) emissions.
With reference to this report, the market is broken down into total expenditure in the global anaerobic digestion market, including CAPEX and OPEX breakdowns as well as forecasts and analysis covering the period 2017 to 2027 for CAPEX in the waste-fed and farm-fed facility submarkets. Detailed information on the regulatory environment for the biogas sectors of the main global players is also covered.
The report will answer questions such as:
– Which regions are likely to experience the most rapid growth over the coming decade?
– Where are the most anaerobic digestion facilities?
– How is anaerobic digestion use changing and what are the main drivers and restraints behind this change?
– What impact does governmental regulation have on the growth of national anaerobic digestion markets?
– What are the typical capital expenditures necessary for bringing an anaerobic digestion facility online and what are the main variables for these costs?
– What are the typical operation and maintenance costs associated with an anaerobic digestion facility and where are companies likely to find savings in the future as technology improves?
Five Reasons Why You Must Order and Read This Report Today:
1) The report provides market share and detailed profiles of the leading companies operating within the AD market:
– Evonik Industries
– Covanta Holding Corporation
– 2G Energy AG
– Siemens AG
– Xylem Water Solutions
– Parker Hannifin Corporation
– Anaergia Inc
– Cargill Inc
– Harvest Power
– Clearfleau Limited
2) The report provides CAPEX and OPEX forecasts and analyses for five regional anaerobic digestion markets, providing a unique insight into AD industry development
North America
– CAPEX and OPEX Forecast 2017-2027
– Project CAPEX by feedstock type (waste-fed and farm-fed) Forecast 2017-2027
– Number of AD facilities
Europe
– CAPEX and OPEX Forecast 2017-2027
– Project CAPEX by feedstock type (waste-fed and farm-fed) Forecast 2017-2027
– Number of AD facilities
Central and South America
– CAPEX and OPEX Forecast 2017-2027
– Project CAPEX by feedstock type (waste-fed and farm-fed) Forecast 2017-2027
– Number of AD facilities
Asia Pacific
– CAPEX and OPEX Forecast 2017-2027
– Project CAPEX by feedstock type (waste-fed and farm-fed) Forecast 2017-2027
– Number of AD facilities
Rest of the World
– CAPEX and OPEX Forecast 2017-2027
– Project CAPEX by feedstock type (waste-fed and farm-fed) Forecast 2017-2027
– Number of AD facilities Forecast
3) The report also offers 2017-2027 forecasts and analyses for seven leading national anaerobic digestion markets
US
– CAPEX and OPEX Forecast 2017-2027
– Project CAPEX by feedstock type (waste-fed and farm-fed) Forecast 2017-2027
– Number of AD facilities
Canada
– CAPEX and OPEX Forecast 2017-2027
– Project CAPEX by feedstock type (waste-fed and farm-fed) Forecast 2017-2027
– Number of AD facilities
Germany
– CAPEX and OPEX Forecast 2017-2027
– Project CAPEX by feedstock type (waste-fed and farm-fed) Forecast 2017-2027
– Number of AD facilities
France
– CAPEX and OPEX Forecast 2017-2027
– Project CAPEX by feedstock type (waste-fed and farm-fed) Forecast 2017-2027
– Number of AD facilities
Austria
– CAPEX and OPEX Forecast 2017-2027
– Project CAPEX by feedstock type (waste-fed and farm-fed) Forecast 2017-2027
– Number of AD facilities
Italy
– CAPEX and OPEX Forecast 2017-2027
– Project CAPEX by feedstock type (waste-fed and farm-fed) Forecast 2017-2027
– Number of AD facilities Forecast
UK
– CAPEX and OPEX Forecast 2017-2027
– Project CAPEX by feedstock type (waste-fed and farm-fed) Forecast 2017-2026
– Number of AD facilities Forecast
4) The analysis is underpinned by 8 exclusive interviews with leading AD experts:
– Professor Frank Scholwin, Institute for Biogas, Waste Management and Energy
– Julia Levin, Bioenergy Association of California
– Jennifer Green, Canadian Biogas Association
– Phillipp Lukas, Future Biogas
– Dean Hislop, Tamar Energy
– William Jorgenson, Vanguard Renewables
– Mike Apol, Regenis
– Daniil Abubikerov and Sergey Zakrzhevsky, Evobios
5) Learn about the main drivers and restraints behind the Global AD Market:
– MSW generation
– Agricultural production
– Regulatory environment
This independent 252-page report guarantees you will remain better informed than your competition. With 189 tables and figures examining the anaerobic digestion market space, the report gives you a visual, one-stop breakdown of your market including capital expenditure forecasts from 2017-2027, as well drivers and restraints, and leading companies – analysing their strategy, dominant technologies and investment status of potential projects keeping your knowledge that one step ahead helping you to succeed.
This report is essential reading for you or anyone in the AD sectors. Purchasing this report today will help you to recognise those important market opportunities and understand the possibilities there. I look forward to receiving your order.
Visiongain is a trading partner with the US Federal Government
CCR Ref number: KD4R6
1. Report Overview
1.1 Global Anaerobic Digestion Market Overview
1.2 Anaerobic Digestion Market Segmentation
1.3 Why You Should Read This Report
1.4 How This Report Delivers
1.5 Key Questions Answered by This Analytical Report Include:
1.6 Who is This Report For?
1.7 Market Definition
1.8 Methodology
1.9 Frequently Asked Questions (FAQ)
1.10 Associated visiongain Reports
1.11 About visiongain
2. Introduction to the Anaerobic Digestion Market
2.1 The Growth of the Anaerobic Digestion Market
2.1.1 Environmental Drivers
2.1.2 Economic Drivers
2.2 Technological Developments
2.3 Cost Assumptions
3. Global Anaerobic Digestion Market Forecast 2017-2027
3.1 The Global Anaerobic Digestion Market Forecast 2017-2027
3.2 The Global Anaerobic Digestion Regional Market Breakdown and Shares
3.3 The Global Anaerobic Digestion CAPEX and OPEX Submarket Forecast
3.4 The Global Anaerobic Digestion Project Type by Feedstock Submarket Forecast
4. The North American Anaerobic Digestion Market 2017-2027
4.1 The North American Anaerobic Digestion Market Forecast 2017-2027
4.2 The US Anaerobic Digestion Market
4.2.1 The US Anaerobic Digestion Market Forecast 2017-2027
4.2.2 The US Biogas Sector
4.3 The Canadian Anaerobic Digestion Market
4.3.1 The Canadian Anaerobic Digestion Market Forecast 2017-2027
4.3.2 The Canadian Biogas Sector
5. The European Anaerobic Digestion Market 2017-2027
5.1 The European Anaerobic Digestion Market Forecast 2017-2027
5.2 The German Anaerobic Digestion Market
5.2.1 The German Anaerobic Digestion Market Forecast 2017-2027
5.2.2 The German Biogas Sector
5.3 The French Anaerobic Digestion Market
5.3.1 The French Anaerobic Digestion Market Forecast 2017-2027
5.3.2 The French Biogas Sector
5.4 The Austrian Anaerobic Digestion Market
5.4.1 The Austrian Anaerobic Digestion Market Forecast 2017-2027
5.4.2 The Austrian Biogas Sector
5.5 The Italian Anaerobic Digestion Market
5.5.1 The Italian Anaerobic Digestion Market Forecast 2017-2027
5.5.2 The Italian Biogas Sector
5.6 The UK Anaerobic Digestion Market
5.6.1 The UK Anaerobic Digestion Market Forecast 2017-2027
5.6.2 The UK Biogas Sector
5.7 The Rest of Europe Anaerobic Digestion Market
5.7.1 The Rest of Europe Anaerobic Digestion Market Forecast 2017-2027
5.7.2 Netherlands
5.7.3 Switzerland
5.7.4 Sweden
5.7.5 Denmark
6. The Asia Pacific Anaerobic Digestion Market 2017-2027
6.1 The Asia Pacific Anaerobic Digestion Market Forecast 2017-2027
6.2 The Asia Pacific Biogas Sector
7. The Central and South American Anaerobic Digestion Market 2017-2027
7.1 The Central and South American Anaerobic Digestion Market Forecast 2017-2027
7.2 The Central and South American Biogas Sector
8. The Rest of the World Anaerobic Digestion Market 2017-2027
8.1 The Rest of the World Anaerobic Digestion Market Forecast 2017-2027
8.2 The Rest of the World Biogas Sector
9. PEST Analysis of the Global Anaerobic Digestion Market 2017-2027
9.1 Political
9.2 Economic
9.3 Social
9.4 Technological
10. Expert Opinion
10.1 Institute for Biogas, Waste Management & Energy
10.1.1 Institute for Biogas, Waste Management & Energy Overview
10.1.2 The German Biogas Industry
10.1.3 Costing an AD Facility
10.1.4 Technological Improvements and Cutting Costs
10.1.5 Future Prospects for the German Biogas Market
10.2 Bioenergy Association of California
10.2.1 Bioenergy Association of California Overview
10.2.2 The Californian Biogas Industry
10.2.3 Restraints on Growth in the Californian Biogas Industry
10.2.4 Biogas Facilities in the Forestry Sector
10.2.3 Renewable Gas Standard (RGS)
10.2.4 Technological Developments
10.2.5 Future Prospects for the US Biogas Market
10.3 Canadian Biogas Association
10.3.1 Canadian Biogas Association Overview
10.3.2 The Canadian Biogas Industry
10.3.3 Economics of Biogas
10.3.4 Future Prospects for the Canadian Biogas Market
10.4 Future Biogas
10.4.1 Overview of Future Biogas Operations
10.4.2 The UK Regulatory Environment
10.4.3 Improving Policy in the UK
10.4.4 Operation and Maintenance Costs
10.4.5 Development of the UK Waste Management Sector
10.4.6 Main Uncertainties in the UK Anaerobic Digestion Market
10.5 Tamar Energy
10.5.1 Overview of Tamar Energy Operations
10.5.2 The UK Regulatory Environment
10.5.3 Improving Policy in the UK
10.5.4 Costs of Biogas Facilities in the UK
10.5.5 Future Prospects for the UK Anaerobic Digestion Market
10.6 Vanguard Renewables
10.6.1 Vanguard Renewables Overview
10.6.2 The US Biogas Industry
10.6.3 Improving Policy in the US
10.6.4 Associated Capital Costs
10.6.5 Technological Improvements and Cutting Costs
10.6.6 Future Prospects for the US Biogas Market
10.7 Regenis
10.7.1 Overview of Regenis Operations
10.7.2 The US Regulatory Environment
10.7.3 Improving Policy in the US
10.7.4 Associated Capital and O&M Costs
10.7.5 Future Prospects for the US Biogas Market
10.8 Evobios
10.8.1 Evobios Overview
10.8.2 The EU and CIS Biogas Industries
10.8.3 Economics of Biogas
10.8.4 Future Prospects for EU and CIS Biogas Markets
11. The Leading Companies in the Anaerobic Digestion Market
11.1 Evonik Industries
11.1.1 Evonik Industries Total Company Sales 2011-2016
11.1.2 Evonik Industries Sales in the Anaerobic Digestion Market 2011-2016
11.2 Covanta Holding Corporation
11.2.1 Covanta Holding Corporation Total Company Sales 2011-2016
11.2.2 Covanta Holding Corporation Sales in the Anaerobic Digestion Market 2013-2016
11.3 2G Energy AG
11.3.1 2G Energy AG Total Company Sales 2011-2016
11.3.2 2G Energy AG Sales in the Anaerobic Digestion Market 2013-2016
11.4 Siemens AG
11.4.1 Siemens AG Total Company Sales 2011-2016
11.4.2 Siemens AG Sales in the Anaerobic Digestion Market 2015-2016
11.5 Xylem Water Solutions
11.5.1 Xylem Water Solutions Total Company Sales 2011-2016
11.5.2 Xylem Water Solutions Sales in the Anaerobic Digestion Market 2011-2016
11.6 Parker Hannifin Corporation
11.6.1 Parker Hannifin Corporation Total Company Sales 2011-2016
11.6.2 Parker Hannifin Corporation Sales in the Anaerobic Digestion Market 2013-2016
11.7 Anaergia Inc.
11.8 Cargill Inc.
11.9 Harvest Power
11.10 Clearfleau Limited
11.11 Other Companies Involved in the Anaerobic Digestion Market 2016
12. Conclusions and Recommendations
12.1 Global Anaerobic Digestion Market Outlook
12.2 Key Findings in the Global Anaerobic Digestion Market
12.3 Recommendations for the Global Anaerobic Digestion Market
13. Glossary
Appendix
Associated Visiongain Reports
Visiongain Report Sales Order Form
Appendix A
Appendix B
Visiongain Report Evaluation Form
List of Tables
Table 1.1 SAMPLE Anaerobic Digestion Market Forecast 2017-2027
Table 2.1 Top 20 Agricultural Economies by Agricultural Output ($bn)
Table 2.2 Top 20 Agricultural Economies by Agricultural Output ($bn)
Table 3.1 The Global AD Market Total Expenditure Forecast 2017-2027 ($m, AGR %, CAGR %, Cumulative)
Table 3.2 The Global AD Regional Markets Total Expenditure Forecast 2017-2027 ($m, AGR %, Cumulative)
Table 3.3 The Global AD Regional Markets CAPEX Forecast 2017-2027 ($m, AGR %, Cumulative)
Table 3.4 The Global AD Regional Markets OPEX Forecast 2017-2027 ($m, AGR %)
Table 3.5 Global AD Markets Project Type By Feedstock Forecast 2017-2027 ($m, AGR %, CAGR %, Cumulative)
Table 4.1 The North American AD Market Total Expenditure Forecast 2017-2027 ($m, AGR %, CAGR %, Cumulative)
Table 4.2 The North American AD Market Project Type By Feedstock Forecast 2017-2027 ($m, AGR %, CAGR %, Cumulative)
Table 4.3 The US AD Market Total Expenditure Forecast 2017-2027 ($m, AGR %, CAGR %, Cumulative)
Table 4.4 The US AD Market Project Type By Feedstock Forecast 2017-2027 ($m, AGR %, CAGR %)
Table 4.5 Currently Operational and Potential Biogas Systems in the US
Table 4.6 The Canadian AD Market Total Expenditure Forecast 2017-2027 ($m, AGR %, CAGR %, Cumulative)
Table 4.7 The Canadian AD Market Project Type By Feedstock Forecast 2017-2027 ($m, AGR %, CAGR %, Cumulative)
Table 4.8 The North American Anaerobic Digestion Market Drivers and Restraints
Table 5.1 The European AD Market Total Expenditure Forecast 2017-2027 ($m, AGR %, CAGR %, Cumulative)
Table 5.2 The European AD Market Project Type By Feedstock Forecast 2017-2027 ($m, AGR %, CAGR %, Cumulative)
Table 5.3 The German AD Market Total Expenditure Forecast 2017-2027 ($m, AGR %, CAGR %, Cumulative)
Table 5.4 The German AD Market Project Type By Feedstock Forecast 2017-2027 ($m, AGR %, CAGR %, Cumulative)
Table 5.5 The French AD Market Total Expenditure Forecast 2017-2027 ($m, AGR %, CAGR %, Cumulative)
Table 5.6 The French AD Market Project Type By Feedstock Forecast 2017-2027 ($m, AGR %, CAGR %, Cumulative)
Table 5.7 The Austrian AD Market Total Expenditure Forecast 2017-2027 ($m, AGR %, CAGR %, Cumulative)
Table 5.8 The Austrian AD Market Project Type By Feedstock Forecast 2017-2027 ($m, AGR %, CAGR %, Cumulative)
Table 5.9 The Italian AD Market Total Expenditure Forecast 2017-2027 ($m, AGR %, CAGR %, Cumulative)
Table 5.10 The Italian AD Market Project Type By Feedstock Forecast 2017-2027 ($m, AGR %, CAGR %, Cumulative)
Table 5.11 The UK AD Market Total Expenditure Forecast 2017-2027 ($m, AGR %, CAGR %, Cumulative)
Table 5.12 The UK AD Market Project Type By Feedstock Forecast 2017-2027 ($m, AGR %, CAGR %, Cumulative)
Table 5.13 The Rest of Europe AD Market Total Expenditure Forecast 2017-2027 ($m, AGR %, CAGR %, Cumulative)
Table 5.14 The Rest of Europe AD Market Project Type By Feedstock Forecast 2017-2027 ($m, AGR %, CAGR %, Cumulative)
Table 5.15 The Netherlands Biogas Market Breakdown
Table 5.16 The Swiss Biogas Market Breakdown
Table 5.17 The Swedish Biogas Market Breakdown
Table 5.18 The Danish Biogas Market Breakdown
Table 5.19 The European Anaerobic Digestion Market Drivers and Restraints
Table 6.1 The Asia Pacific AD Market Total Expenditure Forecast 2017-2027 ($m, AGR %, CAGR %, Cumulative)
Table 6.2 The Asia Pacific AD Market Project Type By Feedstock Forecast 2017-2027 ($m, AGR %, CAGR %, Cumulative)
Table 6.3 The Asia Pacific Anaerobic Digestion Market Drivers and Restraints
Table 7.1 The Central and South American AD Market Total Expenditure Forecast 2017-2027 ($m, AGR %, CAGR %, Cumulative)
Table 7.2 The Central and South American AD Market Project Type by Feedstock Forecast 2017-2027 ($m, AGR %, CAGR %, Cumulative)
Table 7.3 The Central and South American Anaerobic Digestion Market Drivers and Restraints
Table 8.1 The Rest of the World AD Market Total Expenditure Forecast 2017-2027 ($m, AGR %, CAGR %, Cumulative)
Table 8.2 The Rest of the World AD Market Project Type By Feedstock Forecast 2017-2027 ($m, AGR %, CAGR %, Cumulative)
Table 8.3 The Rest of the World Anaerobic Digestion Market Drivers and Restraints
Table 11.1 Evonik Industries Profile 2016 (CEO, Total Company Sales US$m, Sales From Company Division That Includes Anaerobic Digestion (US$m), Share of Total Company Sales From Company Division That Includes Anaerobic Digestion (%), Net Income / Loss US$m, Net Capital Expenditure US$m, Strongest Business Region, Business Segment in the Market, HQ, Founded, No. of Employees, IR Contact, Ticker, Website)
Table 11.2 Evonik Industries Total Company Sales 2010-2016 (US$m, AGR %)
Table 11.3 Evonik Industries Sales in the Anaerobic Digestion Market 2010-2016 (US$m, AGR %)
Table 11.4 Covanta Holding Corporation Profile 2016 (CEO, Total Company Sales US$m, Sales From Company Division That Includes Anaerobic Digestion (US$m), Share of Total Company Sales From Company Division That Includes Anaerobic Digestion (%), Net Capital Expenditure US$m, Strongest Business Region, Business Segment in the Market, HQ, Founded, No. of Employees, IR Contact, Ticker, Website)
Table 11.5 Covanta Holding Corporation Total Company Sales 2010-2016 (US$m, AGR %)
Table 11.6 Covanta Holding Corporation Sales in the Anaerobic Digestion Market 2012-2016 (US$m, AGR %)
Table 11.7 2G Energy AG Profile 2016 (CEO, Total Company Sales US$m, Sales From Company Division That Includes Anaerobic Digestion (US$m), Share of Total Company Sales From Company Division That Includes Anaerobic Digestion (%), Net Income / Loss US$m, Net Capital Expenditure US$m, Strongest Business Region, Business Segment in the Market, HQ, Founded, No. of Employees, IR Contact, Ticker, Website)
Table 11.8 2G Energy AG Total Company Sales 2010-2016 (US$m, AGR %)
Table 11.9 2G Energy AG Sales in the Anaerobic Digestion Market 2012-2016 (US$m, AGR %)
Table 11.10 Siemens AG Profile 2016 (CEO, Total Company Sales US$m, Sales From Company Division That Includes Anaerobic Digestion (US$m), Share of Total Company Sales From Company Division That Includes Anaerobic Digestion (%), Net Income / Loss US$m, Net Capital Expenditure US$m, Strongest Business Region, Business Segment in the Market, HQ, Founded, No. of Employees, IR Contact, Ticker, Website)
Table 11.11 Siemens AG Total Company Sales 2010-2016 (US$m, AGR %)
Table 11.12 Siemens AG Sales in the Anaerobic Digestion Market 2014-2016 (US$m, AGR %)
Table 11.13 Xylem Water Solutions Profile 2016 (CEO, Total Company Sales US$m, Sales From Company Division That Includes Anaerobic Digestion (US$m), Share of Total Company Sales From Company Division That Includes Anaerobic Digestion (%), Net Income / Loss US$m, Net Capital Expenditure US$m, Strongest Business Region, Business Segment in the Market, HQ, Founded, No. of Employees, IR Contact, Ticker, Website)
Table 11.14 Xylem Water Solutions Total Company Sales 2010-2016 (US$m, AGR %)
Table 11.15 Xylem Water Solutions Sales in the Anaerobic Digestion Market 2010-2016 (US$m, AGR %)
Table 11.16 Parker Hannifin Corporation Profile 2016 (CEO, Total Company Sales US$m, Sales From Company Division That Includes Anaerobic Digestion (US$m), Share of Total Company Sales From Company Division That Includes Anaerobic Digestion (%), Net Income / Loss US$m, Net Capital Expenditure US$m, Strongest Business Region, Business Segment in the Market, HQ, Founded, No. of Employees, IR Contact, Ticker, Website)
Table 11.17 Parker Hannifin Corporation Total Company Sales 2010-2016 (US$m, AGR %)
Table 11.18 Parker Hannifin Corporation Sales in the Anaerobic Digestion Market 2012-2016 (US$m, AGR %)
Table 11.19 Anaergia Inc. Profile 2016 (CEO, Business Segment in the Market, HQ, Founded, Website)
Table 11.20 Cargill Inc. Profile 2016 (CEO, Total Company Sales US$m, Net Income / Loss US$m, Business Segment in the Market, HQ, Founded, No. of Employees, Website)
Table 11.21 Harvest Power Profile 2016 (CEO, Business Segment in the Market, HQ, Founded, Website)
Table 11.22 Clearfleau Limited Profile 2016 (CEO, Business Segment in the Market, HQ, Founded, Website)
Table 11.23 Other Companies Involved in the Anaerobic Digestion Market 2016 (Country, Company)
List of Figures
Figure 1.1 Global Anaerobic Digestion Market Regional Breakdown
Figure 1.2 Global Anaerobic Digestion Market Segmentation
Figure 2.1 MSW Generation by Country (kg per capita per year) 2015
Figure 2.2 Top 20 Agricultural Economies by Agricultural Output ($bn)
Figure 2.3 The Anaerobic Digestion Process
Figure 3.1 The Global AD Market Total Expenditure Forecast 2017-2027 ($m, AGR %)
Figure 3.2 The Global AD Regional Markets Total Expenditure Forecast 2017-2027 ($m)
Figure 3.3 The Global AD Market Forecasts by Regional Share 2017, 2022 and 2027 (% Share)
Figure 3.4 The Global AD Market Cumulative Total Expenditure Share 2017-2027 (%)
Figure 3.5 Global AD Market CAPEX Forecast 2016-2027 ($m, AGR %)
Figure 3.6 Global AD Market OPEX Forecast 2017-2027 ($m, AGR %)
Figure 3.7 Global AD Project Type By Feedstock Submarket Forecast 2017-2027 ($m)
Figure 4.1 The North American AD Market Total Expenditure Forecast 2017-2027 ($m, AGR %)
Figure 4.2 The North American AD Market CAPEX and OPEX Forecast 2017-2027 ($m)
Figure 4.3 The North American AD Market Project Type By Feedstock Forecast 2017-2027 ($m)
Figure 4.4 Additional North American AD Facilities by Year 2015-2026
Figure 4.5 Cumulative Number of North American AD Facilities 2015-2026
Figure 4.6 The North American AD Market Share in 2017, 2022 and 2027 (% Share)
Figure 4.7 The US AD Market Total Expenditure Forecast 2017-2027 ($m, AGR %)
Figure 4.8 The US AD Market CAPEX and OPEX Forecast 2017-2027 ($m)
Figure 4.9 The US AD Market Project Type By Feedstock Forecast 2017-2027 ($m)
Figure 4.10 Additional US AD Facilities by Year 2000-2026
Figure 4.11 Cumulative Number of US AD Facilities 2000-2026
Figure 4.12 The US AD Market Share of North America in 2017, 2022 and 2027 (% Share)
Figure 4.13 Total US Biogas Facilities by State
Figure 4.14 Total US AD Facilities by State
Figure 4.15 Total US Wastewater Biogas Facilities by State
Figure 4.16 Total US Landfill Gas Facilities by State
Figure 4.17 US Biogas Facilities by Type
Figure 4.18 North-eastern US Biogas Facilities by Type
Figure 4.19 Midwestern US Biogas Facilities by Type
Figure 4.20 Western US Biogas Facilities by Type
Figure 4.21 Southern US Biogas Facilities by Type
Figure 4.22 US States by Renewable Portfolio Standard
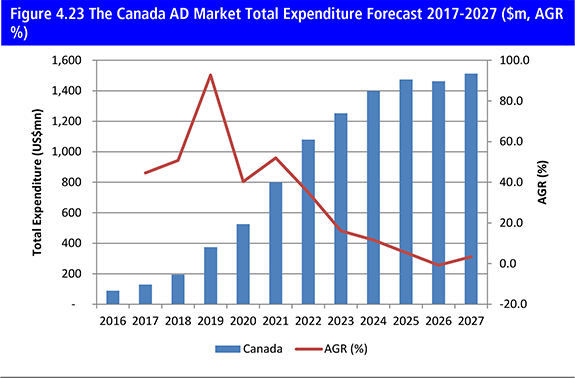
Figure 4.23 The Canada AD Market Total Expenditure Forecast 2017-2027 ($m, AGR %)
Figure 4.24 The Canada AD Market CAPEX and OPEX Forecast 2017-2027 ($m)
Figure 4.25 The Canadian AD Market Project Type By Feedstock Forecast 2017-2027 ($m)
Figure 4.26 Additional Canadian AD Facilities by Year 2015-2026
Figure 4.27 Cumulative Number of Canadian AD Facilities 2015-2026
Figure 4.28 The Canadian AD Market Share of North America in 2016, 2021 and 2026 (% Share)
Figure 4.29 Canadian Provinces
Figure 5.1 The European AD Market Total Expenditure Forecast 2017-2027 ($m, AGR %)
Figure 5.2 The European AD Market CAPEX and OPEX Forecast 2017-2027 ($m)
Figure 5.3 The European AD Project Type By Feedstock Forecast 2017-2027 ($m)
Figure 5.4 Additional European AD Facilities by Year 2014-2026
Figure 5.5 Cumulative Number of European AD Facilities 2014-2026
Figure 5.6 The European AD Market Share in 2016, 2021 and 2026 (% Share)
Figure 5.7 The German AD Market Total Expenditure Forecast 2017-2027 ($m, AGR %)
Figure 5.8 The German AD Market CAPEX and OPEX Forecast 2017-2027 ($m)
Figure 5.9 The German AD Project Type By Feedstock Forecast 2017-2027 ($m)
Figure 5.10 Additional German AD Facilities by Year 2011-2026
Figure 5.11 Cumulative Number of German AD Facilities 2011-2026
Figure 5.12 German Market Share of the European AD Market in 2017, 2022 and 2027 (% Share)
Figure 5.13 German Regional Boundaries
Figure 5.14 The French AD Market Total Expenditure Forecast 2017-2027 ($m, AGR %)
Figure 5.15 The French AD Market CAPEX and OPEX Forecast 2017-2027 ($m)
Figure 5.16 The French AD Project Type By Feedstock Forecast 2017-2027 ($m)
Figure 5.17 Additional French AD Facilities by Year 2014-2026
Figure 5.18 Cumulative Number of French AD Facilities 2014-2026
Figure 5.19 French Market Share of the European AD Market in 2017, 2022 and 2027 (% Share)
Figure 5.20 French Regional Boundaries
Figure 5.21 The Austrian AD Market Total Expenditure Forecast 2017-2027 ($m, AGR %)
Figure 5.22 The Austrian AD Market CAPEX and OPEX Forecast 2017-2027 ($m)
Figure 5.23 The Austrian AD Project Type By Feedstock Forecast 2017-2027 ($m)
Figure 5.24 Additional Austrian AD Facilities by Year 2014-2026
Figure 5.25 Cumulative Number of Austrian AD Facilities 2014-2026
Figure 5.26 Austrian Market Share of the European AD Market in 2017, 2022 and 2027 (% Share)
Figure 5.27 Austrian Regional Boundaries
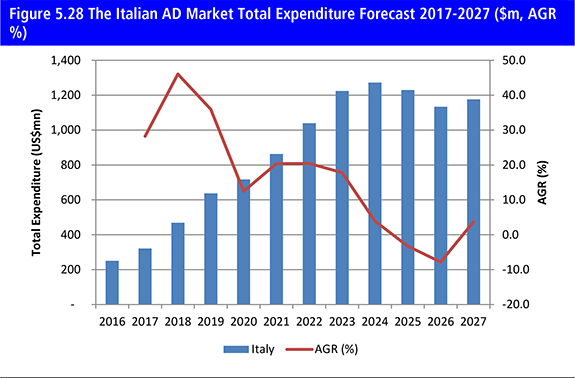
Figure 5.28 The Italian AD Market Total Expenditure Forecast 2017-2027 ($m, AGR %)
Figure 5.29 The Italian AD Market CAPEX and OPEX Forecast 2017-2027 ($m)
Figure 5.30 The Italian AD Project Type By Feedstock Forecast 2017-2027 ($m)
Figure 5.31 Additional Italian AD Facilities by Year 2014-2026
Figure 5.32 Cumulative Number of Italian AD Facilities 2014-2026
Figure 5.33 Italian Market Share of the European AD Market in 2017, 2022 and 2027 (% Share)
Figure 5.34 Italian Regional Boundaries
Figure 5.35 The UK AD Market Total Expenditure Forecast 2017-2027 ($m, AGR %)
Figure 5.36 The UK AD Market CAPEX and OPEX Forecast 2017-2027 ($m)
Figure 5.37 The UK AD Project Type By Feedstock Forecast 2017-2027 ($m)
Figure 5.38 Additional UK AD Facilities by Year 2000-2026
Figure 5.39 Cumulative Number of UK AD Facilities 2000-2026
Figure 5.40 UK Market Share of the European AD Market in 2017, 2022 and 2027 (% Share)
Figure 5.41 UK AD Facilities By Feedstock in 2015
Figure 5.42 UK AD Facilities By End Use Application in 2015
Figure 5.43 The Rest of Europe AD Market Total Expenditure Forecast 2017-2027 ($m, AGR %)
Figure 5.44 The Rest of Europe AD Market CAPEX and OPEX Forecast 2017-2027 ($m)
Figure 5.45 Rest of Europe AD Project Type By Feedstock Forecast 2017-2027 ($m)
Figure 5.46 Additional Rest of Europe AD Facilities by Year 2014-2026
Figure 5.47 Cumulative Number of Rest of Europe AD Facilities 2014-2026
Figure 5.48 Rest of Europe Market Share of the European AD Market in 2017, 2022 and 2027 (% Share)
Figure 6.1 The Asia Pacific AD Market Total Expenditure Forecast 2017-2027 ($m, AGR %)
Figure 6.2 The Asia Pacific AD Market CAPEX and OPEX Forecast 2017-2027 ($m)
Figure 6.3 The Asia Pacific AD Project Type By Feedstock Forecast 2017-2027 ($m)
Figure 6.4 Additional Asia Pacific AD Facilities by Year 2015-2026
Figure 6.5 Cumulative Number of Asia Pacific AD Facilities 2015-2026
Figure 6.6 The Asia Pacific AD Market Share in 2017, 2022 and 2027 (% Share)
Figure 6.7 The Asia Pacific Regional Map
Figure 7.1 The Central & South American AD Market Total Expenditure Forecast 2017-2027 ($m, AGR %)
Figure 7.2 The Central and South American AD Market CAPEX and OPEX Forecast 2017-2027 ($m)
Figure 7.3 The Central and South American AD Project Type By Feedstock Forecast 2017-2027 ($m)
Figure 7.4 Additional Central and South American AD Facilities by Year 2014-2026
Figure 7.5 Cumulative Central and South American AD Facilities 2014-2026
Figure 7.6 The Central and South American AD Market Share in 2017, 2022 and 2027 (% Share)
Figure 7.7 The Central and South American Regional Map
Figure 8.1 The Rest of the World AD Market Total Expenditure Forecast 2017-2027 ($m, AGR %)
Figure 8.2 The Rest of the World AD Market CAPEX and OPEX Forecast 2017-2027 ($m)
Figure 8.3 The Rest of the World AD Project Type By Feedstock Forecast 2017-2027 ($m)
Figure 8.4 Additional Rest of the World AD Facilities by Year 2015-2026
Figure 8.5 Cumulative Number of Rest of the World AD Facilities 2015-2026
Figure 8.6 The Rest of the World AD Market Share in 2017, 2022 and 2027 (% Share)
Figure 8.7 The Rest of the World Regional Map
Figure 11.1 Evonik Industries Total Company Sales 2011-2016 (US$m, AGR %)
Figure 11.2 Evonik Industries Sales in the Anaerobic Digestion Market 2011-2016 (US$m, AGR %)
Figure 11.3 Covanta Holding Corporation Total Company Sales 2011-2016 (US$m, AGR %)
Figure 11.4 Covanta Holding Corporation Sales in the Anaerobic Digestion Market 2013-2016 (US$m, AGR %)
Figure 11.5 2G Energy AG Total Company Sales 2011-2016 (US$m, AGR %)
Figure 11.6 2G Energy AG Sales in the Anaerobic Digestion Market 2013-2016 (US$m, AGR %)
Figure 11.7 Siemens AG Total Company Sales 2011-2016 (US$m, AGR %)
Figure 11.8 Siemens AG Sales in the Anaerobic Digestion Market 2015-2016 (US$m, AGR %)
Figure 11.9 Xylem Water Solutions Total Company Sales 2011-2016 (US$m, AGR %)
Figure 11.10 Xylem Water Solutions Sales in the Anaerobic Digestion Market 2011-2016 (US$m, AGR %)
Figure 11.11 Parker Hannifin Corporation Total Company Sales 2011-2016 (US$m, AGR %)
Figure 11.12 Parker Hannifin Corporation Sales in the Anaerobic Digestion Market 2013-2016 (US$m, AGR %)