This latest report by business intelligence provider Visiongain assesses that Xenon Flash Lamp Market spending will reach $32.1 million in 2020. Xenon flashlamps generate high-intensity light pulses by instantly discharging the energy stored in a capacitor. Besides instantly generating high-intensity glow, they can flash at elevated velocity constantly. These bulbs provide ongoing color features varying from ultraviolet to infrarot to provide the nearest artificial light to normal sunlight. By changing the screen content or introducing optical filters, users can also change the performance spectrum.
It is therefore critical that you have your timescales correct and your forecasting plans ready. This report will ensure that you do. Visiongain’s report will ensure that you keep informed and ahead of your competitors. Gain that competitive advantage.
The xenon flash lamp is commonly used as a medium of light for spectroscopic analysis, camera flash lamp, bright source for stroboscope, high-speed camera shutter lamp, and for many other apps as it generates immediate black high-power light. It also offers a constant high-intensity spectrum from the UV through the visual to the infrared range, and exceptional characteristics such as tiny volume, low heat build-up and simple processing. Conventional lights, however, absence the strength of the flame, which precluded their use as light sources for precision photometry.
Flash Lamp is an electric arc lamp intended for very brief durations to generate highly severe, incoherent, full spectrum blue glow. Flashtubes are produced of a stretch of glass tubing at both ends with electrodes and are packed with a gas that ionizes and performs a high voltage wave when activated to generate the image. In 2019, APAC resulted the industry with a business percentage of almost 37%. It is anticipated that this region will dominate the industry by 2030, with its market share increasing.
Read on to discover how you can exploit the future business opportunities emerging in this sector. Visiongain’s new study tells you and tells you NOW. The 121-pages report provides clear, detailed insight into the global Xenon Flash Lamp market. Discover the key drivers and challenges affecting the market.
By ordering and reading our brand-new report today, you stay better informed and ready to act.
Report Scope
The report delivers considerable added value by revealing:
57 tables, charts and graphs are analyzing and revealing the growth prospects and outlook for the Xenon Flash Lamp market.
Global Xenon Flash Lamp market forecasts and analysis from 2020-2030.
Xenon Flash Lamp market provides revenue estimates, forecasts and analysis from 2020-2030 for Xenon Flash Lamp submarkets:
Forecasts and analysis of Xenon Flash Lamp market by Application between 2020-2030
Industrial & Scientific Market, 2020-2030
Automotive Market, 2020-2030
Camera & Photo Market, 2020-2030
Home Improvement Market, 2020-2030
Medical Procedures Market, 2020-2030
Photography Market, 2020-2030
Precision Farming Market, 2020-2030
Forecasts and analysis of Xenon Flash Lamp market by Power between 2020-2030
<20 W Market, 2020-2030 20-50 W Market, 2020-2030 50-100 W Market, 2020-2030 >100 W Market, 2020-2030
Other Market, 2020-2030
Forecasts and analysis of Xenon Flash Lamp market by Type between 2020-2030
Linear Market, 2020-2030
U-shaped Market, 2020-2030
Helical Market, 2020-2030
Other Types Market, 2020-2030
Regional Xenon Flash Lamp market forecasts from 2020-2030 with drivers and restraints for the countries including:
Geographic Breakdown
Focused regional forecasts and analysis explore the future opportunities:
North America Market, 2020-2030
US Market, 2020-2030
Canada Market, 2020-2030
Europe Market, 2020-2030
The UK Market, 2020-2030
Germany Market, 2020-2030
France Market, 2020-2030
Italy Market, 2020-2030
Spain Market, 2020-2030
Rest of Europe Market, 2020-2030
Asia-Pacific Market, 2020-2030
China Market, 2020-2030
India Market, 2020-2030
Japan Market, 2020-2030
Australia & New Zealand Market, 2020-2030
Rest of Asia-Pacific Market, 2020-2030
LAMEA Market, 2020-2030
Latin America Market, 2020-2030
Middle East Market, 2020-2030
Africa Market, 2020-2030
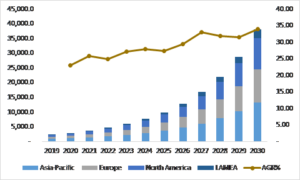
Figure:- Xenon Flash Lamp Market Size and Forecast by Application, 2020-2030
Regions evaluated to follow Xenon Light Source industry understanding, namely North America, Europe, Asia PacificThe report provides a comparison analysis of traditional competitors on the Xenon Light Source industry offering business image, brand portfolios, ability, quality of manufacturing, present development operations, business business stocks of Xenon Light Source, marketing strategies, and potential expectations. Including this, Xenon Light Source industry leaders ‘ SWOT assessment to check major competitors ‘ prospects along with acquisitions and procurement policies to boost worldwide market share.
Company profiles for the leading Xenon Flash Lamp companies
Company Profiles of Leading Players
Sarspec
Rayotek Scientific Inc
Ushio America Inc
Acal BFi
Xenon Corporation
Heraeus Noblelight GmbH
Excelitas
Nanjing Rong Shide Photoelectric Co., Ltd
Weifang Huamei Electronics Co., Ltd
BM Laser Technology Co., Ltd
Osram
Other Key Players in the market
Sciencetech
Excelitas Technologies
Amglo
Advanced Radiation Corporation
International Light Technologies
Hamamatsu
JKL Components Corp.
LuxteL
PHILIPS
Sugawara Laboratories Inc.
AMS Technologies AG
King Design Industrial Co., Ltd.
Agilent Technologies
Anhui Hongyang Laser Technology Co., Ltd.
Jiangmen Uvir Lighting Factory
Shenzhen Guanhongya Optoelectronic Technology Co., Ltd.
Hangzhou SG Electronic Technology Co., Ltd.
Beijing KEYLASER Sci-Tech Co., Ltd.
Shanghai GB Tech Co., Ltd.
Nanjing Startnow Opto-Electronics Co., Ltd.
Shanghai Vking Laser Beauty Co., Ltd.
Beijing LaserTell Medical Co., Ltd.
Weifang KM Electronics Co., Ltd.
Hangzhou SG Electronic Technology Co., Ltd.
Beijing Sunlight Co., Ltd.
Beijing Mejire Aesthetics Science & Technology Co., Ltd.
Sus Advancing Technology Co., Ltd Guangzhou
Beijing San He Photoelectric Technology Co., Ltd.
Weifang Mingliang Electronics Co., Ltd.
Xian Toption Instrument Co., Ltd.
Shenzhen Superwave Laser Technology Co., Ltd.
Conclusions and recommendations which will aid decision-making
How will you benefit from this report?
Keep your knowledge base up to speed. Don’t get left behind
Reinforce your strategic decision-making with definitive and reliable market data
Learn how to exploit new technological trends
Realise your company’s full potential within the market
Understand the competitive landscape and identify potential new business opportunities & partnerships
Who should read this report?
Anyone with involvement in the Xenon Flash Lamp
Energy operators
Engineering contractors
Investment managers
Arbitrage companies and divisions
Xenon Flash Lamp price reporting companies
Xenon Flash Lamp company managers
Xenon Flash Lamp consultants
Xenon Flash Lamp company executives and analysts
Heads of strategic development
Business development managers
Marketing managers
Market analysts,
Technologists
Suppliers
Investors
Banks
Government agencies
Visiongain’s study is intended for anyone requiring commercial analyses for the Xenon Flash Lamp market and leading companies. You find data, trends and predictions.
Buy our report today the Xenon Flash Lamp Market Forecast 2020-2030. Avoid missing out by staying informed – get our report now.
Visiongain is a trading partner with the US Federal Government
CCR Ref number: KD4R6
Do you have any custom requirements we can help you with? Any need for specific country, geo region, market segment or specific company information? Contact us today, we can discuss your needs and see how we can help sara.peerun@visiongain.com
Report Overview
1.1 Global Xenon Flash Lamp Market
1.2 Global Xenon Flash Lamp Market Overview
1.3 Global Xenon Flash Lamp Market Segmentation
1.4 The Emergence of Xenon Flash Lamp in the Industry
1.5 Why You Should Read This Report
1.6 How This Report Delivers
1.7 Key Questions Answered by This Analytical Report
1.8 Methodology
1.8.1 Secondary Research
1.8.2 Market Evaluation & Forecasting Methodology
1.9 Frequently Asked Questions (FAQ)
1.10 Associated Visiongain Reports
1.11 About Visiongain
2. Introduction to Xenon Flash Lamp Market
2.1 Market Definition
2.2 Industry Outlook
2.3 Value Chain Analysis
2.4 Industry Structure
2.5 Current Status & Trends
2.6 Demand & Supply Analysis
2.7 Trade Analysis
2.8 Price Trend Analysis
2.9 Industrial Applications Overview
2.9.1 Stroboscope Light Source
2.9.2 High-Speed Camera Light Source
2.9.3 Photomask Light Source
2.9.4 Color Analyzer
2.9.5 Specimen Scanner Light Source
2.10 Medical and Analytical Applications Overview
2.10.1 Blood Gas Analysis
2.10.2 Clinical Chemistry Analysis
2.10.3 Fluorescence Analysis
2.10.4 Atmospherics Analysis
2.10.5 Water Pollution Analysis
2.10. 6 HPLC
3. Global Xenon Flash Lamp Market Analysis
3.1 PEST Analysis of the Xenon Flash Lamp Market
3.2 Expert Opinion
3.2.1 Primary Correspondents
3.3 Market Outlook
3.4 Drivers & Restraints
3.5 Dominant Region/Country
3.6 Market Scenario
3.7 Overall Growth Rate, Globally
3.8 SWOT Analysis of the Xenon Flash Lamp Market
3.8.1 Strengths
3.8.2 Weaknesses
3.8.3 Opportunities
3.8.4 Threats
3.9 Porter’s Five Forces Analysis
3.9.1 Competitive Rivalry
3.9.2 Supplier Power
3.9.3 Buyer Power
3.9.4 Threat of Substitute
3..9.5 Threat of New Entrant
3.10 Characteristics of Xenon Flash Lamp
3.10.1 Lamp Rating (w)
3.10.2 Arc Length (mm)
3.10.3 Dimensional Outline
3.10.4 Window Material
3.10.5 Spectral Distribution (nm)
3.10.6 Lamp Current
3.10.7 Lamp Voltage
3.10.8 Output Stability
3.10.9 Guaranteed Life
3.10.10 Average Life
4. Xenon Flash Lamp: Global Market Analysis by Segments
4.1 Global Xenon Flash Lamp Market Forecast, by Application 2020-2030
4.1.1 Application Overview
4.1.2 Industrial & Scientific Market, 2020-2030
4.1.3 Automotive Market, 2020-2030
4.1.4 Camera & Photo Market, 2020-2030
4.1.5 Home Improvement Market, 2020-2030
4.1.6 Medical Procedures Market, 2020-2030
4.1.7 Photography Market, 2020-2030
4.1.8 Precision Farming Market, 2020-2030
4.2 Global Xenon Flash Lamp Market Forecast, by Power 2020-2030
4.2.1 Power Overview
4.2.2 100 W Market, 2020-2030
4.2.6 Other Market, 2020-2030
4.3 Global Xenon Flash Lamp Market Forecast, by Type 2020-2030
4.3.1 Type Overview
4.3.2 Linear Market, 2020-2030
4.3.3 U-shaped Market, 2020-2030
4.3.4 Helical Market, 2020-2030
4.3.5 Other Types Market, 2020-2030
5. Leading Regions in Xenon Flash Lamp Market 2020-2030
5.1 Regional Overview
5.1.1 North America
5.1.2 Europe
5.1.3 Asia Pacific
5.1.4 LAMEA
5.1.5 Leading Countries/ Regions
5.2 U.S. Xenon Flash Lamp Market Forecast, 2020-2030
5.2.1 U.S. Xenon Flash Lamp Submarket, By Application Forecast 2020-2030
5.2.2 U.S. Xenon Flash Lamp Submarket, By Power Forecast 2020-2030
5.2.3 U.S. Xenon Flash Lamp Submarket, By Type Forecast 2020-2030
5.2.4 U.S. Xenon Flash Lamp Submarket, By Forecast 2020-2030
5.3 Canada Xenon Flash Lamp Market Forecast, 2020-2030
5.3.1 Canada Xenon Flash Lamp Submarket, By Application Forecast 2020-2030
5.3.2 Canada Xenon Flash Lamp Submarket, By Power Forecast 2020-2030
5.3.3 Canada Xenon Flash Lamp Submarket, By Type Forecast 2020-2030
5.3.4 Canada Xenon Flash Lamp Submarket, By Forecast 2020-2030
5.4 The UK Xenon Flash Lamp Market Forecast, 2020-2030
5.4.1 The UK Xenon Flash Lamp Submarket, By Application Forecast 2020-2030
5.4.2 The UK Xenon Flash Lamp Submarket, By Power Forecast 2020-2030
5.4.3 The UK Xenon Flash Lamp Submarket, By Type Forecast 2020-2030
5.4.4 The UK Xenon Flash Lamp Submarket, By Forecast 2020-2030
5.5 Germany Xenon Flash Lamp Market Forecast, 2020-2030
5.5.1 Germany Xenon Flash Lamp Submarket, By Application Forecast 2020-2030
5.5.2 Germany Xenon Flash Lamp Submarket, By Power Forecast 2020-2030
5.5.3 Germany Xenon Flash Lamp Submarket, By Type Forecast 2020-2030
5.5.4 Germany Xenon Flash Lamp Submarket, By Forecast 2020-2030
5.6 France Xenon Flash Lamp Market Forecast, 2020-2030
5.6.1 France Xenon Flash Lamp Submarket, By Application Forecast 2020-2030
5.6.2 France Xenon Flash Lamp Submarket, By Power Forecast 2020-2030
5.6.3 France Xenon Flash Lamp Submarket, By Type Forecast 2020-2030
5.6.4 France Xenon Flash Lamp Submarket, By Forecast 2020-2030
5.7 Italy Xenon Flash Lamp Market Forecast, 2020-2030
5.7.1 Italy Xenon Flash Lamp Submarket, By Application Forecast 2020-2030
5.7.2 Italy Xenon Flash Lamp Submarket, By Power Forecast 2020-2030
5.7.3 Italy Xenon Flash Lamp Submarket, By Type Forecast 2020-2030
5.7.4 Italy Xenon Flash Lamp Submarket, By Forecast 2020-2030
5.8 Spain Xenon Flash Lamp Market Forecast, 2020-2030
5.8.1 Spain Xenon Flash Lamp Submarket, By Application Forecast 2020-2030
5.8.2 Spain Xenon Flash Lamp Submarket, By Power Forecast 2020-2030
5.8.3 Spain Xenon Flash Lamp Submarket, By Type Forecast 2020-2030
5.8.4 Spain Xenon Flash Lamp Submarket, By Forecast 2020-2030
5.9 Rest of Europe Xenon Flash Lamp Market Forecast, 2020-2030
5.9.1 Rest of Europe Xenon Flash Lamp Submarket, By Application Forecast 2020-2030
5.9.2 Rest of Europe Xenon Flash Lamp Submarket, By Power Forecast 2020-2030
5.9.3 Rest of Europe Xenon Flash Lamp Submarket, By Type Forecast 2020-2030
5.9.4 Rest of Europe Xenon Flash Lamp Submarket, By Forecast 2020-2030
5.10 China Xenon Flash Lamp Market Forecast, 2020-2030
5.10.1 China Xenon Flash Lamp Submarket, By Application Forecast 2020-2030
5.10.2 China Xenon Flash Lamp Submarket, By Power Forecast 2020-2030
5.10.3 China Xenon Flash Lamp Submarket, By Type Forecast 2020-2030
5.10.4 China Xenon Flash Lamp Submarket, By Forecast 2020-2030
5.11 India Xenon Flash Lamp Market Forecast, 2020-2030
5.11.1 India Xenon Flash Lamp Submarket, By Application Forecast 2020-2030
5.11.2 India Xenon Flash Lamp Submarket, By Power Forecast 2020-2030
5.11.3 India Xenon Flash Lamp Submarket, By Type Forecast 2020-2030
5.11.4 India Xenon Flash Lamp Submarket, By Forecast 2020-2030
5.12 Japan Xenon Flash Lamp Market Forecast, 2020-2030
5.12.1 Japan Xenon Flash Lamp Submarket, By Application Forecast 2020-2030
5.12.2 Japan Xenon Flash Lamp Submarket, By Power Forecast 2020-2030
5.12.3 Japan Xenon Flash Lamp Submarket, By Type Forecast 2020-2030
5.12.4 Japan Xenon Flash Lamp Submarket, By Forecast 2020-2030
5.13 Australia & New Zealand Xenon Flash Lamp Market Forecast, 2020-2030
5.13.1 Australia & New Zealand Xenon Flash Lamp Submarket, By Application Forecast 2020-2030
5.13.2 Australia & New Zealand Xenon Flash Lamp Submarket, By Power Forecast 2020-2030
5.13.3 Australia & New Zealand Xenon Flash Lamp Submarket, By Type Forecast 2020-2030
5.13.4 Australia & New Zealand Xenon Flash Lamp Submarket, By Forecast 2020-2030
5.14 Rest of Asia-Pacific Xenon Flash Lamp Market Forecast, 2020-2030
5.14.1 Rest of Asia-Pacific Xenon Flash Lamp Submarket, By Application Forecast 2020-2030
5.14.2 Rest of Asia-Pacific Xenon Flash Lamp Submarket, By Power Forecast 2020-2030
5.14.3 Rest of Asia-Pacific Xenon Flash Lamp Submarket, By Type Forecast 2020-2030
5.14.4 Rest of Asia-Pacific Xenon Flash Lamp Submarket, By Forecast 2020-2030
5.15 Latin America Xenon Flash Lamp Market Forecast, 2020-2030
5.15.1 Latin America Xenon Flash Lamp Submarket, By Application Forecast 2020-2030
5.15.2 Latin America Xenon Flash Lamp Submarket, By Power Forecast 2020-2030
5.15.3 Latin America Xenon Flash Lamp Submarket, By Type Forecast 2020-2030
5.15.4 Latin America Xenon Flash Lamp Submarket, By Forecast 2020-2030
5.16 Middle East Xenon Flash Lamp Market Forecast, 2020-2030
5.16.1 Middle East Xenon Flash Lamp Submarket, By Application Forecast 2020-2030
5.16.2 Middle East Xenon Flash Lamp Submarket, By Power Forecast 2020-2030
5.16.3 Middle East Xenon Flash Lamp Submarket, By Type Forecast 2020-2030
5.16.4 Middle East Xenon Flash Lamp Submarket, By Forecast 2020-2030
5.17 Africa Xenon Flash Lamp Market Forecast, 2020-2030
5.17.1 Africa Xenon Flash Lamp Submarket, By Application Forecast 2020-2030
5.17.2 Africa Xenon Flash Lamp Submarket, By Power Forecast 2020-2030
5.17.3 Africa Xenon Flash Lamp Submarket, By Type Forecast 2020-2030
5.17.4 Africa Xenon Flash Lamp Submarket, By Forecast 2020-2030
7. Leading Companies in The Xenon Flash Lamp Market
7.1 Sarspec
7.1.1 Sarspec Products and Services
7.1.2 Analysis of Sarspec within the Xenon Flash Lamp Market
7.1.3 Sarspec M&A Activity
7.1.4 Future Outlook for Sarspec
7.1.5 Sarspec Projects
7.2 Rayotek Scientific Inc
7.2.1 Rayotek Scientific Inc Products and Services
7.2.2 Analysis of Rayotek Scientific Inc within the Xenon Flash Lamp Market
7.2.3 Rayotek Scientific Inc M&A Activity
7.2.4 Future Outlook for Rayotek Scientific Inc
7.2.5 Rayotek Scientific Inc Projects
7.3 Ushio America Inc
7.3.1 Ushio America Inc Products and Services
7.3.2 Analysis of Ushio America Inc within the Xenon Flash Lamp Market
7.3.3 Ushio America Inc M&A Activity
7.3.4 Future Outlook for Ushio America Inc
7.3.5 Ushio America Inc Projects
7.4 Acal BFi
7.4.1 Acal BFi Products and Services
7.4.2 Analysis of Acal BFi within the Xenon Flash Lamp Market
7.4.3 Acal BFi M&A Activity
7.4.4 Future Outlook for Acal BFi
7.4.5 Acal BFi Projects
7.5 Xenon Corporation
7.5.1 Xenon Corporation Products and Services
7.5.2 Analysis of Xenon Corporation within the Xenon Flash Lamp Market
7.5.3 Xenon Corporation M&A Activity
7.5.4 Future Outlook for Xenon Corporation
7.5.5 Xenon Corporation Projects
7.6 Heraeus Noblelight GmbH
7.6.1 Heraeus Noblelight GmbH Products and Services
7.6.2 Analysis of Heraeus Noblelight GmbH within the Xenon Flash Lamp Market
7.6.3 Heraeus Noblelight GmbH M&A Activity
7.6.4 Future Outlook for Heraeus Noblelight GmbH
7.6.5 Heraeus Noblelight GmbH Projects
7.7 Excelitas
7.7.1 Excelitas Products and Services
7.7.2 Analysis of Excelitas within the Xenon Flash Lamp Market
7.7.3 Excelitas M&A Activity
7.7.4 Future Outlook for Excelitas
7.7.5 Excelitas Projects
7.8 Nanjing Rong Shide Photoelectric Co., Ltd
7.8.1 Nanjing Rong Shide Photoelectric Co., Ltd Products and Services
7.8.2 Analysis of Nanjing Rong Shide Photoelectric Co., Ltd within the Xenon Flash Lamp Market
7.8.3 Nanjing Rong Shide Photoelectric Co., Ltd M&A Activity
7.8.4 Future Outlook for Nanjing Rong Shide Photoelectric Co., Ltd
7.8.5 Nanjing Rong Shide Photoelectric Co., Ltd Projects
7.9 Weifang Huamei Electronics Co., Ltd
7.9.1 Weifang Huamei Electronics Co., Ltd Products and Services
7.9.2 Analysis of Weifang Huamei Electronics Co., Ltd within the Xenon Flash Lamp Market
7.9.3 Weifang Huamei Electronics Co., Ltd M&A Activity
7.9.4 Future Outlook for Weifang Huamei Electronics Co., Ltd
7.9.5 Weifang Huamei Electronics Co., Ltd Projects
7.10 BM Laser Technology Co., Ltd
7.10.1 BM Laser Technology Co., Ltd Products and Services
7.10.2 Analysis of BM Laser Technology Co., Ltd within the Xenon Flash Lamp Market
7.10.3 BM Laser Technology Co., Ltd M&A Activity
7.10.4 Future Outlook for BM Laser Technology Co., Ltd
7.10.5 BM Laser Technology Co., Ltd Projects
7.11 Osram
7.11.1 Osram Products and Services
7.11.2 Analysis of Osram within the Xenon Flash Lamp Market
7.11.3 Osram M&A Activity
7.11.4 Future Outlook for Osram
7.11.5 Osram Projects
8. Conclusions and Recommendations
8.1 Global Xenon Flash Lamp Market Outlook
8.2 Recommendations
9. Glossary
Associated Visiongain Reports
Visiongain Report Sales Order Form
Appendix A
About Visiongain
Appendix B
Visiongain Report Evaluation Form
List of Tables
Table 1.0 Key Highlights
Table 3.1 PEST Analysis, Xenon Flash Lamp Market
Table 3.2 SWOT Analysis
Table 4.1 Global Xenon Flash Lamp Market Forecast 2020-2030 ($Bn, AGR %, CAGR %, Cumulative)
Table 4.2 Global Xenon Flash Lamp Submarket, By Application Forecast 2020-2030 ($billion, AGR %, Cumulative)
Table 4.3 Global Xenon Flash Lamp Submarket, By Type Forecast 2020-2030 ($billion, AGR %, Cumulative)
Table 4.4 Global Xenon Flash Lamp Submarket, By Forecast 2020-2030 ($billion, AGR %, Cumulative)
Table 5.1 Global Xenon Flash Lamp Market, by Country/Region Forecast 2020-2030 ($billion, AGR %, Cumulative)
Table 5.2 Global Xenon Flash Lamp Market, by Country/Region Forecast 2020-2030 ($billion, AGR %, Cumulative)
Table 5.3 Canada Xenon Flash Lamp Market Forecast 2020-2030 ($billion, , AGR %, CAGR %, Cumulative)
Table 5.4 Canada Xenon Flash Lamp Submarket, By Application Forecast 2020-2030 ($billion, AGR %, Cumulative)
Table 5.5 Canada Xenon Flash Lamp Submarket, By Power Forecast 2020-2030 ($billion, AGR %, Cumulative)
Table 5.6 US Xenon Flash Lamp Market Submarket, By Type Forecast 2020-2030 ($billion, , AGR %, CAGR %, Cumulative)
Table 5.7 US Xenon Flash Lamp Submarket, By Application Forecast 2020-2030 ($billion, AGR %, Cumulative)
Table 5.8 US Xenon Flash Lamp Submarket, By Power Forecast 2020-2030 ($billion, AGR %, Cumulative)
Table 5.9 Latin America Xenon Flash Lamp Market Forecast 2020-2030 ($billion, , AGR %, CAGR %, Cumulative)
Table 5.10 Latin America Xenon Flash Lamp Submarket, By Application Forecast 2020-2030 ($billion, AGR %, Cumulative)
Table 5.11 Latin America Xenon Flash Lamp Submarket, By Power Forecast 2020-2030 ($billion, AGR %, Cumulative)
Table 5.12 Germany Xenon Flash Lamp Market Submarket, By Type Forecast 2020-2030 ($billion, , AGR %, CAGR %, Cumulative)
Table 5.13 Germany Xenon Flash Lamp Submarket, By Application Forecast 2020-2030 ($billion, AGR %, Cumulative)
Table 5.14 Germany Xenon Flash Lamp Submarket, By Power Forecast 2020-2030 ($billion, AGR %, Cumulative)
Table 5.15 UK Xenon Flash Lamp Market Submarket, By Type Forecast 2020-2030 ($billion, , AGR %, CAGR %, Cumulative)
Table 5.16 UK Xenon Flash Lamp Submarket, By Application Forecast 2020-2030 ($billion, AGR %, Cumulative)
Table 5.17 UK Xenon Flash Lamp Submarket, By Power Forecast 2020-2030 ($billion, AGR %, Cumulative)
Table 5.18 Spain Xenon Flash Lamp Market Submarket, By Type Forecast 2020-2030 ($billion, , AGR %, CAGR %, Cumulative)
Table 5.19 Spain Xenon Flash Lamp Submarket, By Application Forecast 2020-2030 ($billion, AGR %, Cumulative)
Table 5.20 Spain Xenon Flash Lamp Submarket, By Power Forecast 2020-2030 ($billion, AGR %, Cumulative)
Table 5.21 UK Xenon Flash Lamp Submarket, By Type Forecast 2020-2030 ($billion, , AGR %, CAGR %, Cumulative)
Table 5.22 UK Xenon Flash Lamp Submarket, By Application Forecast 2020-2030 ($billion, AGR %, Cumulative)
Table 5.23 UK Xenon Flash Lamp Submarket, By Power Forecast 2020-2030 ($billion, AGR %, Cumulative)
Table 5.24 China Xenon Flash Lamp Submarket, By Type Forecast 2020-2030 ($billion, , AGR %, CAGR %, Cumulative)
Table 5.25 China Xenon Flash Lamp Submarket, By Application Forecast 2020-2030 ($billion, AGR %, Cumulative)
Table 5.26 China Xenon Flash Lamp Submarket, By Power Forecast 2020-2030 ($billion, AGR %, Cumulative)
Table 5.27 Australia Xenon Flash Lamp Submarket, By Type Forecast 2020-2030 ($billion, , AGR %, CAGR %, Cumulative)
Table 5.28 Australia Xenon Flash Lamp Submarket, By Application Forecast 2020-2030 ($billion, AGR %, Cumulative)
Table 5.29 Australia Xenon Flash Lamp Submarket, By Power Forecast 2020-2030 ($billion, AGR %, Cumulative)
Table 5.30 South Korea Xenon Flash Lamp Submarket, By Type Forecast 2020-2030 ($billion, , AGR %, CAGR %, Cumulative)
Table 5.31 South Korea Xenon Flash Lamp Submarket, By Application Forecast 2020-2030 ($billion, AGR %, Cumulative)
Table 5.32 South Korea Xenon Flash Lamp Submarket, By Power Forecast 2020-2030 ($billion, AGR %, Cumulative)
Table 5.33 Japan Xenon Flash Lamp Submarket, By Type Forecast 2020-2030 ($billion, , AGR %, CAGR %, Cumulative)
Table 5.34 Japan Xenon Flash Lamp Submarket, By Application Forecast 2020-2030 ($billion, AGR %, Cumulative)
Table 5.35 Japan Xenon Flash Lamp Submarket, By Power Forecast 2020-2030 ($billion, AGR %, Cumulative)
Table 5.36 India Xenon Flash Lamp Submarket, By Type Forecast 2020-2030 ($billion, , AGR %, CAGR %, Cumulative)
Table 5.37 India Xenon Flash Lamp Submarket, By Application Forecast 2020-2030 ($billion, AGR %, Cumulative)
Table 5.38 India Xenon Flash Lamp Submarket, By Power Forecast 2020-2030 ($billion, AGR %, Cumulative)
Table 5.39 Middle East Xenon Flash Lamp Submarket, By Type Forecast 2020-2030 ($billion, , AGR %, CAGR %, Cumulative)
Table 5.40 Middle East Xenon Flash Lamp Submarket, By Application Forecast 2020-2030 ($billion, AGR %, Cumulative)
Table 5.41 Middle East Xenon Flash Lamp Submarket, By Power Forecast 2020-2030 ($billion, AGR %, Cumulative)
Table 5.42 Rest of Asia-Pacific Xenon Flash Lamp Submarket, By Type Forecast 2020-2030 ($billion , , AGR %, CAGR %, Cumulative)
Table 5.43 Rest of Asia-Pacific Xenon Flash Lamp Submarket, By Application Forecast 2020-2030 ($billion , AGR %, Cumulative)
Table 5.44 Rest of Asia-Pacific Xenon Flash Lamp Submarket, By Power Forecast 2020-2030 ($billion , AGR %, Cumulative)
Table 5.45 Rest of Europe Xenon Flash Lamp Submarket, By Type Forecast 2020-2030 ($billion, , AGR %, CAGR %, Cumulative)
Table 5.46 Rest of Europe Xenon Flash Lamp Submarket, By Application Forecast 2020-2030 ($billion, AGR %, Cumulative)
Table 5.47 Rest of Europe Xenon Flash Lamp Submarket, By Power Forecast 2020-2030 ($billion, AGR %, Cumulative)
Table 5.48 Africa Xenon Flash Lamp Submarket, By Type Forecast 2020-2030 ($billion, , AGR %, CAGR %, Cumulative)
Table 5.49 Africa Xenon Flash Lamp Submarket, By Application Forecast 2020-2030 ($billion, AGR %, Cumulative)
Table 5.50 Africa Xenon Flash Lamp Submarket, By Power Forecast 2020-2030 ($billion, AGR %, Cumulative)
Table 5.51 Spain Xenon Flash Lamp Submarket, By Type Forecast 2020-2030 ($billion , , AGR %, CAGR %, Cumulative)
Table 5.52 Spain Xenon Flash Lamp Submarket, By Application Forecast 2020-2030 ($billion , AGR %, Cumulative)
Table 5.53 Spain Xenon Flash Lamp Submarket, By Power Forecast 2020-2030 ($billion , AGR %, Cumulative)
Table 7.1 Sarspec Profile 2019 (Market Entry, Public/Private, Headquarters, Geography, Key Market, Listed on, Products/Services
Table 7.2 Sarspec Profile 2019 (Market Entry, Public/Private, Headquarter, Total Company Revenue $billion, Change in Revenue, Geography, Key Market, Listed on, Products/Services)
Table 7.3 Sarspec Products and Services (Product/Service, Notes)
Table 7.4 Sarspec Total Company Sales 2015-2019 (US$billion, AGR %)
Table 7.5 Sarspec Total Company Recent Development 2015-2019
Table 7.6 Rayotek Scientific Inc Profile 2019 (Market Entry, Public/Private, Headquarter, Total Company Revenue $billion, Change in Revenue, Geography, Key Market, Listed on, Products/Services)
Table 7.7 Rayotek Scientific Inc Products and Services (Product/Service, Notes)
Table 7.8 Rayotek Scientific Inc Total Company Sales 2015-2019 (US$billion, AGR %)
Table 7.9 Rayotek Scientific Inc Total Company Recent Development 2015-2019
Table 7.10 Ushio America Inc Profile 2019 (Market Entry, Public/Private, Headquarter, Total Company Revenue $billion, Change in Revenue, Geography, Key Market, Listed on, Products/Services)
Table 7.11 Ushio America Inc Products and Services (Product/Service, Notes)
Table 7.12 Ushio America Inc Total Company Sales 2015-2019 (US$billion, AGR %)
Table 7.13 Ushio America Inc Total Company Recent Development 2015-2019
Table 7.14 Acal BFi Profile 2019 (Market Entry, Public/Private, Headquarter, Total Company Revenue $billion, Change in Revenue, Geography, Key Market, Listed on, Products/Services)
Table 7.15 Acal BFi Products and Services (Product/Service, Notes)
Table 7.16 Acal BFi Total Company Sales 2015-2019 (US$billion, AGR %)
Table 7.17 Acal BFi Total Company Recent Development 2015-2019
Table 7.18 Xenon Corporation Profile 2019 (Market Entry, Public/Private, Headquarter, Total Company Revenue $billion, Change in Revenue, Geography, Key Market, Listed on, Products/Services)
Table 7.19 Xenon Corporation Products and Services (Product/Service, Notes)
Table 7.20 Xenon Corporation Total Company Sales 2015-2019 (US$billion, AGR %)
Table 7.21 Xenon Corporation Total Company Recent Development 2015-2019
Table 7.22 Heraeus Noblelight GmbH Profile 2019 (Market Entry, Public/Private, Headquarter, Total Company Revenue $billion, Change in Revenue, Geography, Key Market, Listed on, Products/Services)
Table 7.23 Heraeus Noblelight GmbH Products and Services (Product/Service, Notes)
Table 7.24 Heraeus Noblelight GmbH Total Company Sales 2015-2019 (US$billion, AGR %)
Table 7.25 Heraeus Noblelight GmbH Total Company Recent Development 2015-2019
Table 7.26 Excelitas Profile 2019 (Market Entry, Public/Private, Headquarter, Total Company Revenue $billion, Change in Revenue, Geography, Key Market, Listed on, Products/Services)
Table 7.27 Excelitas Products and Services (Product/Service, Notes)
Table 7.28 Excelitas Total Company Sales 2015-2019 (US$billion, AGR %)
Table 7.29 Excelitas Total Company Recent Development 2015-2019
Table 7.30 Nanjing Rong Shide Photoelectric Co., Ltd Profile 2019 (Market Entry, Public/Private, Headquarter, Total Company Revenue $billion, Change in Revenue, Geography, Key Market, Listed on, Products/Services)
Table 7.31 Nanjing Rong Shide Photoelectric Co., Ltd Products and Services (Product/Service, Notes)
Table 7.32 Nanjing Rong Shide Photoelectric Co., Ltd Total Company Sales 2015-2019 (US$billion, AGR %)
Table 7.33 Nanjing Rong Shide Photoelectric Co., Ltd Total Company Recent Development 2015-2019
Table 7.34 Weifang Huamei Electronics Co., Ltd Profile 2019 (Market Entry, Public/Private, Headquarter, Total Company Revenue $billion, Change in Revenue, Geography, Key Market, Listed on, Products/Services)
Table 7.35 Weifang Huamei Electronics Co., Ltd Products and Services (Product/Service, Notes)
Table 7.36 Weifang Huamei Electronics Co., Ltd Total Company Sales 2015-2019 (US$billion, AGR %)
Table 7.37 Weifang Huamei Electronics Co., Ltd Total Company Recent Development 2015-2019
Table 7.38 BM Laser Technology Co., Ltd Profile 2019 (Market Entry, Public/Private, Headquarter, Total Company Revenue $billion, Change in Revenue, Geography, Key Market, Listed on, Products/Services)
Table 7.39 BM Laser Technology Co., Ltd Products and Services (Product/Service, Notes)
Table 7.40 BM Laser Technology Co., Ltd Total Company Sales 2015-2019 (US$billion, AGR %)
Table 7.41 BM Laser Technology Co., Ltd Total Company Recent Development 2015-2019
Table 7.42 Osram Profile 2019 (Market Entry, Public/Private, Headquarter, Total Company Revenue $billion, Change in Revenue, Geography, Key Market, Listed on, Products/Services)
Table 7.43 Osram Products and Services (Product/Service, Notes)
Table 7.44 Osram Total Company Sales 2015-2019 (US$billion, AGR %)
Table 7.45 Osram Total Company Recent Development 2015-2019
List of Figures
Figure 1.1 Global Xenon Flash Lamp Market Segmentation
Figure 2.1 Xenon Flash Lamp Value Chain Analysis
Figure 3.1 Xenon Flash Lamp Supply-Demand Analysis
Figure 4.1 Global Xenon Flash Lamp Forecast 2020-2030 ($billion, AGR %)
Figure 4.2 Global Xenon Flash Lamp Market Forecast 2020-2030
Figure 4.3 Global Xenon Flash Lamp Submarket Forecast by 2020-2030 ($ billion)
Figure 4.4 Global Xenon Flash Lamp Market By Application Share Forecast 2020, 2025, 2030 (% Share)
Figure 4.19 Global Xenon Flash Lamp by Submarket By Application Forecast 2020-2030 ($ million)
Figure 4.20 Global Xenon Flash Lamp Market, by Share Forecast 2020, 2025, 2030 (% Share)
Figure 4.21 Xenon Flash Lamp Market, By Application Forecast 2020-2030 ($billion, AGR%)
Figure 4.23 Xenon Flash Lamp Market, By Application Forecast 2020-2030 ($billion, AGR%)
Figure 4.25 Xenon Flash Lamp Market, By Application Forecast 2020-2030 ($billion, AGR%)
Figure 4.27 Xenon Flash Lamp Market, By Application Forecast 2020-2030 ($billion, AGR%)
Figure 5.1 Regional/Country Xenon Flash Lamp Market, by 2020-2030
Figure 5.3 Leading Country/Regional Xenon Flash Lamp Market Share, by 2020
Figure 5.4 Leading Country/Regional Xenon Flash Lamp Market Share, by 2025
Figure 5.5 Leading Country/Regional Xenon Flash Lamp Market Share, by 2030
Figure 5.6 Canada Xenon Flash Lamp Market Forecast 2020-2030 ($billion, AGR%)
Figure 5.7 Canada Xenon Flash Lamp Market, by Forecast 2020-2030
Figure 5.8 Canada Xenon Flash Lamp Submarket, By Application Forecast 2020-2030
Figure 5.9 Canada Xenon Flash Lamp Submarket , By Power Forecast 2020-2030
Figure 5.10 Canada Xenon Flash Lamp Submarket , By Type 2020-2030 ($billion, AGR%)
Figure 5.10 U.S. Xenon Flash Lamp Market Forecast 2020-2030 ($billion, AGR%)
Figure 5.11 U.S. Xenon Flash Lamp Market, by Forecast 2020-2030
Figure 5.12 U.S. Xenon Flash Lamp Submarket, By Application Forecast 2020-2030
Figure 5.13 U.S. Xenon Flash Lamp Submarket , By Power Forecast 2020-2030
Figure 5.13 U.S. Xenon Flash Lamp Submarket , By Type Forecast 2020-2030
Figure 5.14 Latin America Xenon Flash Lamp Market Forecast 2020-2030 ($billion , AGR%)
Figure 5.15 Latin America Xenon Flash Lamp Market, by Forecast 2020-2030
Figure 5.16 Latin America Xenon Flash Lamp Submarket, By Application Forecast 2020-2030
Figure 5.17 Latin America Xenon Flash Lamp Submarket , By Power Forecast 2020-2030
Figure 5.17 Latin America Xenon Flash Lamp Submarket , By Type Forecast 2020-2030
Figure 5.18 Germany Xenon Flash Lamp Market Forecast 2020-2030 ($billion, AGR%)
Figure 5.19 Germany Xenon Flash Lamp Market, by Forecast 2020-2030
Figure 5.20 Germany Xenon Flash Lamp Submarket, By Application Forecast 2020-2030
Figure 5.21 Germany Xenon Flash Lamp Submarket , By Power Forecast 2020-2030
Figure 5.21 Germany Xenon Flash Lamp Submarket , By Type Forecast 2020-2030
Figure 5.22 U.K. Xenon Flash Lamp Market Forecast 2020-2030 ($billion, AGR%)
Figure 5.23 U.K. Xenon Flash Lamp Market, by Forecast 2020-2030
Figure 5.24 U.K. Xenon Flash Lamp Submarket, By Application Forecast 2020-2030
Figure 5.25 U.K. Xenon Flash Lamp Submarket , By Power Forecast 2020-2030
Figure 5.25 U.K. Xenon Flash Lamp Submarket , By Type Forecast 2020-2030
Figure 5.26 Spain Xenon Flash Lamp Market Forecast 2020-2030 ($billion, AGR%)
Figure 5.27 Spain Xenon Flash Lamp Market, by Forecast 2020-2030
Figure 5.28 Spain Xenon Flash Lamp Submarket, By Application Forecast 2020-2030
Figure 5.29 Spain Xenon Flash Lamp Submarket , By Power Forecast 2020-2030
Figure 5.30 UK Xenon Flash Lamp Market Forecast 2020-2030 ($billion, AGR%)
Figure 5.31 UK Xenon Flash Lamp Market, by Forecast 2020-2030
Figure 5.32 UK Xenon Flash Lamp Submarket, By Application Forecast 2020-2030
Figure 5.33 UK Xenon Flash Lamp Submarket , By Power Forecast 2020-2030
Figure 5.34 China Xenon Flash Lamp Market Forecast 2020-2030 ($billion, AGR%)
Figure 5.35 China Xenon Flash Lamp Submarket , By Type, by Forecast 2020-2030
Figure 5.36 China Xenon Flash Lamp Submarket, By Application Forecast 2020-2030
Figure 5.37 China Xenon Flash Lamp Submarket , By Power Forecast 2020-2030
Figure 5.38 Australia Xenon Flash Lamp Market Forecast 2020-2030 ($billion, AGR%)
Figure 5.39 Australia Xenon Flash Lamp Submarket , By Type, by Forecast 2020-2030
Figure 5.40 Australia Xenon Flash Lamp Submarket, By Application Forecast 2020-2030
Figure 5.41 Australia Xenon Flash Lamp Submarket , By Power Forecast 2020-2030
Figure 5.42 South Korea Xenon Flash Lamp Market Forecast 2020-2030 ($billion, AGR%)
Figure 5.43 South Korea Xenon Flash Lamp Submarket , By Type, by Forecast 2020-2030
Figure 5.44 South Korea Xenon Flash Lamp Submarket, By Application Forecast 2020-2030
Figure 5.45 South Korea Xenon Flash Lamp Submarket , By Power Forecast 2020-2030
Figure 5.46 Japan Xenon Flash Lamp Market Forecast 2020-2030 ($billion, AGR%)
Figure 5.47 Japan Xenon Flash Lamp Submarket , By Type, by Forecast 2020-2030
Figure 5.48 Japan Xenon Flash Lamp Submarket, By Application Forecast 2020-2030
Figure 5.49 Japan Xenon Flash Lamp Submarket , By Power Forecast 2020-2030
Figure 5.50 India Xenon Flash Lamp Market Forecast 2020-2030 ($billion, AGR%)
Figure 5.51 India Xenon Flash Lamp Submarket , By Type, by Forecast 2020-2030
Figure 5.52 India Xenon Flash Lamp Submarket, By Application Forecast 2020-2030
Figure 5.53 India Xenon Flash Lamp Submarket , By Power Forecast 2020-2030
Figure 5.54 Middle East Xenon Flash Lamp Market Forecast 2020-2030 ($billion, AGR%)
Figure 5.55 Middle East Xenon Flash Lamp Submarket , By Type, by Forecast 2020-2030
Figure 5.56 Middle East Xenon Flash Lamp Submarket, By Application Forecast 2020-2030
Figure 5.57 Middle East Xenon Flash Lamp Submarket , By Power Forecast 2020-2030
Figure 5.70 Rest of the World Xenon Flash Lamp Market Forecast 2020-2030 ($billion , AGR%)
Figure 5.71 Rest of the World Xenon Flash Lamp Submarket , By Type, by Forecast 2020-2030
Figure 5.72 Rest of the World Xenon Flash Lamp Submarket, By Application Forecast 2020-2030
Figure 5.73 Rest of the World Xenon Flash Lamp Submarket , By Power Forecast 2020-2030
Figure 7.1 Sarspec Total Company Sales 2013-2019 (US$ million, AGR %)
Figure 7.2 Rayotek Scientific Inc Total Company Sales 2013-2019 (US$ million, AGR %)
Figure 7.3 Ushio America Inc Total Company Sales 2013-2019 (US$ Bn, AGR %)
Figure 7.6 Acal BFi Company Sales 2013-2019 (US$ bn, AGR %)
Figure 7.7 Acal BFi Revenue % Share, by Type Segment, 2019
Figure 7.8 Acal BFi Revenue % Share, by Geographical Trade, 2019
Figure 7.9 Acal BFi Revenue % Share, by Business Segment, 2019
Figure 7.10 Xenon Corporation Revenue % Share, by Geographic Segment, 2019
Figure 7.11 Heraeus Noblelight GmbH Company Total Company Sales 2013-2019 (US$ million, AGR %)
Figure 7.12 Excelitas Total Company Sales 2013-2019 (US$ million, AGR %)
Figure 7.13 Excelitas Revenue % Share, by Regional Segment, 2019
Figure 7.14 Nanjing Rong Shide Photoelectric Co., Ltd Total Company Sales 2013-2019 (US$ million, AGR %)
Figure 7.15 Nanjing Rong Shide Photoelectric Co., Ltd Revenue % Share, by Regional Segment, 2019
Figure 7.16 Nanjing Rong Shide Photoelectric Co., Ltd Revenue % Share, by Business Segment, 2019
Figure 7.17 Weifang Huamei Electronics Co., Ltd Total Company Sales 2013-2019 (US$ bn, AGR %)
Figure 7.18 BM Laser Technology Co., Ltd Total Company Revenue 2013-2019 (US$ bn, AGR %)
Figure 7.19 BM Laser Technology Co., Ltd Company Sales 2014-2019 (US$ bn, AGR %)
Figure 7.20 BM Laser Technology Co., Ltd Revenue % Share, by Business Segment, 2019


