• Do you need definitive automated guided vehicle company information?
• Clear competitor analysis?
• Succinct automated guided vehicle industry analysis?
• Technological insight?
• Actionable business recommendations?
Read on to discover how this definitive report can transform your own research and save you time.
The aim of the report is to provide a quantitative evaluation of the largest 20 companies in the global automated guided vehicle market by detailing their revenues, market share, involvement and competitive positioning within the $2bn AGV ecosystem. If you want to be part of this growing industry, then read on to discover how you can maximise your investment potential.
Report highlights
The report focuses on providing detailed profiles of the leading and most innovative companies in the automated guided vehicle sector and analyzes their role in the market and their automated guided vehicle based offerings This report aims to look at automated guided vehicle companies from an end user perspective.
The report is aimed at business executives who wish to gain an overview and information about the automated guided vehicle market and leading companies with the competitive landscape. We believe this will help our clients to understand the industry, technology, market structure and to evaluate suppliers, and map potential other usages for the available technologies. Our research will help you to understand the rapidly evolving leading automated guided vehicle market space.
Report scope
Top 20 Automated Guided Vehicle (AGV) Companies With Market Share %, Revenues And Ranking Within the AGV Market Space
• Bastian Solutions
• Daifuku Co., Ltd.
• Dematic
• Hyster & Yale
• JBT
• Jungerech
• KION
• Konecranes
• Kuka
• Mecalux, S.A.
• Murata Machinery, Ltd.
• Schaefer Holding International GmbH
• Seegrid
• Swisslog
• TGW Logistics Group GmbH
• Toyota Motor Corporation
• Transbotics
• Universal Robots
• Vanderlande Industries
• Yokogawa
SWOT analysis of the major strengths and weaknesses of the AGV market, together with the opportunities available and the key threats faced.
The report serves as a guide for senior executives of small and medium businesses (SMBs), large enterprises, software developers, and automated guided vehicle industry players to:
• Use as a guideline for evaluating the potential of automated guided vehicle technologies across multiple industries and applications
• Inform themselves about automated guided vehicle benefits and issues;
• Understand the supplier landscape and their offerings;
• Anticipate potential for technological development and opportunities with regards to the automated guided vehicle market.
Key questions answered
• What potential is there for the automated guided vehicle industry?
• Where should you target your business strategy?
• Which applications should you focus upon?
• Which disruptive technologies should you invest in?
• Which companies should you form strategic alliances with?
• Which company is likely to succeed and why?
• What business models should you adopt?
• What industry trends should you be aware of?
Target audience
• Automated guided vehicle companies
• Manufacturers
• Automotive OEMs
• Logistics companies
• Component suppliers
• Software developers
• Technologists
• AI specialists
• R&D staff
• Consultants
• Analysts
• Executives
• Business development managers
• Investors
• Governments
• Agencies
• Industry organizations
• Banks
Visiongain is a trading partner with the US Federal Government
CCR Ref number: KD4R6
1. Report Overview
1.1 Global Automated Guided Vehicle Market Overview
1.2 Why You Should Read This Report
1.3 How This Report Delivers
1.4 Key Questions Answered By This Analytical Report
1.5 Who Is This Report For ?
1.6 Methodology
1.7 Frequently Asked Questions (FAQ)
1.8 Associated Visiongain Reports
1.9 About Visiongain
2. Introduction To Automated Guided Vehicles
2.1 Automated Guided Vehicle Market Overview
2.1.1 Industrial Automation Penetration Is Increasing Globally
2.1.2 Growth Of Connected Technology in Supply Chain Industry
2.2 AGV History
2.2.1 Review of the State-of-Art of AGVs
2.3 Market Opportunity For Warehouses Players
2.4 Automated Guided Vehicle `Potential Benefits For Consumers
2.5 Emergence of intelligent AGVs
2.7 Market Definition
2.8 Automated Guided Vehicle Market Drivers
2.8.1 Reduced Cost Of Labour
2.8.2 Enhanced Safety in Workplaces
2.8.3 Enriched Productivity & Accuracy
2.9 Automated Guided Vehicle Market Restraints
2.9.1 High initial investments
2.9.2 Not Suitable for Non-Repetitive Tasks
2.9.3 Complicated End-User Requirements
2.9.4 Lack of Standardization
2.10 Automated Guided Vehicle Market Opportunities
2.10.1 Introduction of IoT and Industry 4.0
2.10.2 Wide Spread of Factory Automation
2.10.3 Emergence of Industrial IoT
3. Value Chain Analysis
3.1 OEMs and Component suppliers
3.2 System Integrators
3.3 End Users
3.4 Suppliers & Distributors
4. Porter’s Five Forces Analysis
4.1 Low Threat Of Forward Integration And Price-Sensitive Buyers Have Led To Low Bargaining Power Among Suppliers
4.2. Presence Of Substitutes And Low Switching Costs Have Led To High Bargaining Power Among Buyers
4.3. Government And Legal Barriers And Well-Known Brand Names Have Led To Low Threat Of New Entrants In The Market
4.4. Low Switching Cost And Product Differentiation Have Led To Moderate Threat Of Substitutes In The Market
4.5. Numerous And Strategically Diverse Competitors Instil High Rivalry In The Market
5. The Automated Guided Vehicle Market Landscape
6. Automated Guided Vehicle Type
6.1 Towed Vehicle Type
6.2 Unit Loader Carrier Type
6.3 Pallet Truck Type Market
6.4 Forklift Truck Type Market
7. Automated Guided Vehicle Navigation Technology
7.1 Laser Guidance
7.2 Magnetic Guidance
7.3 Natural Navigation
7.4 Inductive Guidance
8. Automated Guided Vehicle Application
8.1 Transportation
8.2 Assembly and Packaging
9. Automated Guided Vehicle End-User
9.1 Automotive
9.2 Food & Beverage
9.3 Aerospace Market
9.4 Healthcare Market
9.5 Logistics Market
9.6 Others Market
10. Industry Developments Automated Guided Vehicle Markets
10.1 Industry Landscape
10.1.1 New Product Developments
10.2 Recent Developments
11. Automated Guided Robotics Market Revenue Share, By Key companies
12. Major Players In Automated Guided Vehicles
12.1 Daifuku
12.1.1 Daifuku Company Overview
12.1.2 Daifuku Company Snapshot
12.1.3 Daifuku SWOT Analysis
12.2 JBT Corporation
12.2.1 JBT Corporation Company Overview
12.2.2 JBT Corporation Company Snapshot
12.2.3 JBT Corporation SWOT Analysis
12.3 Kion Group
12.3.1 Kion Group Company Overview
12.3.2 Kion Group Company Snapshot
12.3.3 Kion Group SWOT Analysis
12.4 Toyota Motor Corporation
12.4.1 Toyota Motor Corporation Company Overview
12.4.2 Toyota Motor Corporation Company Snapshot
12.4.3 Toyota Motor Corporation SWOT Analysis
12.5 Kuka
12.5.1 Kuka Company Overview
12.5.2 Kuka Company Snapshot
12.5.3 Kuka SWOT Analysis
12.6 Hyster-Yale Materials Handling
12.6.1 Hyster-Yale Materials Handling Company Overview
12.6.2 Hyster-Yale Materials Handling Company Snapshot
12.6.3 Hyster-Yale Materials Handling SWOT Analysis
12.7 Seegrid Corporation
12.7.1 Seegrid Corporation Company Overview
12.7.2 Seegrid Corporation Company Snapshot
12.7.3 Seegrid Corporation SWOT Analysis
12.8 Jungheinrich AG
12.8.1 Jungheinrich AG Company Overview
12.8.2 Jungheinrich AG Company Snapshot
12.8.3 Jungheinrich AG SWOT Analysis
12.9 Swisslog Holding AG
12.9.1 Swisslog Holding AG Company Overview
12.9.2 Swisslog Holding AG Company Snapshot
12.9.3 Swisslog Holding AG SWOT Analysis
12.10 Konecranes Oyj
12.10.1 Konecranes Oyj Company Overview
12.10.2 Konecranes Oyj Company Snapshot
12.10.3 Konecranes Oyj SWOT Analysis
12.11 TGW Logistics Group
12.11.1 TGW Logistics Group Company Overview
12.11.2 TGW Logistics Group Company Snapshot
12.11.3 TGW Logistics Group SWOT Analysis
12.12 Yokogawa Electric Corporation
12.12.1 Yokogawa Electric Corporation Company Overview
12.12.2 Yokogawa Electric Corporation Company Snapshot
12.12.3 Yokogawa Electric Corporation SWOT Analysis
12.13 Transbotics Corporation
12.13.1 Transbotics Corporation Company Overview
12.13.2 Transbotics Corporation Company Snapshot
12.13.3 Transbotics Corporation SWOT Analysis
12.14 Universal Robots
12.14.1 Universal Robots Company Overview
12.14.2 Universal Robots Company Snapshot
12.14.3 Universal Robots SWOT Analysis
12.15 SSI Schaefer Holding International GmbH
12.15.1 SSI Schaefer Holding International GmbH Company Overview
12.15.2 SSI Schaefer Holding International GmbH Company Snapshot
12.15.3 SSI Schaefer Holding International GmbH SWOT Analysis
12.16 Murata Machinery Ltd.
12.16.1 Murata Machinery Ltd. Company Overview
12.16.2 Murata Machinery Ltd. Company Snapshot
12.16.3 Murata Machinery Ltd. SWOT Analysis
12.17. Mecalux, S.A
12.17.1 Mecalux, S.A Company Overview
12.17.2 Mecalux, S.A Company Snapshot
12.17.3 Mecalux, S.A SWOT Analysis
12.18 Vanderlande Industries
12.18.1 Vanderlande Industries Company Overview
12.18.2 Vanderlande Industries Company Snapshot
12.18.3 Vanderlande Industries SWOT Analysis
12.19 Bastian Solution LLC
12.19.1 Bastian Solution LLC Company Overview
12.19.2 Bastian Solution LLC Company Snapshot
12.19.3 Bastian Solution LLC SWOT Analysis
12.20 Dematic Corporation
12.20.1 Dematic Corporation Company Overview
12.20.2 Dematic Corporation Company Snapshot
12.20.3 Dematic Corporation SWOT Analysis
13. Conclusions and Recommendations
13.1 Automated Guided Vehicle Affords A Competitive Edge
13.3 Advantages On Automated Guided Vehicle
13.4 Disadvantages Of Automated Guided Vehicle
14. List Of Other The Companies In The AGV Value Chain
15. Glossary
List of Tables
Table 10.1 List of Product Innovations In Automated Guided Vehicle By The Leading Organizations, Their Advantage And Specific Technical Details
Table 10.2 Recent Developments (Market Initiatives, Mergers & Acquisitions) in Automated Guided Vehicle Market
Table 11.1 Leading 20 Automated Guided Vehicle Companies 2018 (Market Ranking, Automated Guided Vehicle Revenue, Market Share %)
Table 12.1 Daifuku Company Snapshot (Year of Inception, Key Executives, Primary Business, Net AGV Sales, Market Share, Ranking, Geographic Presence, Product Portfolio, and Key Strategic Move)
Table 12.2 JBT Corporation Snapshot (Year of Inception, Key Executives, Primary Business, Net AGV Sales, Market Share, Ranking, Geographic Presence, Product Portfolio, and Key Strategic Move)
Table 12.3 Kion Group Snapshot (Year of Inception, Key Executives, Primary Business, Net AGV Sales, Market Share, Ranking, Geographic Presence, Product Portfolio, and Key Strategic Move)
Table 12.4 Toyota Motor Corporation Snapshot (Year of Inception, Key Executives, Primary Business, Net AGV Sales, Market Share, Ranking, Geographic Presence, Product Portfolio, and Key Strategic Move
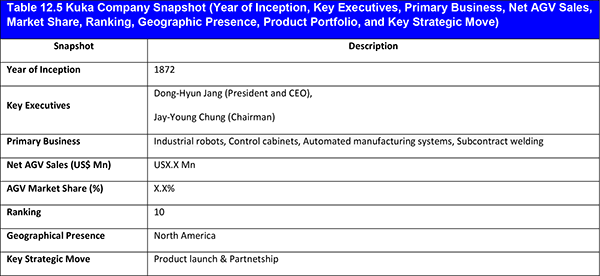
Table 12.5 Kuka Company Snapshot (Year of Inception, Key Executives, Primary Business, Net AGV Sales, Market Share, Ranking, Geographic Presence, Product Portfolio, and Key Strategic Move)
Table 12.6 Hyster & Yale Material Handling Snapshot (Year of Inception, Key Executives, Primary Business, Net AGV Sales, Market Share, Ranking, Geographic Presence, Product Portfolio, and Key Strategic Move)
Table 12.7 Seegrid Corporation Snapshot (Year of Inception, Key Executives, Primary Business, Net AGV Sales, Market Share, Ranking, Geographic Presence, Product Portfolio, and Key Strategic Move
Table 12.8 Jungheinrich AG Snapshot (Year of Inception, Key Executives, Primary Business, Net AGV Sales, Market Share, Ranking, Geographic Presence, Product Portfolio, and Key Strategic Move)
Table 12.9 Swisslog Holding Snapshot (Year of Inception, Key Executives, Primary Business, Net AGV Sales, Market Share, Ranking, Geographic Presence, Product Portfolio, and Key Strategic Move)
Table 12.10 Konecrane Oyj Snapshot (Year of Inception, Key Executives, Primary Business, Net AGV Sales, Market Share, Ranking, Geographic Presence, Product Portfolio, and Key Strategic Move)
Table 12.11 TGW Logistics Group Snapshot (Year of Inception, Key Executives, Primary Business, Net AGV Sales, Market Share, Ranking, Geographic Presence, Product Portfolio, and Key Strategic Move)
Table 12.12 Yokogawa Electric Snapshot (Year of Inception, Key Executives, Primary Business, Net AGV Sales, Market Share, Ranking, Geographic Presence, Product Portfolio, and Key Strategic Move)
Table 12.13 Transbotics Snapshot (Year of Inception, Key Executives, Primary Business, Net AGV Sales, Market Share, Ranking, Geographic Presence, Product Portfolio, and Key Strategic Move)
Table 12.14 Universal Robotics (Year of Inception, Key Executives, Primary Business, Net AGV Sales, Market Share, Ranking, Geographic Presence, Product Portfolio, and Key Strategic Move)
Table 12.15 SSI Schaefer Holding International GmbH Company Snapshots (Year of Inception, Key Executives, Primary Business, Net AGV Sales, Market Share, Ranking, Geographic Presence, Product Portfolio, and Key Strategic Move)
Table 12.16 Murata Machinery Ltd. Company Snapshots (Year of Inception, Key Executives, Primary Business, Net AGV Sales, Market Share, Ranking, Geographic Presence, Product Portfolio, and Key Strategic Move)
Table 12.17 Mecalux S.A Company Snapshots (Year of Inception, Key Executives, Primary Business, Net AGV Sales, Market Share, Ranking, Geographic Presence, Product Portfolio, and Key Strategic Move)
Table 12.18 Vanderlande Industries Company Snapshots (Year of Inception, Key Executives, Primary Business, Net AGV Sales, Market Share, Ranking, Geographic Presence, Product Portfolio, and Key Strategic Move)
Table 12.19 Bastian Solution LLC Company Snapshots (Year of Inception, Key Executives, Primary Business, Net AGV Sales, Market Share, Ranking, Geographic Presence, Product Portfolio, and Key Strategic Move)
Table 12.20 Dematic Company Snapshots (Year of Inception, Key Executives, Primary Business, Net AGV Sales, Market Share, Ranking, Geographic Presence, Product Portfolio, and Key Strategic Move)
List of Figures
Figure 2.1 Automated Guided Vehicle Market Drivers
Figure 2.2 Automated Guided Vehicle Market Restraints
Figure 2.3 Automated Guided Vehicle Market Opportunities
Figure 3.1 Value Chain Analysis
Figure 4.1 Porter’s Five Forces Analysis
Figure 11.1 Leading 20 Automated Guided Vehicle Companies 2018 (Market Share %)
Figure 12.1 Daifuku, Revenue 2015-2017 (Japanese Yen Mn)
Figure 12.2 Daifuku, Gross Profit and R&D Expenses (Yen Mn) 2015-2017
Figure 12.3 JBT Corporation Revenue 2015-2017 (US$m)
Figure 12.4 JBT Corporation Gross Profit and R&D Expenses 2015-2017 (Yen Mn)
Figure 12.5 JBT Corporation Geographic Segment Breakdown (2017, %)
Figure 12.6 JBT Corporation Division Breakdown (2017, %)
Figure 12.7 Kion Group Revenue 2015-2017 (US$m)
Figure 12.8 Kion Group Gross Profit and R&D Expense 2015-2017 (US$m)
Figure 12.9 Kion Group Business Segment Breakdown (2017, %)
Figure 12.10 Toyota Corporation Revenue 2016-2018 (US$b)
Figure 12.11 Gross Profit Of Toyota Industries., 2016-2018 (US$b)
Figure 12.12 Toyota Corporation Revenue 2016-2018 (US$b)
Figure 12.13 Toyota Corporation Business Segment (2018,%)
Figure 12.14 Kuka Revenue Of 2015-2017 (US$m)
Figure 12.15 Hyster & Yale, Inc. Revenue 2015-2017 (US$m)
Figure 12.16 Swisslog Holding Revenue 2015-2017 (US$m)
Figure 12.17 Konecrane,Oyj..Revenue 2015-2017 (US$m)
Figure 12.18 Yokogawa Group .Revenue 2015-2017 (Japanese Yen, Billion)
Figure 12.19 Yokogawa Group. Geographic Revenue 2017 (Share%)
Figure 12.20 Yokogawa Group Business Segment Revenue 2017 (Share%)
Figure 12.21 Murata Machinery Ltd. Revenue & Gross Profit 2017 - 2018 (Yen, Mn)
Figure 12.22 Vanderlande Industries Revenue By Business Segment (2017,%)
AGVE AB
AGVE Group
AutoGuide Mobile Robots
BA System Designs
Bastian Solutions LLC
Bell and Howell
Bolzoni Auramo Beyer
Clearpath
Columbia Machine
Creform Corporation
Daifuku Company Limited
Daihatsu Motor
Dalian Konecranes Company Ltd.
DARPA Autonomy
Dematic Corporation
Dematic GmbH & Co. KG.
DMG Mori Co Ltd
Egemin Automation
Egemin Group
EP Equipment Co., Ltd
Eurofactory GmbH
FedEx
Fetch Robotics
Grenzebach Corporation
Handling Specialty Manufacturing
Hino Motors
Hyster-Yale Materials Handling, Inc.
JBT AeroTech
JBT Corporation
JBT FoodTech
Jungheinrich AG
Kayaba Industry Co Ltd
KION Group
KNAPP
Konecranes AS
Konecranes CZ s.r.o.
Konecranes Kft.
Konecranes N.V.
Konecranes Oyj
Konecranes Pty. Ltd., S.A.
KUKA AG
KUKA de Mexico S. de RL. de C.V.
KUKA Roboter CEE GmbH
KUKA Roboter Italia S.p.A.
KUKA Robotics Australia Pty. Ltd.
KUKA Robotics Canada Ltd.
KUKA Robotics Hungaria Ipari Kft.
KUKA Robotics UK Limited
KUKA Systems (India) Pvt. Ltd.
Linde Gas
Materials Handling International S.A.
Materials Solutions Limited
Mecalux SA
Mitsubishi Logisnext Co Ltd
Morris Middle East Ltd.
Murata Machinery Ltd.
NextLevel Logistik
Nosturiexpertit Oy
OTTO Motors
Raymond Corporation
RedViking
Ricoh USA
Saudi Cranes & Steel Works Factory Co. Ltd.
Schaefer Systems International
Scott Group
Seegrid Corporation
SIA Konecranes Latvija
SSI Schaefer Holding International GmbH
Stahl CraneSystems (India) Pvt. Ltd.
Stanley Black & Decker
Swisslog
Swisslog Holding AG
TGW Future Private Foundation
TGW Logistics Group GmbH
Topper Industrial
Toyota Advanced Logistics
Toyota Financial Services (TFSC)
Toyota Motor Corporation
Transbotics Corporation
Universal Robots A/S
Vanderlande Industries
Vecna Robotics
Velodyne LiDAR
Waypoint
Wesley International
Yaskawa
Yokogawa Electric Corporation

