The latest research report from business intelligence provider visiongain offers comprehensive analysis of the Smart Gas Metering . Visiongain assesses that this market will generate $12.8bn in 2018.
The The Global Smart Meter Market Forecast 2018-2028 responds to your need for definitive market data.
Read on to discover how you can exploit the future business opportunities emerging in this sector. Visiongain’s new study tells you and tells you NOW.
In this brand new report you find 160 in-depth tables, charts and graphs all unavailable elsewhere.
The 156 page report provides clear detailed insight into the global Smart Metering market. Discover the key drivers and challenges affecting the market.
By ordering and reading our brand new report today you stay better informed and ready to act.
Report Scope
The report delivers considerable added value by revealing:
• 100+ tables, charts and graphs analysing and revealing the growth prospects and outlook for the Smart Metering market.
• Global Smart Metering market forecasts and analysis from 2018-2028
• Smart Gas Metering submarket forecasts from 2018-2028
• AMI submarket 2018- 2028
• AMR submarket 2018- 2028
• Regional Smart Metering market forecasts from 2018-2028 with drivers and restraints for the regions including:
• North America
• Europe
• Asia Pacific
• Middle East and Africa
• Latin America
• Smart Metering country level analysis for:
• U.S. submarket 2018-2028
• Canada submarket 2018-2028
• UK submarket 2018-2028
• Sweden submarket 2018-2028
• Germany submarket 2018-2028
• Japan submarket 2018-2028
• China submarket 2018-2028
• South Korea submarket 2018-2028
• UAE submarket 2018-2028
• South Africa submarket 2018-2028
• Brazil submarket 2018-2028
• Rest of Europe submarket 2018-2028
• Rest of Asia-Pacific submarket 2018-2028
• Rest of MEA submarket 2018-2028
• Rest of Latin America submarket 2018-2028
Company profiles for the leading 10 Smart Gas Metering companies
Itron Inc.
Landis+Gyr AG
Iskraemeco
Apator Group
Honeywell International Inc.
Echelon Corporation
Osaki Group
Kronhe Group
Xylem
Centrica plc
Conclusions and recommendations which will aid decision-making
How will you benefit from this report?
• Keep your knowledge base up to speed. Don’t get left behind
• Reinforce your strategic decision-making with definitive and reliable market data
• Learn how to exploit new technological trends
• Realise your company’s full potential within the market
• Understand the competitive landscape and identify potential new business opportunities & partnerships
Who should read this report?
• Anyone with interest in the Smart Gas Metering market
• Oil & gas operators
• Commodity traders
• Investment managers
• Arbitrage companies and divisions
• Energy price reporting companies
• Energy company managers
• Energy consultants
• Oil and gas company executives and analysts
• Heads of strategic development
• Business development managers
• Marketing managers
• Market analysts,
• Technologists
• Suppliers
• Investors
• Banks
• Government agencies
Visiongain’s study is intended for anyone requiring commercial analyses for the Smart Gas Metering market and leading companies. You find data, trends and predictions.
Buy our report today the The Global Smart Meter Market Analysis : By Technology (AMI (Advanced Metering Infrastructure), AMR (Automatic Meter Reading)) Plus Leading Players and Regional Market. Avoid missing out by staying informed – get our report now.
Visiongain is a trading partner with the US Federal Government
CCR Ref number: KD4R6
1. Report Overview
1.1 Global Smart Meter Market Outlook
1.2 Why You Should Read This Report
1.3 How This Report Delivers
1.4 Key Questions Answered by This Report
1.5 Who Is This Report For?
1.6 Methodology
1.6.1 Primary Research
1.6.2 Secondary research
1.6.3 Market Evaluation & Forecasting Methodology
1.7 frequently Asked Questions (FAQs)
1.8 Associated Visiongain Reports
1.9 About Visiongain
2. Introduction to the Smart Meter Market
2.1 Smart Meter Market |Definition
2.2 Smart Meter Technology
2.2.1 Communication of Data
2.2.1.1 Dedicated Radio frequency
2.2.1.2 ZigBee (RF)
2.2.1.3 Power Line Communications (PLC)
2.2.1.4 Cellular Data
2.3 Secondary Markets
2.3.1 In Home Display (IHD)
2.3.2 Internet Based Portal
2.3.3 Meter Data Management (MDM)
2.3.4 Integrated Billing Platform (IBP)
2.3.5 Universal Metering Interface (UMI)/ Communication Hubs
2.3.6 Smart Home Management Devices (SHMD)
2.3.7 Energy Brokers
2.4 Smart Meter Market Structure
2.5 Brief History of Smart Meters
3. The Global Smart Meter Market 2018-2028
3.1 Global Smart Meter Market Forecast 2018-2028
3.2 Smart Meter Market Drivers & restraints 2018
3.2.1 Drivers in The Smart Meter Market
3.2.1.1 Reduction in Energy Consumption
3.2.1.2 Cost Effectiveness and Billing Accuracy
3.2.1.3 Government Support
3.2.1.4 Theft Control
3.2.1.5 Improvement in Awareness of Energy Consumption
3.2.2 Restraints in the Smart Meter Market
3.2.2.1 Security and Health Concerns
3.2.2.2 Low Consumer Acceptance
3.2.2.3 Economic and Technical Barriers
4. Global Smart Meter Market by Technology Forecast 2018-2028
4.1 Global Smart Meter Market by AMI Technology Forecast 2018-2028
4.2 Global Smart Meter Market by AMR Technology Forecast 2018-2028
5. Leading Regional and National Smart Meter Market Forecast 2018-2028
5.1 North America Smart Meter Market Forecast 2018-2028
5.1.1 The US Smart Meter Forecast 2018-2028
5.1.2 The Canadian Smart Meter Market Forecast 2018-2028
5.2 Europe Smart Meter Market Forecast 2018-2028
5.2.1 The UK Smart Meter Forecast 2018-2028
5.2.2 The German Smart Meter Forecast 2018-2028
5.2.3 The Italian Smart Meter Forecast 2018-2028
5.2.4 The Swedish Smart Meter Forecast 2018-2028
5.2.5 The Russian Smart Meter Forecast 2018-2028
5.2.6 The French Smart Meter Forecast 2018-2028
5.2.7 Rest of Europe Smart Meter Forecast 2018-2028
5.3 Asia-Pacific Smart Meter Forecast 2018-2028
5.3.1 The Chinese Smart Meter Forecast 2018-2028
5.3.2 The Japanese Smart Meter Forecast 2018-2028
5.3.3 The Indian Smart Meter Forecast 2018-2028
5.3.4 The South Korean Smart Meter Forecast 2018-2028
5.3.5 Rest of Asia-Pacific Smart Meter Forecast 2018-2028
5.4 Middle East and Africa Smart Meter Forecast 2018-2028
5.4.1 UAE Smart Meter Forecast 2018-2028
5.4.2 Saudi Arabia Smart Meter Forecast 2018-2028
5.4.3 South Africa Smart Meter Forecast 2018-2028
5.4.4 Rest of Middle East and Africa Smart Meter Forecast 2018-2028
5.5 Latin America Smart Meter Forecast 2018-2028
5.5.1 Mexico Smart Meter Forecast 2018-2028
5.5.2 Brazil Smart Meter Forecast 2018-2028
5.5.3 Argentina Smart Meter Forecast 2018-2028
5.5.4 Rest of Latin America Smart Meter Forecast 2018-2028
6. SWOT Analysis of the Smart Meter Market 2018-2028
6.1 Strengths
6.2 Weaknesses
6.3 Opportunities
6.4 Threats
7. The Leading Companies in the Smart Meter Market
7.1 Itron Inc.
7.1.1 Itron Inc. Total Company Sales 2012-2017
7.2 Landis + Gyr AG
7.2.1 Landis + Gyr AG Total Company Sales 2012-2016
7.3 Iskraemeco
7.4 Apator Group
7.4.1 Apator Group Company Sales 2011-2017
7.4.2 Apator Group Sales in the Smart Meter Market 2016-2017
7.5 Honeywell International Inc.
7.5.1 Honeywell International Inc. Total Company Sales 2013-2017
7.5.2 Honeywell International Inc. Sales in the Smart Meter Market 2015-2017
7.6 Echelon Corporation
7.6.1 Echelon Corporation Total Company Sales 20125-2017
7.7 Osaki Group
7.7.1 Osaki Group Total Company Sales 2011-2016
7.7.2 Osaki Group Sales in the Smart Meter Market 2011-2016
7.8 Kronhe Group
7.9 Xylem
7.9.1 Xylem Total Company Sales 2011-2017
7.9.2 Xylem Sales in the Smart Meter Market 2016-2017
7.10 Centrica Plc
7.10.1 Centrica plc Total Company Sales 2011-2017
7.11 Other Companies Involved in the Smart Meter Market 2017
8. Conclusions and Recommendation
8.1 Key Findings
8.2 Recommendations
9. Glossary
List of Tables
Table 1.1 Leading Regional Smart Meter Market Forecast 2018-2028 (US$m, Global AGR %, Cumulative) - Redacted
Table 1.2 Global Smart Meter by Technology Forecast 2018-2028 (US$m, AGR %, CAGR %, Cumulative) - Redacted
Table 3.1 Global Smart Meter Market Forecast 2018-2028 (US$m, AGR %, CAGR %, Cumulative)
Table 3.2 Smart Meter Market Drivers & Restraints
Table 4.1 Global Smart Meter Market by Technology Forecast 2018-2028 (US$m, AGR %, Cumulative)
Table 4.2 Global Smart Meter Market By Technology By Region Forecast 2018-2028 (US$m, Cumulative, Global AGR %)
Table 4.3 Global Smart Meter Market By Technology CAGR Forecast 2018-2023, 2023-2028, 2018-2028 (CAGR %)
Table 4.4 Global Smart Meter Market By AMI Technology Forecast 2018-2028 (US$m, AGR %, CAGR %, Cumulative)
Table 4.5 Global Smart Meter Market By AMI Technology Regional Market CAGR Forecast 2018-2023, 2023-2028, 2018-2028 (CAGR %)
Table 4.6 Global Smart Meter Market By AMR Technology By Region Forecast 2018-2028 (US$m, AGR %, CAGR %, Cumulative)
Table 4.7 Global Smart Meter Market By AMR Technology Regional Market CAGR Forecast 2018-2023, 2023-2028, 2018-2028 (CAGR %)
Table 5.1 Leading Regional Smart Meter Market Forecast 2018-2028 (US$m, Global AGR %, Cumulative)
Table 5.2 Regional Smart Meter Market Percentage Change in Market Share 2018-2023, 2023-2028, 2018-2028 (% Change)
Table 5.3 North America Smart Meter Market by Country Forecast 2018-2028 (US$m, AGR %, CAGR %, Cumulative)
Table 5.4 The U.S. Smart Meter Market By Technology Forecast 2018-2028 (US$m, AGR %, CAGR %, Cumulative)
Table 5.5 Canada Smart Meter Market By Technology Forecast 2018-2028 (US$m, AGR %, CAGR %, Cumulative)
Table 5.6 Europe Smart Meter Market by Country Forecast 2018-2028 (US$m, AGR %, CAGR %, Cumulative)
Table 5.7 The UK Smart Meter Market By Technology Forecast 2018-2028 (US$m, AGR %, CAGR %, Cumulative)
Table 5.8 Germany Smart Meter Market By Technology Forecast 2018-2028 (US$m, AGR %, CAGR %, Cumulative)
Table 5.9 Italy Smart Meter Market By Technology Forecast 2018-2028 (US$m, AGR %, CAGR %, Cumulative)
Table 5.10 Sweden Smart Meter Market By Technology Forecast 2018-2028 (US$m, AGR %, CAGR %, Cumulative)
Table 5.11 Russia Smart Meter Market By Technology Forecast 2018-2028 (US$m, AGR %, CAGR %, Cumulative)
Table 5.12 France Smart Meter Market By Technology Forecast 2018-2028 (US$m, AGR %, CAGR %, Cumulative)
Table 5.13 Rest of Europe Smart Meter Market By Technology Forecast 2018-2028 (US$m, AGR %, CAGR %, Cumulative)
Table 5.14 Asia Pacific Smart Meter Market by Country Forecast 2018-2028 (US$m, AGR %, CAGR %, Cumulative)
Table 5.15 China Smart Meter Market By Technology Forecast 2018-2028 (US$m, AGR %, CAGR %, Cumulative)
Table 5.16 Japan Smart Meter Market By Technology Forecast 2018-2028 (US$m, AGR %, CAGR %, Cumulative)
Table 5.17 India Smart Meter Market By Technology Forecast 2018-2028 (US$m, AGR %, CAGR %, Cumulative)
Table 5.18 South Korea Smart Meter Market By Technology Forecast 2018-2028 (US$m, AGR %, CAGR %, Cumulative)
Table 5.19 Rest of Asia Pacific Smart Meter Market By Technology Forecast 2018-2028 (US$m, AGR %, CAGR %, Cumulative)
Table 5.20 Middle East and Africa Smart Meter Market by Country Forecast 2018-2028 (US$m, AGR %, CAGR %, Cumulative)
Table 5.21 UAE Smart Meter Market By Technology Forecast 2018-2028 (US$m, AGR %, CAGR %, Cumulative)
Table 5.22 Saudi Arabia Smart Meter Market By Technology Forecast 2018-2028 (US$m, AGR %, CAGR %, Cumulative)
Table 5.23 South Africa Smart Meter Market By Technology Forecast 2018-2028 (US$m, AGR %, CAGR %, Cumulative)
Table 5.24 Rest of Middle East and Africa Smart Meter Market By Technology Forecast 2018-2028 (US$m, AGR %, CAGR %, Cumulative)
Table 5.25 Latin America Smart Meter Market by Country Forecast 2018-2028 (US$m, AGR %, CAGR %, Cumulative)
Table 5.26 Mexico Smart Meter Market By Technology Forecast 2018-2028 (US$m, AGR %, CAGR %, Cumulative)
Table 5.27 Brazil Smart Meter Market By Technology Forecast 2018-2028 (US$m, AGR %, CAGR %, Cumulative)
Table 5.28 Argentina Smart Meter Market By Technology Forecast 2018-2028 (US$m, AGR %, CAGR %, Cumulative)
Table 5.29 Rest of Latin America Smart Meter Market By Technology Forecast 2018-2028 (US$m, AGR %, CAGR %, Cumulative)
Table 6.1 Global Smart Meter Market SWOT Analysis 2018-2028
Table 7.1 Itron Inc. 2017 (CEO, Total Company Sales US$m, Sales in the Market US$m, Net Income / Loss US$m, Net Capital Expenditure US$m, Strongest Business Region, Business Segment in the Market, HQ, Founded, No. of Employees, IR Contact, Ticker, Website)
Table 7.2 Itron Inc. Total Company Sales 2011-2016 (US$m, AGR %)
Table 7.3 Landis+Gyr AG Profile 2017 (CEO, Total Company Sales US$m, Strongest Business Region, Business Segment in the Market, HQ, Founded, No. of Employees, IR Contact, Ticker, Website)
Table 7.4 Landis+Gyr AG Total Company Sales 2010-2015 (US$m, AGR %)
Table 7.5 Iskraemeco 2015 (CEO, Business Segment in the Market, HQ, Founded, No. of Employees, IR Contact, Website)
Table 7.6 Apator Group 2017 (CEO, Total Company Sales US$m, Sales in the Market US$m, Share of Total Company Sales from Business Segment that includes Smart Meter Market (%), Strongest Business Region, Business Segment in the Market, HQ, Founded, No. of Employees, IR Contact, Ticker, Website)
Table 7.7 Apator Group Total Company Sales 2010-2017 (US$m, AGR %)
Table 7.8 Apator Group Sales in the Smart Meter Market 2015-2017 (US$m, AGR %)
Table 7.9 Honeywell International Inc. 2017 (CEO, Total Company Sales US$m, Sales in the Market US$m, Share of Total Company Sales from Business Segment that includes Smart Meter Market (%),, Net Income / Loss US$m, Net Capital Expenditure US$m, Strongest Business Region, Business Segment in the Market, HQ, Founded, No. of Employees, IR Contact, Ticker, Website)
Table 7.10 Honeywell International Inc. Total Company Sales 2012-2017 (US$m, AGR %)
Table 7.11 Honeywell International Inc. Sales in the Smart Meter Market 2014-2017 (US$m, AGR %)
Table 7.12 Echelon Corporation 2017 (CEO, Total Company Sales US$m, Net Income / Loss US$m, Net Capital Expenditure US$m, Strongest Business Region, HQ, Founded, No. of Employees, IR Contact, Ticker, Website)
Table 7.13 Echelon Corporation Total Company Sales 2011-2017 (US$m, AGR %)
Table 7.14 Osaki Group 2017 (CEO, Total Company Sales US$m, Sales in the Market US$m, Sales in the Market US$m, Share of Total Company Sales from Business Segment that includes Smart Meter Market (%),, Net Income / Loss US$m, Net Capital Expenditure US$m, Business Segment in the Market, HQ, Founded, No. of Employees, IR Contact, Ticker, Website)
Table 7.15 Osaki Group Total Company Sales 2010-2016 (US$m, AGR %)
Table 7.16 Osaki Group Sales in the Smart Meter Market 2010-2016 (US$m, AGR %)
Table 7.17 Kronhe Group 2017 (CEO, Total Company Sales US$m, HQ, Founded, No. of Employees, IR Contact, Ticker, Website)
Table 7.18 Xylem 2017 (CEO, Total Company Sales US$m, Sales in the Market US$m Sales in the Market US$m, Share of Total Company Sales from Business Segment that includes Smart Meter Market (%),, Net Income / Loss US$m, Net Capital Expenditure US$m, Strongest Business Region, Business Segment in the Market, HQ, Founded, No. of Employees, IR Contact, Ticker, Website)
Table 7.19 Xylem Total Company Sales 2010-2017 (US$m, AGR %)
Table 7.20 Xylem Sales in the Smart Meter Market 2015-2017 (US$m, AGR %)
Table 7.21 Centrica plc 2017 (CEO, Total Company Sales US$m, Net Capital Expenditure US$m, Strongest Business Region, Business Segment in the Market, HQ, Founded, No. of Employees, IR Contact, Ticker, Website)
Table 7.22 Centrica plc Total Company Sales 2010-2017 (US$m, AGR %)
Table 7.23 Other Companies Involved in the Smart Meter Market 2017 (Company, Location)
Table 8.1 Global Smart Meter Market by Technology Forecast 2018-2028 (US$m, AGR %, Cumulative)
Table 8.2 Leading Regional Smart Meter Market Forecast 2018-2028 (US$m, Global AGR %, Cumulative)
List of Figures
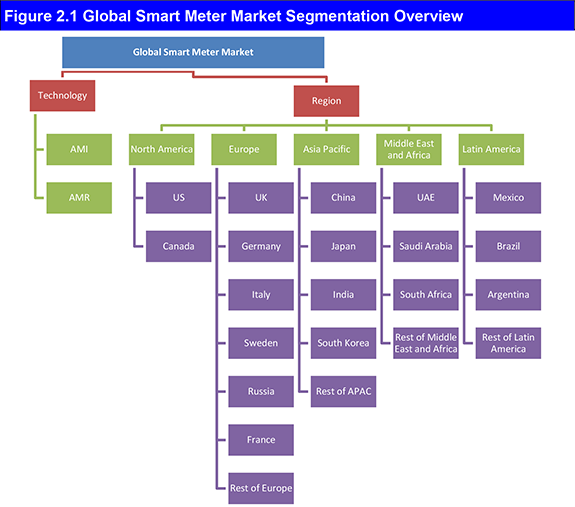
Figure 2.1 Global Smart Meter Market Segmentation Overview
Figure 3.1 Global Smart Meter Market Forecast 2018-2028 (US$m, AGR %)
Figure 4.1 Global Smart Meter Market By Technology AGR Forecast 2018-2028 (AGR %)
Figure 4.2 Global Smart Meter Market By Technology Forecast 2018-2028 (US$m, Global AGR %)
Figure 4.3 Global Smart Meter Market By Technology Share Forecast 2018 (% Share)
Figure 4.4 Global Smart Meter Market By Technology Share Forecast 2023 (% Share)
Figure 4.5 Global Smart Meter Market By Technology Share Forecast 2028 (% Share)
Figure 4.6 Global Smart Meter Market By AMI Technology by Region Market AGR Forecast 2018-2028 (AGR %)
Figure 4.7 Global Smart Meter Market By AMI Technology by Region Market 2018-2028 (US$m, Global AGR %)
Figure 4.8 Global Smart Meter Market By AMI Technology Market Share by Region Market Forecast 2018 (% Share)
Figure 4.9 Global Smart Meter Market By AMI Technology Market Share by Region Market Forecast 2023 (% Share)
Figure 4.10 Global Smart Meter Market By AMI Technology Market Share by Region Market Forecast 2028 (% Share)
Figure 4.11 Global Smart Meter Market By AMR Technology by Region Market AGR Forecast 2018-2028 (AGR %)
Figure 4.12 Global Smart Meter Market By AMR Technology by Region Market 2017-2027 (US$m, Global AGR %)
Figure 4.13 Global Smart Meter Market By AMR Technology Market Share by Region Market Forecast 2018 (% Share)
Figure 4.14 Global Smart Meter Market By AMR Technology Market Share by Region Market Forecast 2023 (% Share)
Figure 4.15 Global Smart Meter Market By AMR Technology Market Share by Region Market Forecast 2028 (% Share)
Figure 5.1 Global Smart Meter Market by Region Market Forecast 2018-2028 (US$m, Global AGR %)
Figure 5.2 Global Smart Meter Market by Region Market AGR Forecast 2018-2028 (AGR %)
Figure 5.3 Global Smart Meter Market by Regional Market Share Forecast 2018 (% Share)
Figure 5.4 Global Smart Meter Market by Regional Market Share Forecast 2023 (% Share)
Figure 5.5 Global Smart Meter Market by Regional Market Share Forecast 2028 (% Share)
Figure 5.6 North America Smart Meter Market by Country AGR Forecast 2017-2027 (AGR %)
Figure 5.7 North America Smart Meter by Country Forecast 2018-2028 (US$m, North America Total Market Sales AGR %)
Figure 5.8 North America Smart Meter Market Share by Country Forecast 2018, 2023, 2028 (% Share)
Figure 5.9 The U.S. Smart Meter Market By Technology Forecast 2018-2028 (US$m)
Figure 5.10 Canada Smart Meter Market By Technology Forecast 2018-2028 (US$m)
Figure 5.11 Europe Smart Meter Market by Country AGR Forecast 2018-2028 (AGR %)
Figure 5.12 Europe Smart Meter Market by Country Forecast 2018-2028 (US$m, Europe Total Market Sales AGR %)
Figure 5.13 Europe Smart Meter Market Share by Country Forecast 2018, 2023, 2028 (% Share)
Figure 5.14 The UK Smart Meter Market By Technology Forecast 2018-2028 (US$m)
Figure 5.15 Germany Smart Meter Market By Technology Forecast 2018-2028 (US$m)
Figure 5.16 Italy Smart Meter Market By Technology Forecast 2018-2028 (US$m)
Figure 5.17 Sweden Smart Meter Market By Technology Forecast 2018-2028 (US$m)
Figure 5.18 Russia Smart Meter Market By Technology Forecast 2018-2028 (US$m)
Figure 5.19 France Smart Meter Market By Technology Forecast 2018-2028 (US$m)
Figure 5.20 Rest of Europe Smart Meter Market By Technology Forecast 2018-2028 (US$m)
Figure 5.21 Asia Pacific Smart Meter Market by Country AGR Forecast 2018-2028 (AGR %)
Figure 5.22 Asia Pacific Smart Meter Market by Country Forecast 2018-2028 (US$m, Asia Pacific Total Market Sales AGR %)
Figure 5.23 Asia Pacific Smart Meter Market Share by Country Forecast 2018, 2023, 2028 (% Share)
Figure 5.24 China Smart Meter Market By Technology Forecast 2018-2028 (US$m)
Figure 5.25 Japan Smart Meter Market By Technology Forecast 2018-2028 (US$m)
Figure 5.26 India Smart Meter Market By Technology Forecast 2018-2028 (US$m)
Figure 5.27 South Korea Smart Meter Market By Technology Forecast 2018-2028 (US$m)
Figure 5.28 Rest of Asia Pacific Smart Meter Market By Technology Forecast 2018-2028 (US$m)
Figure 5.29 Middle East and Africa Smart Meter Market by Country AGR Forecast 2018-2028 (AGR %)
Figure 5.30 Middle East and Africa Smart Meter Market by Country Forecast 2018-2028 (US$m, Middle East and Africa Total Market Sales AGR %)
Figure 5.31 Middle East and Africa Smart Meter Market Share By Country Forecast 2018, 2023, 2028 (% Share)
Figure 5.32 UAE Smart Meter Market By Technology Forecast 2018-2028 (US$m)
Figure 5.33 Saudi Arabia Smart Meter Market By Technology Forecast 2018-2028 (US$m)
Figure 5.34 South Africa Smart Meter Market By Technology Forecast 2018-2028 (US$m)
Figure 5.35 Rest of Middle East and Africa Smart Meter Market By Technology Forecast 2018-2028 (US$m)
Figure 5.36 Latin America Smart Meter Market by Country AGR Forecast 2018-2028 (AGR %)
Figure 5.37 Latin America Smart Meter Market by Country Forecast 2018-2028 (US$m, Latin America Total Market Sales AGR %)
Figure 5.38 Latin America Smart Meter Market Share by Country Forecast 2018, 2023, 2028 (% Share)
Figure 5.39 Mexico Smart Meter Market By Technology Forecast 2018-2028 (US$m)
Figure 5.40 Brazil Smart Meter Market By Technology Forecast 2018-2028 (US$m)
Figure 5.41 Argentina Smart Meter Market By Technology Forecast 2018-2028 (US$m)
Figure 5.42 Rest of Latin America Smart Meter Market By Technology Forecast 2018-2028 (US$m)
Figure 7.1 Itron Inc. Total Company Sales 2012-2017 (US$m, AGR %)
Figure 7.2 Landis+Gyr AG Total Company Sales 2012-2016 (US$m, AGR %)
Figure 7.3 Apator Group Total Company Sales 2011-2017 (US$m, AGR %)
Figure 7.4 Apator Group Sales in the Smart Meter Market 2016-2017 (US$m, AGR %)
Figure 7.5 Honeywell International Inc. Total Company Sales 2013-2017 (US$m, AGR %)
Figure 7.6 Honeywell International Inc. Sales in the Smart Meter Market 2015-2017 (US$m, AGR %)
Figure 7.7 Echelon Corporation Total Company Sales 2012-2017 (US$m, AGR %)
Figure 7.8 Osaki Group Total Company Sales 2011-2016 (US$m, AGR %)
Figure 7.9 Osaki Group Sales in the Smart Meter Market 2011-2016 (US$m, AGR %)
Figure 7.10 Xylem Company Sales 2011-2017 (US$m, AGR %)
Figure 7.11 Xylem Sales in the Smart Meter Market 2016-2017 (US$m, AGR %)
Figure 7.12 Centrica plc Company Sales 2011-2017 (US$m, AGR %)


