Industries > Energy > Subsea Production & Processing Systems Market 2017-2027

Subsea Production & Processing Systems Market 2017-2027
CAPEX Forecasts for Umbilicals, Risers, Flowlines, Controls, Trees, Manifolds and Tie-ins plus Top Companies
The latest research report from business intelligence provider Visiongain offers comprehensive analysis of the Subsea Production & Processing Systems market. Visiongain assesses that this market will generate $16.45bn in 2017.
The Subsea Production & Processing Systems Market Forecast 2017-2027 responds to your need for definitive market data:
Read on to discover how you can exploit the future business opportunities emerging in this sector. Visiongain’s new study tells you and tells you NOW.
In this brand new report you find 259 in-Depth tables, charts and graphs all unavailable elsewhere.
The 356 page report provides clear detailed insight into the global Subsea Production & Processing Systems market. Discover the key drivers and challenges affecting the market.
By ordering and reading our brand new report today you stay better informed and ready to act.
Report Scope
The report delivers considerable added value by revealing:
• 259 tables, charts and graphs analysing and revealing the growth prospects and outlook for the Subsea Production & Processing Systems market.
• Global Subsea Production & Processing Systems market forecasts and analysis from 2017-2027.
• Subsea Production & Processing Systems submarket forecasts from 2017-2027
• Umbilicals submarket forecast 2017-2027
• Risers submarket forecast 2017-2027
• Flowlines submarket forecast 2017-2027
• Controls submarket forecast 2017-2027
• Trees submarket forecast 2017-2027
• Manifolds submarket forecast 2017-2027
• Tie-ins submarket forecast 2017-2027
• Shallow submarket forecast 2017-2027
• Deep submarket forecast 2017-2027
• Ultra Deep submarket forecast 2017-2027
• Regional Subsea Production & Processing Systems market forecasts from 2017-2027 with drivers and restraints for the regions including:
• Asia Pacific
• Gulf of Mexico
• North Sea
• South America
• RoW
• Company profiles for the leading 10 Subsea Production & Processing Systems companies
• Aker Solutions
• EZRA Holdings Limited
• TechnipFMC plc
• Oceaneering
• Saipem SpA
• Subsea 7
• General Electric
• Halliburton
• Schlumberger Limited
• Dril-Quip, Inc.
• Conclusions and recommendations which will aid decision-making
How will you benefit from this report?
• Keep your knowledge base up to speed. Don’t get left behind
• Reinforce your strategic decision-making with definitive and reliable market data
• Learn how to exploit new technological trends
• Realise your company’s full potential within the market
• Understand the competitive landscape and identify potential new business opportunities & partnerships
Who should read this report?
• Anyone with interest in the Subsea Production & Processing Systems market
• Oil & gas operators
• Commodity traders
• Investment managers
• Arbitrage companies and divisions
• Energy price reporting companies
• Energy company managers
• Energy consultants
• Oil and gas company executives and analysts
• Heads of strategic development
• Business development managers
• Marketing managers
• Market analysts,
• Technologists
• Suppliers
• Investors
• Banks
• Government agencies
Visiongain’s study is intended for anyone requiring commercial analyses for the Subsea Production & Processing Systems market and leading companies. You find data, trends and predictions.
Buy our report today the Subsea Production & Processing Systems Market 2017-2027: CAPEX Forecasts for Umbilicals, Risers, Flowlines, Controls, Trees, Manifolds and Tie-ins Plus Top Companies. Avoid missing out by staying informed – get our report now.
Visiongain is a trading partner with the US Federal Government
CCR Ref number: KD4R6
1. Report Overview
1.1 Global Subsea Production & Processing Systems Market Overview
1.2 Why You Should Read This Report
1.3 How This Report Delivers
1.4 Key Questions Answered by This Analytical Report Include:
1.5 Who is This Report For?
1.6 Methodology
1.7 Frequently Asked Questions (FAQ)
1.8 Associated Visiongain Reports
1.9 About Visiongain
2. Introduction to the Subsea Production & Processing Systems Market
2.1 Subsea Production & Processing Systems Market Structure
2.2 Subsea Production & Processing Systems Market Definition
2.3 Brief History of Subsea Production & Processing Systems
2.4 Subsea Installation
2.5 Subsea Umbilicals
2.6 Risers and Flowlines
2.6.1 New Riser and Flowline Technologies
2.6.1.1 Electrically Heated Flowlines
2.6.1.2 Steel Catenary Risers
2.7 Subsea Control Systems
2.7.1 Wireless Technology and Buoys
2.7.2 Gas Compressors and Pressure Boosters
2.7.3 Vertical Annular Separation & Pumping System (VASPS)
2.7.4 Subsea Separators & De-Sander Modules
2.7.5 Multiphase Flow Meters
2.7.6 Subsea Water Treatment and Reinjection
2.7.7 Well Containment Systems
2.8 Trees
2.9 Manifolds and Tie-Ins
3. Global Subsea Production & Processing Systems Market 2017-2027
3.1 Oil Prices and the Subsea Production and Processing Systems Market
3.1.1 Visiongain’s Description and Analysis of the Oil Price Fall
3.1.2 Supply-Side Factors
3.1.3 Demand-Side Factors
3.1.4 Other Major Variables that Impact the Oil Price
3.1.5 Visiongain’s Oil Price Assumptions and Forecast
3.2 The Drivers and Restraints in the Global Subsea Production & Processing Systems Market
3.2.1 Global Energy Demand
3.2.2 The Impact of Oil Prices and SURF Technology on Marginal Field Profitability
3.2.3 Technological Diversification and Growth Opportunities
3.2.4 Avoiding Security Challenges
3.2.5 Harsh Environments Lead to Tough Challenges
3.2.6 Concerns about the Supply Chain and Relevant Skills
3.2.7 Is Regulation Enough to Appease Public Unease over Subsea and Deepwater Production?
3.2.8 The Cost of Subsea Developments and Access to Finance
4. Subsea Production & Processing Systems Submarkets 2017-2027
4.1 The Subsea Production & Processing Systems Hardware Submarket Forecasts 2017-2027
4.2 The Subsea Production & Processing Systems Water Depth Submarket Forecasts 2017-2027
5. The African Subsea Production & Processing Systems Market 2017-2027
5.1 What is the Current Status of the Subsea Production & Processing Systems Market in Africa?
5.2 Drivers and Restraints in the African Subsea Production & Processing Systems Market Table 5.3 outlines the main drivers and restraints influencing the subsea P&P systems market in Africa.
5.3 What Potential is there in Africa for Subsea Production & Processing Systems?
5.3.1 Delays and Security Issues Continue to Plague the African Market
5.3.2 Political Instability and Delays to the Petroleum Industry Bill Defer Offshore Growth
5.4 Major African Subsea Production & Processing Systems Projects and Individualised Outlooks
6. The Asia Pacific Subsea Production & Processing Systems Market 2017-2027
6.1 What is the Current Status of the Subsea Production & Processing Systems Market in Asia Pacific?
6.2 Drivers and Restraints in the Asia Pacific Subsea Production & Processing Systems Market
6.3 What Potential is there in Asia Pacific for Subsea Production & Processing Systems?
6.4 Major Asia Pacific Subsea Production & Processing Systems Projects and Individualised Outlooks
6.4.1 Australia
6.4.2 Brunei
6.4.3 China
6.4.4 India
6.4.5 Indonesia
6.4.6 Malaysia
6.4.7 Papua New Guinea
6.4.8 Vietnam
7. The Gulf of Mexico Subsea Production & Processing Systems Market 2017-2027
7.1 What is the Current Status of the Subsea Production & Processing Systems Market in Gulf of Mexico?
7.2 Drivers and Restraints in the Gulf of Mexico Subsea Production & Processing Systems Market 7.3 What Potential is there in the Gulf of Mexico for Subsea Production & Processing Systems?
7.4 Major Gulf of Mexico Subsea Production & Processing Systems Projects and Individualised Outlooks
8. The North Sea Subsea Production & Processing Systems Market 2017-2027
8.1 What is the Current Status of the Subsea Production & Processing Systems Market in North Sea?
8.2 Drivers and Restraints in the North Sea Subsea Production & Processing Systems Market
8.3 What Potential is there in the North Sea for Subsea Production & Processing Systems?
8.3.1 Are Increased E&P and Expertise Enough to Counteract Declining Production in Norway?
8.4 Major North Sea Production & Processing Systems Projects and Individualised Outlooks
8.4.1 Denmark
8.4.2 Netherlands
9. The South America Subsea Production & Processing Systems Market 2017-2027
9.1 What is the Current Status of the Subsea Production & Processing Systems Market in South America?
9.2 Drivers and Restraints in the South America Subsea Production & Processing Systems Market
9.3 What Potential is there in South America for Subsea Production & Processing Systems?
9.4 Major South America Production & Processing Systems Projects and Individualised Outlooks
10. The Rest of the World Subsea Production & Processing Systems Market 2017-2027
10.1 Drivers and Restraints in the Rest of the World Subsea Production & Processing Systems Market
10.2 Major Rest of the World Production & Processing Systems Projects and Individualised Outlooks
10.2.1 The Arctic
10.2.2 Canada
10.2.3 Caspian Sea
10.2.4 Ireland
10.2.5 Mediterranean Sea
10.2.6 Persian Gulf
10.2.7 Trinidad and Tobago
11. PEST Analysis of the Subsea Production & Processing Systems Market
11.1 Political
11.2 Economical
11.3 Social
11.4 Technological
12. Expert Opinion
12.1 Airborne Oil & Gas
12.1.1 Operations
12.1.2 Drivers and Restraints in the Subsea Production & Processing Systems Market
12.1.3 Oil Prices and the Subsea Market
12.1.4 Thermoplastic and Steel Pipes
12.1.5 Regional Markets in the SURF Market
12.2 JDR Cable Systems
12.2.1 JDR Operations
12.2.2 Subsea Production & Processing Systems Market Drivers
12.2.3 Subsea Production & Processing Systems Market Restraints
12.2.4 The Effects of Lower Oil Prices on the Subsea Market
12.2.5 Low Oil Prices and New Projects
12.2.6 Business Strategies and Declining Oil Prices
12.2.7 Water Depth and SURF
12.2.8 Deepwater Projects and Oil Prices
12.2.9 Regional Subsea Markets
12.2.10 The Demand for SURF
12.2.11 The Length of Umbilicals
12.2.12 Skills Shortage in the SURF Market
12.3 Subsea UK
12.3.1 Neil Gordon and Subsea UK
12.3.2 The World-Leading UK Subsea Sector
12.3.3 Low Oil Prices and the Subsea Market
12.3.4 North Sea Outlook
12.3.5 Global Outlook
12.3.6 Key Technological Innovations
13. The Leading Companies in the Subsea Production & Processing Systems Market
13.1 Aker Solutions
13.1.1 Aker Solutions Total Company Sales 2011-2016
13.1.2 Aker Solutions Sales in the Subsea Production & Processing Systems Market 2011-2016
13.2 EZRA Holdings Limited
13.2.1 EZRA Holdings Limited Total Company Sales 2011-2016
13.2.2 EZRA Holdings Limited Sales in the Subsea Production & Processing Systems Market 2011-2016
13.3 TechnipFMC plc
13.4 Oceaneering International, Inc.
13.4.1 Oceaneering International, Inc. Total Company Sales 2011-2016
13.4.2 Oceaneering International, Inc. Sales in the Subsea Production & Processing Systems Market 2011-2016
13.5 Subsea 7 SA
13.5.1 Subsea 7 SA Total Company Sales 2011-2016
13.5.2 Subsea 7 SA Sales in the Subsea Production & Processing Systems Market 2011-2016
13.6 Saipem SpA
13.6.1 Saipem SpA Total Company Sales 2011-2016
13.7 General Electric
13.7.1 General Electric Total Company Sales 2012-2016
13.7.2 General Electric Sales in the Subsea Production & Processing Systems Market 2012-2016
13.8 Halliburton
13.8.1 Halliburton Total Company Sales 2011-2016
13.8.2 Halliburton Sales in the Subsea Production & Processing Systems Market 2011-2016
13.9 Schlumberger Limited
13.9.1 Schlumberger Limited Total Company Sales 2011-2016
13.10 Dril-Quip, Inc.
13.10.1 Dril-Quip, Inc. Total Company Sales 2011-2016
13.10.2 Dril-Quip, Inc. Sales in the Subsea Production & Processing Systems Market 2011-2016
13.11 Other Companies Involved in the Subsea Production & Processing Systems Market 2016
14. Conclusions and Recommendations
14.1 Key Findings
14.2 Recommendations
15. Glossary
Associated Visiongain Reports
Visiongain Report Sales Order Form
Appendix A
About Visiongain
Appendix B
Visiongain report evaluation form
List of Tables
Table 1.1 Regional Subsea Production and Processing Systems Market Forecast 2017-2027 ($bn, AGR %)
Table 2.1 Subsea Process Classification (Age, Equipment, Characteristics, Water Disposal, Sand Disposal)
Table 2.2 Advantages and Disadvantages of Hydraulic Diaphragm Electric Submersible Pumps
Table 2.3 Advantages and Disadvantages of Electric Submersible Pumps (ESP)
Table 2.4 Advantages and Disadvantages of Progressive Cavity Pumps (PCP)
Table 2.5 Advantages and Disadvantages of Hydraulic Turbine or Helico Axial Pumps (HAP)
Table 2.6 Advantages and Disadvantages of Twin-Screw Pumps (TSP)
Table 3.1 Global Subsea Production and Processing Systems Market Forecast, 2017-2027 ($bn, AGR %, Cumulative)
Table 3.2 Regional Subsea Production and Processing Systems Market Forecast 2017-2027 ($bn, AGR %)
Table 3.3 Visiongain’s Anticipated Brent Crude Oil Average Spot Price, 2017, 2018, 2019-2021, 2022-2024, 2025-2027 ($/bbl)
Table 3.4 Global Subsea Production & Processing Systems Market Drivers & Restraints
Table 4.1 Subsea Production & Processing Systems Hardware Submarket Forecasts, 2017-2027 ($bn, AGR %, Cumulative)
Table 4.2 Subsea Production & Processing Systems Hardware Submarket CAPEX CAGR Forecasts, 2017-2022, 2022-2027 and 2017-2027 (%)
Table 4.3 Umbilicals Submarket Forecast, 2017-2027 ($bn, AGR %)
Table 4.4 The Umbilicals Submarket Forecast by Region 2017-2027 ($m, AGR %, Cumulative)
Table 4.5 Risers Submarket Forecast, 2016-2026 ($bn, AGR %)
Table 4.6 The Risers Submarket Forecast by Region 2017-2027 ($m, AGR %, Cumulative)
Table 4.7 Flowlines Submarket Forecast, 2017-2027 ($bn, AGR %)
Table 4.8 The Flowlines Submarket Forecast by Region 2017-2027 ($m, AGR %, Cumulative)
Table 4.9 Controls Submarket Forecast, 2017-2027 ($bn, AGR %)
Table 4.10 The Controls Submarket Forecast by Region 2017-2027 ($m, AGR %, Cumulative)
Table 4.11 Trees Submarket Forecast, 2017-2027 ($bn, AGR %)
Table 4.12 The Trees Submarket Forecast by Region 2017-2027 ($m, AGR %, Cumulative)
Table 4.13 Manifolds Submarket Forecast, 2017-2027 ($bn, AGR %)
Table 4.14 The Manifolds Submarket Forecast by Region 2017-2027 ($m, AGR %, Cumulative)
Table 4.15 Tie-Ins Submarket Forecast, 2017-2027 ($bn, AGR %)
Table 4.16 The Tie-Ins Submarket Forecast by Region 2017-2027 ($m, AGR %, Cumulative)
Table 4.17 Subsea Production & Processing Systems Water Depth Submarket Forecasts, 2016-2026 ($bn, AGR %, Cumulative)
Table 4.18 Subsea Production & Processing Systems Water Depth Submarket CAPEX CAGR Forecasts, 2017-2022, 2022-2027 and 2017-2027 (%)
Table 4.19 Shallow Water Subsea Production & Processing Systems Submarket Forecast, 2017-2027 ($bn, AGR %)
Table 4.20 The Shallow Water Subsea Production & Processing Systems Submarket Forecast by Region 2017-2027 ($m, AGR %, Cumulative)
Table 4.21 Shallow Water Subsea Production & Processing Systems Market Drivers and Restraints
Table 4.22 Shallow Water Subsea Production & Processing Systems Contracts (Project Name, Location, Client, Contractor, Contract Period, $m Value, Water Depth, Details)
Table 4.23 Deepwater Subsea Production & Processing Systems Submarket Forecast, 2017-2027 ($bn, AGR %)
Table 4.24 The Deepwater Subsea Production & Processing Systems Submarket Forecast by Region 2017-2027 ($m, AGR %, Cumulative)
Table 4.25 Deepwater Subsea Production & Processing Systems Market Drivers and Restraints
Table 4.26 Deepwater Subsea Production & Processing Systems Contracts (Project Name, Location, Client, Contractor, Contract Period, $m Value, Water Depth, Details)
Table 4.27 Ultra-Deepwater Subsea Production & Processing Systems Submarket Forecast, 2017-2027 ($bn, AGR %)
Table 4.28 The Ultra-Deepwater Subsea Production & Processing Systems Submarket Forecast by Region 2017-2027 ($m, AGR %, Cumulative)
Table 4.29 Ultra-Deepwater Subsea Production & Processing Systems Market Drivers and Restraints
Table 4.30 Ultra-Deepwater Subsea Production & Processing Systems Contracts (Project Name, Location, Client, Contractor, Contract Period, $m Value, Water Depth, Details)
Table 5.1 The African Subsea Production & Processing Systems Market Forecast, 2017-2027 ($bn, AGR %)
Table 5.2 African Subsea Production & Processing Systems Submarkets Forecast 2017-2027 ($m, AGR %, Cumulative)
Table 5.3 Drivers and Restraints in the African Subsea Production & Processing Systems Market
Table 5.4 Ultra-Deepwater Subsea Production & Processing Systems Contracts (Project Name, Location, Client, Contractor, Contract Period, $m Value, Water Depth, Details)
Table 5.5 Ultra-Deepwater Subsea Production & Processing Systems Contracts (Project Name, Location, Client, Contractor, Contract Period, $m Value, Water Depth, Details)
Table 6.1 The Asia Pacific Subsea Production & Processing Systems Market Forecast, 2017-2027 ($bn, AGR %)
Table 6.2 Asia Pacific Subsea Production & Processing Systems Submarkets Forecast 2017-2027 ($m, AGR %, Cumulative)
Table 6.3 Asia Pacific Offshore Oil and Gas Fields with Subsea Production & Processing Systems (Project, Field Type, First Production, Water Depth, Operator, Country)
Table 6.4 Drivers and Restraints in the Asia Pacific Subsea Production & Processing Systems Market
Table 6.5 Asia Pacific Subsea Production & Processing Systems Contracts (Project Name, Location, Client, Contractor, Contract Period, $m Value, Water Depth, Details)
Table 6.6 Potential Offshore Developments in Asia Pacific (Project, Operator, Water Depth, Country)
Table 7.1 The Gulf of Mexico Subsea Production & Processing Systems Market Forecast, 2017-2027 ($bn, AGR %)
Table 7.2 Gulf of Mexico Subsea Production & Processing Systems Submarkets Forecast 2017-2027 ($m, AGR %, Cumulative)
Table 7.3 Recent US Deepwater Projects (Field, Operator)
Table 7.4 Drivers and Restraints in the Gulf of Mexico Subsea Production & Processing Systems Market
Table 7.5 Gulf of Mexico Subsea Production & Processing Systems Contracts (Project Name, Location, Client, Contractor, Contract Period, $m Value, Water Depth, Details)
Table 7.6 Potential Offshore Developments in the Gulf of Mexico (Project, Operator, Water Depth, Country)
Table 8.1 The North Sea Subsea Production & Processing Systems Market Forecast, 2017-2027 ($bn, AGR %)
Table 8.2 North Sea Subsea Production & Processing Systems Submarkets Forecast 2017-2027 ($m, AGR %, Cumulative)
Table 8.3 Major North Sea Oil and Gas Fields with Subsea Production & Processing Systems (Project, Field Type, First Production, Water Depth, Operator, Country)
Table 8.4 Drivers and Restraints in the North Sea Subsea Production & Processing Systems Market
Table 8.5 UK Oil and Gas Exploration Taxes (Tax, Details)
Table 8.6 UK Tax Allowance Field Types
Table 8.7 North Sea Subsea Production & Processing Systems Contracts (Project Name, Location, Client, Contractor, Contract Period, $m Value, Water Depth, Details)
Table 8.8 Potential Offshore Developments in the North Sea (Field Name, Location, Operator, Water Depth, Expected Production)
Table 9.1 The South America Subsea Production & Processing Systems Market Forecast, 2017-2027 ($bn, AGR %)
Table 9.2 South America Subsea Production & Processing Systems Submarkets Forecast 2017-2027 ($m, AGR %, Cumulative)
Table 9.3 Brazilian FPSO Projects since 2010 (Name, Operator, Depth, Start Date, Completion Date)
Table 9.4 Drivers and Restraints in the South America Subsea Production & Processing Systems Market
Table 9.5 South America Subsea Production & Processing Systems Contracts (Project Name, Location, Client, Contractor, Contract Period, $m Value, Water Depth, Details)
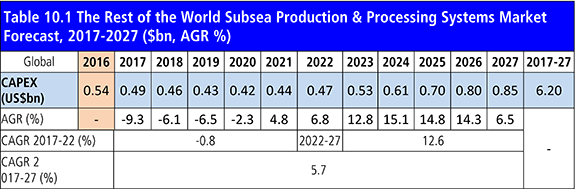
Table 10.1 The Rest of the World Subsea Production & Processing Systems Market Forecast, 2017-2027 ($bn, AGR %)
Table 10.2 Rest of the World Subsea Production & Processing Systems Submarkets Forecast 2017-2027 ($m, AGR %, Cumulative)
Table 10.3 Drivers and Restraints in the Rest of the World Subsea Production & Processing Systems Market
Table 10.4 Rest of the World Subsea Production & Processing Systems Contracts (Project Name, Location, Client, Contractor, Contract Period, $m Value, Water Depth, Details)
Table 10.5 Irish Offshore Fields with Subsea P&P Systems (Project, Majority Partner, Status)
Table 10.6 Irish Offshore Areas with Potential for Subsea P&P Systems (Field, Majority Partner, Water Depth, Estimated Reserves)
Table 13.1 Aker Solutions Profile 2016 (CEO, Total Company Sales US$m, Sales in the Market US$m, Share of Company Sales from Subsea Production & Processing Systems Market %, Net Income / Loss US$m, Net Capital Expenditure US$m, Strongest Business Region, Business Segment in the Market, HQ, Founded, No. of Employees, IR Contact, Ticker, Website)
Table 13.2 Aker Solutions Major Subsea Production & Processing Systems Contracts (Client, Project, Location, Award Date)
Table 13.3 Aker Solutions Total Company Sales 2010-2016 (US$m, AGR %)
Table 13.4 Aker Solutions Sales in the Subsea Production & Processing Systems Market 2010-2016 (US$m, AGR %)
Table 13.5 EZRA Holdings Limited Profile 2016 (CEO, Total Company Sales US$m, Sales in the Market US$m, Share of Company Sales from Subsea Production & Processing Systems Market %, Net Income / Loss US$m, Net Capital Expenditure US$m, Strongest Business Region, Business Segment in the Market, HQ, Founded, No. of Employees, IR Contact, Ticker, Website)
Table 13.6 EZRA Holdings Limited Major Subsea Production & Processing Systems Contracts (Client, Project, Location, Award Date)
Table 13.7 EZRA Holdings Limited Total Company Sales 2010-2016 (US$m, AGR %)
Table 13.8 EZRA Holdings Limited Sales in the Subsea Production & Processing Systems Market 2011-2016 (US$m, AGR %)
Table 13.9 TechnipFMC plc 2016 (CEO, Total Company Sales US$m, HQ, Founded, No. of Employees, IR Contact, Ticker, Website)
Table 13.10 FMC Technologies Major Subsea Production & Processing Systems Contracts (Project, Client, Year Awarded, Depth, Location)
Table 13.11 Technip Subsea Production & Processing Systems Contracts (Client, Project, Location, Award Year)
Table 13.12 Oceaneering International, Inc. Profile 2016 (CEO, Total Company Sales US$m, Sales in the Market US$m, Share of Company Sales from Subsea Production & Processing Systems Market %, Net Income / Loss US$m, Net Capital Expenditure US$m, Strongest Business Region, Business Segment in the Market, Submarket Involvement, HQ, Founded, No. of Employees, IR Contact, Ticker, Website)
Table 13.13 Oceaneering Service Divisions
Table 13.14 Oceaneering Subsea Production & Processing Systems Contracts (Client, Project, Location, Award Date)
Table 13.15 Oceaneering International, Inc. Total Company Sales 2010-2016 (US$m, AGR %)
Table 13.16 Oceaneering International, Inc. Sales in the Subsea Production & Processing Systems Market 2010-2016 (US$m, AGR %)
Table 13.17 Subsea 7 SA Profile 2016 (CEO, Total Company Sales US$m, Sales in the Market US$m, Share of Company Sales from Subsea Production & Processing Systems Market %, Net Income / Loss US$m, Net Capital Expenditure US$m, Strongest Business Region, Business Segment in the Market, HQ, Founded, No. of Employees, IR Contact, Ticker, Website)
Table 13.18 Subsea 7 Major Subsea Production & Processing Systems Contracts (Client, Project, Location, Award Year)
Table 13.19 Subsea 7 SA Total Company Sales 2010-2016 (US$m, AGR %)
Table 13.20 Subsea 7 SA Sales in the Subsea Production & Processing Systems Market 2010-2016 (US$m, AGR %)
Table 13.21 Saipem SpA Profile 2016 (CEO, Total Company Sales US$m, Net Income / Loss US$m, Net Capital Expenditure US$m, Strongest Business Region, Business Segment in the Market, HQ, Founded, No. of Employees, IR Contact, Ticker, Website)
Table 13.22 Saipem Major Subsea Production & Processing Systems Contracts (Client, Project, Location, Award Year)
Table 13.23 Saipem SpA Total Company Sales 2010-2016 (US$m, AGR %)
Table 13.24 General Electric Profile 2016 (CEO, Total Company Sales US$m, Sales in the Market US$m, Share of Company Sales from Subsea Production & Processing Systems Market %, Net Income / Loss US$m, Net Capital Expenditure US$m, Strongest Business Region, Business Segment in the Market, Submarket Involvement, HQ, Founded, No. of Employees, IR Contact, Ticker, Website)
Table 13.25 General Electric Major Subsea Production & Processing Systems Contracts (Client, Project, Location, Award Year)
Table 13.26 General Electric Corporation Total Company Sales 2011-2016 (US$m, AGR %)
Table 13.27 General Electric in the Subsea Production & Processing Systems Market 2011-2016 (US$m, AGR %)
Table 13.28 Halliburton Profile 2016 (CEO, Total Company Sales US$m, Sales in the Market US$m, Share of Company Sales from Subsea Production & Processing Systems Market %, Net Income / Loss US$m, Net Capital Expenditure US$m, Strongest Business Region, Business Segment in the Market, Submarket Involvement, HQ, Founded, No. of Employees, IR Contact, Ticker, Website)
Table 13.29 Halliburton Major Subsea Production & Processing Systems Contracts (Client, Project, Location, Award Year)
Table 13.30 Halliburton Total Company Sales 2010-2016 (US$m, AGR %)
Table 13.31 Halliburton in the Subsea Production & Processing Systems Market 2010-2016 (US$m, AGR %)
Table 13.32 Schlumberger Limited Profile 2016 (CEO, Total Company Sales US$m, Sales in the Market US$m, Share of Company Sales from Subsea Production & Processing Systems Market %, Net Income / Loss US$m, Net Capital Expenditure US$m, Strongest Business Region, Business Segment in the Market, Submarket Involvement, HQ, Founded, No. of Employees, IR Contact, Ticker, Website)
Table 13.33 Schlumberger Limited Major Subsea Production & Processing Systems Contracts (Client, Project, Location, Award Year)
Table 13.34 Schlumberger Limited Total Company Sales 2010-2016 (US$m, AGR %)
Table 13.35 Dril-Quip, Inc. Profile 2016 (CEO, Total Company Sales US$m, Sales in the Market US$m, Share of Company Sales from Subsea Production & Processing Systems Market %, Net Income / Loss US$m, Net Capital Expenditure US$m, Strongest Business Region, Business Segment in the Market, HQ, Founded, No. of Employees, IR Contact, Ticker, Website)
Table 13.36 Dril-Quip, Inc. Major Subsea Production & Processing Systems Contracts (Client, Project, Location, Award Year)
Table 13.37 Dril-Quip, Inc. Total Company Sales 2010-2016 (US$m, AGR %)
Table 13.38 Dril-Quip, Inc. in the Subsea Production & Processing Systems Market 2010-2016 (US$m, AGR %)
Table 13.39 Other Leading Companies in the Subsea Production & Processing Systems Market (Company, Activity)
Table 14.1 Regional Subsea Production and Processing Systems Market Forecast 2017-2027 (US$mn, AGR %, Cumulative)
Table 14.2 Subsea Production & Processing Systems Water Depth Submarket Forecast 2017-2027 (US$mn, AGR %, Cumulative)
Table 14.3 Subsea Production & Processing Systems Hardware Submarket Forecast 2017-2027 (US$mn, AGR %, Cumulative)
List of Figures
Figure 1.1 Global Oil and Gas Consumption Forecasts 2010-2040 (MMbpd, Tcf)
Figure 2.1 Global Subsea Production & Processing Systems Market Structure Overview
Figure 2.2 Subsea Production & Processing Flow Diagram
Figure 2.3 Subsea Production & Processing Historical Timeline
Figure 2.4 Subsea High-Voltage Cable and Fibre-Optic Cords in a Single Umbilical
Figure 2.5 Rate of Oil Recovery With and Without Pressure Boosting (Mbpd)
Figure 3.1 Global Subsea Production and Processing Systems Market Forecast, 2017-2027 ($bn, AGR %)
Figure 3.2 Regional Subsea Production and Processing Systems Market Forecast 2017-2027 ($bn)
Figure 3.3 Regional Subsea Production and Processing Systems Market Share Forecast 2017 (% Share)
Figure 3.4 Regional Subsea Production and Processing Systems Market Share Forecast 2022 (% Share)
Figure 3.5 Regional Subsea Production and Processing Systems Market Share Forecast 2027 (% Share)
Figure 3.6 Subsea Production and Processing Systems CAPEX per Regional Market 2017-2027 ($bn)
Figure 3.7 Cumulative CAPEX per Regional Subsea Production and Processing Systems Market 2017-2027 ($bn)
Figure 3.8 Regional Subsea Production and Processing Systems CAGR Forecast 2017-2027 (%)
Figure 3.9 Barriers to Entry vs Regional Market Size vs CAGR 2017-2027 ($bn, CAGR %)
Figure 3.10 WTI and Brent Oil Prices 2003-2014 ($/bbl)
Figure 3.11 Weekly WTI and Brent Oil Prices (January 2014 – August 2015 ($/bbl)
Figure 3.12 Chinese and Indian Annual GDP Growth 2005-2014 (%)
Figure 3.13 US Refined Product Consumption January 2014 to June 2015 Four-Week Average (Mbpd)
Figure 3.14 Visiongain’s Anticipated Brent Crude Oil Average Spot Price, 2017, 2018, 2019-2021, 2022-2024, 2025-2027 ($/bbl)
Figure 3.15 UK and Norwegian Oil Production 1994-2014 (Mbpd)
Figure 3.16 Cyclic SURF Technological Growth
Figure 4.1 Subsea Production & Processing Systems Hardware Submarket Forecasts, 2017-2027 ($bn)
Figure 4.2 Subsea Production & Processing Systems Hardware CAPEX Share Forecast, 2017 (%)
Figure 4.3 Subsea Production & Processing Systems Hardware CAPEX Share Forecast, 2022 (%)
Figure 4.4 Subsea Production & Processing Systems Hardware CAPEX Share Forecast, 2027 (%)
Figure 4.5 Total CAPEX per Subsea Production & Processing Systems Hardware, 2017-2027 ($bn)
Figure 4.6 Umbilicals Submarket Forecast, 2017-2027 ($bn, AGR %)
Figure 4.7 Umbilicals Market Share Forecast 2017, 2022 and 2027 (% Share)
Figure 4.8 The Umbilicals Submarket CAPEX Share Forecast by Region, 2017 (%)
Figure 4.9 The Umbilicals Submarket CAPEX Share Forecast by Region, 2022 (%)
Figure 4.10 The Umbilicals Submarket CAPEX Share Forecast by Region, 2027 (%)
Figure 4.11 The Umbilicals Submarket Forecast by Region 2017-2027 ($bn)
Figure 4.12 Risers Submarket Forecast, 2016-2026 ($bn, AGR %)
Figure 4.13 Risers Market Share Forecast 2017, 2022 and 2027 (% Share)
Figure 4.14 The Risers Submarket CAPEX Share Forecast by Region, 2017 (%)
Figure 4.15 The Risers Submarket CAPEX Share Forecast by Region, 2022 (%)
Figure 4.16 The Risers Submarket CAPEX Share Forecast by Region, 2027 (%)
Figure 4.17 The Risers Submarket Forecast by Region 2017-2027 ($bn)
Figure 4.18 Flowlines Submarket Forecast, 2016-2026 ($bn, AGR %)
Figure 4.19 Flowlines Market Share Forecast 2017, 2022 and 2027 (% Share)
Figure 4.20 The Flowlines Submarket CAPEX Share Forecast by Region, 2017 (%)
Figure 4.21 The Flowlines Submarket CAPEX Share Forecast by Region, 2022 (%)
Figure 4.22 The Flowlines Submarket CAPEX Share Forecast by Region, 2027 (%)
Figure 4.23 The Flowlines Submarket Forecast by Region 2017-2027 ($bn)
Figure 4.24 Controls Submarket Forecast, 2016-2026 ($bn, AGR %)
Figure 4.25 Controls Market Share Forecast 2017, 2022 and 2027 (% Share)
Figure 4.26 The Controls Submarket CAPEX Share Forecast by Region, 2017 (%)
Figure 4.27 The Controls Submarket CAPEX Share Forecast by Region, 2022 (%)
Figure 4.28 The Controls Submarket CAPEX Share Forecast by Region, 2027 (%)
Figure 4.29 The Controls Submarket Forecast by Region 2017-2027 ($bn)
Figure 4.30 Trees Submarket Forecast, 2016-2026 ($bn, AGR %)
Figure 4.31 Trees Market Share Forecast 2017, 2022 and 2027 (% Share)
Figure 4.32 The Trees Submarket CAPEX Share Forecast by Region, 2017 (%)
Figure 4.33 The Trees Submarket CAPEX Share Forecast by Region, 2022 (%)
Figure 4.34 The Trees Submarket CAPEX Share Forecast by Region, 2027 (%)
Figure 4.35 The Trees Submarket Forecast by Region 2017-2027 ($bn)
Figure 4.36 Manifolds Submarket Forecast, 2016-2026 ($bn, AGR %)
Figure 4.37 Manifolds Market Share Forecast 2017, 2022 and 2027 (% Share)
Figure 4.38 The Manifolds Submarket CAPEX Share Forecast by Region, 2017 (%)
Figure 4.39 The Manifolds Submarket CAPEX Share Forecast by Region, 2022 (%)
Figure 4.40 The Manifolds Submarket CAPEX Share Forecast by Region, 2027 (%)
Figure 4.41 The Manifolds Submarket Forecast by Region 2017-2027 ($bn)
Figure 4.42 Tie-Ins Submarket Forecast, 2016-2026 ($bn, AGR %)
Figure 4.43 Tie-Ins Market Share Forecast 2017, 2022 and 2027 (% Share)
Figure 4.44 The Tie-Ins Submarket CAPEX Share Forecast by Region, 2017 (%)
Figure 4.45 The Tie-Ins Submarket CAPEX Share Forecast by Region, 2022 (%)
Figure 4.46 The Tie-Ins Submarket CAPEX Share Forecast by Region, 2027 (%)
Figure 4.47 The Tie-Ins Submarket Forecast by Region 2017-2027 ($bn)
Figure 4.48 Subsea Production & Processing Systems Water Depth Submarket Forecasts, 2017-2027 ($bn)
Figure 4.49 Total CAPEX per Subsea Production & Processing Systems Water Depth, 2017-2027 ($bn)
Figure 4.50 Shallow Water, Deepwater and Ultra-Deepwater Subsea Production & Processing Systems CAPEX Share Forecast, 2017 (%)
Figure 4.51 Shallow Water, Deepwater and Ultra-Deepwater Subsea Production & Processing Systems CAPEX Share Forecast, 2022 (%)
Figure 4.52 Shallow Water, Deepwater and Ultra-Deepwater Subsea Production & Processing Systems CAPEX Share Forecast, 2027 (%)
Figure 4.53 Shallow Water Subsea Production & Processing Systems Submarket Forecast, 2017-2027 ($bn, AGR %)
Figure 4.54 Shallow Water Subsea Production & Processing Systems Market Share Forecast 2017, 2022 and 2027 (% Share)
Figure 4.55 The Shallow Water Subsea Production & Processing Systems CAPEX Share Forecast by Region, 2017 (%)
Figure 4.56 The Shallow Water Subsea Production & Processing Systems CAPEX Share Forecast by Region, 2022 (%)
Figure 4.57 The Shallow Water Regional Subsea Production & Processing Systems CAPEX Share Forecast by Region, 2027 (%)
Figure 4.58 The Shallow Water Subsea Production & Processing Systems Submarket Forecast by Region 2017-2027 ($bn)
Figure 4.59 Deepwater Subsea Production & Processing Systems Submarket Forecast, 2017-2027 ($bn, AGR %)
Figure 4.60 Deepwater Subsea Production & Processing Systems Market Share Forecast 2017, 2022 and 2027 (% Share)
Figure 4.61 The Deepwater Subsea Production & Processing Systems CAPEX Share Forecast by Region, 2017 (%)
Figure 4.62 The Deepwater Subsea Production & Processing Systems CAPEX Share Forecast by Region, 2022 (%)
Figure 4.63 The Deepwater Regional Subsea Production & Processing Systems CAPEX Share Forecast by Region, 2027 (%)
Figure 4.64 The Deepwater Subsea Production & Processing Systems Submarket Forecast by Region 2017-2027 ($bn)
Figure 4.65 Ultra-Deepwater Subsea Production & Processing Systems Submarket Forecast, 2017-2027 ($bn, AGR %)
Figure 4.66 Ultra-Deepwater Subsea Production & Processing Systems Market Share Forecast 2017, 2022 and 2027 (% Share)
Figure 4.67 The Ultra-Deepwater Subsea Production & Processing Systems CAPEX Share Forecast by Region, 2017 (%)
Figure 4.68 The Ultra-Deepwater Subsea Production & Processing Systems CAPEX Share Forecast by Region, 2022 (%)
Figure 4.69 The Ultra-Deepwater Regional Subsea Production & Processing Systems CAPEX Share Forecast by Region, 2027 (%)
Figure 4.70 The Ultra-Deepwater Subsea Production & Processing Systems Submarket Forecast by Region 2017-2027 ($bn)
Figure 5.1 The African Subsea Production & Processing Systems Market Forecast, 2017-2027 ($bn, AGR %)
Figure 5.2 The African Subsea Production & Processing Systems Market Share Forecast 2017, 2022 and 2027 (% Share)
Figure 5.3 African Subsea Production & Processing Systems Water Depth Submarket Forecast 2017-2027 ($bn)
Figure 5.4 African Subsea Production & Processing Systems Hardware Submarket Forecast 2017-2027 (US$bn)
Figure 5.5 Nigerian and Angolan Oil Production 1994-2014 (Mbpd)
Figure 6.1 The Asia Pacific Subsea Production & Processing Systems Market Forecast, 2017-2027 ($bn, AGR %)
Figure 6.2 The Asia Pacific Subsea Production & Processing Systems Market Share Forecast 2017, 2022 and 2027 (% Share)
Figure 6.3 Asia Pacific Subsea Production & Processing Systems Water Depth Submarket Forecast 2017-2027 ($bn)
Figure 6.4 Asia Pacific Subsea Production & Processing Systems Hardware Submarket Forecast 2017-2027 (US$bn)
Figure 6.5 Australian Oil and Natural Gas Production 1993-2013 (Mbpd, Bcf)
Figure 6.6 Indonesian Oil Production 1994-2014 (Mbpd)
Figure 7.1 The Gulf of Mexico Subsea Production & Processing Systems Market Forecast, 2017-2027 ($bn, AGR %)
Figure 7.2 The Gulf of Mexico Subsea Production & Processing Systems Market Share Forecast 2017, 2022 and 2027 (% Share)
Figure 7.3 Gulf of Mexico Subsea Production & Processing Systems Water Depth Submarket Forecast 2017-2027 ($bn)
Figure 7.4 Gulf of Mexico Subsea Production & Processing Systems Hardware Submarket Forecast 2017-2027 (US$bn)
Figure 7.5 Location of Active Offshore Oil and Gas Platforms in the US Gulf of Mexico
Figure 7.6 US Onshore and Offshore Crude Oil Production 1994-2014 (Mbpd)
Figure 8.1 The North Sea Subsea Production & Processing Systems Market Forecast, 2017-2027 ($bn, AGR %)
Figure 8.2 The North Sea Subsea Production & Processing Systems Market Share Forecast 2017, 2022 and 2027 (% Share)
Figure 8.3 North Sea Subsea Production & Processing Systems Water Depth Submarket Forecast 2017-2027 ($bn)
Figure 8.4 North Sea Subsea Production & Processing Systems Hardware Submarket Forecast 2017-2027 (US$bn)
Figure 8.5 Norwegian Oil Production, Estimated Net Exports and Proved Reserves 1980-2013 (Mbpd, Bbbls)
Figure 8.6 The Number of Norwegian Exploration Wells Drilled 1970-2014
Figure 8.7 The Number of UK Exploration Wells Drilled 2000-2014
Figure 9.1 The South America Subsea Production & Processing Systems Market Forecast, 2017-2027 ($bn, AGR %)
Figure 9.2 The South America Subsea Production & Processing Systems Market Share Forecast 2017, 2022 and 2027 (% Share)
Figure 9.3 South America Subsea Production & Processing Systems Water Depth Submarket Forecast 2017-2027 ($bn)
Figure 9.4 South America Subsea Production & Processing Systems Hardware Submarket Forecast 2017-2027 (US$bn)
Figure 10.1 The Rest of the World Subsea Production & Processing Systems Market Forecast, 2017-2027 ($bn, AGR %)
Figure 10.2 The Rest of the World Subsea Production & Processing Systems Market Share Forecast 2017, 2022 and 2027 (% Share)
Figure 10.3 Rest of the World Subsea Production & Processing Systems Water Depth Submarket Forecast 2017-2027 ($bn)
Figure 10.4 Rest of the World Subsea Production & Processing Systems Hardware Submarket Forecast 2017-2027 (US$bn)
Figure 13.1 Aker Solutions Total Company Sales 2011-2016 (US$m, AGR %)
Figure 13.2 Aker Solutions Sales in the Subsea Production & Processing Systems Market 2011-2015 (US$m, AGR %)
Figure 13.3 EZRA Holdings Limited Total Company Sales 2011-2016 (US$m, AGR %)
Figure 13.4 EZRA Holdings Limited Sales in the Subsea Production & Processing Systems Market 2011-2016 (US$m, AGR %)
Figure 13.5 Oceaneering International, Inc. Total Company Sales 2011-2016 (US$m, AGR %)
Figure 13.6 Oceaneering International, Inc. Sales in the Subsea Production & Processing Systems Market 2011-2016 (US$m, AGR %)
Figure 13.7 Subsea 7 SA Total Company Sales 2011-2016 (US$m, AGR %)
Figure 13.8 Subsea 7 SA Sales in the Subsea Production & Processing Systems Market 2011-2016 (US$m, AGR %)
Figure 13.9 Saipem SpA Total Company Sales 2011-2016 (US$m, AGR %)
Figure 13.10 General Electric Total Company Sales 2012-2016 (US$m, AGR %)
Figure 13.11 General Electric Sales in the Subsea Production & Processing Systems Market 2012-2016 (US$m, AGR %)
Figure 13.12 Halliburton Total Company Sales 2011-2016 (US$m, AGR %)
Figure 13.13 Halliburton Sales in the Subsea Production & Processing Systems Market 2011-2016 (US$m, AGR %)
Figure 13.14 Schlumberger Limited Company Sales 2011-2016 (US$m, AGR %)
Figure 13.15 Dril-Quip, Inc. Company Sales 2011-2016 (US$m, AGR %)
Figure 13.16 Dril-Quip, Inc. Sales in the Subsea Production & Processing Systems Market 2011-2016 (US$m, AGR %)
2H Offshore
A/S Norske Shell
ABB
ABB Vetco Gray
ABYSSEA
Acergy
Acteon Group
Afren
AGR Group
Airborne Oil & Gas
Aker Solutions
Amerada Hess
Anadarko
Angoflex
Apache Corporation
Aquaterra Energy
Ariosh
ATP Oil & Gas
Australian Worldwide Exploration
Aveon Offshore
Avner
BG Group
BHP Billiton
Bluewater Industries
BP
Bridge Energy ASA
Britannia Operator
Burullus Gas Company
Cabinda Gulf
Cairn Energy
Calder
Cameron International
Cardon IV
Centrica
Ceona
Chevron
China National Offshore Oil Corporation (CNOOC)
China National Petroleum Corporation (CNPC)
China Offshore Oil Engineering Company (COOEC)
Chiyoda
Claxton
CNR International
Coastal Energy
Cobalt International Energy
ConocoPhillips
Daewoo Shipping and Marine Engineering (DSME)
Dana Petroleum
DeepSea
DeepTrend
Delek
Delmar Systems
Det Norske Oljeselskap
DOF Subsea
DONG Energy
Drill-Quip
Dubai Petroleum Establishment
DUCO
Duxvalves
E.ON
EOG Resources
Egyptian Natural Gas (EGAS),
Elf Exploration UK
EMAS AMC
Encana Corporation
Eni
EnQuest
EOG Resources
Esso
ExxonMobil
Ezra Holdings
First Subsea
Flexibras Vitoria Company
Flexlife
FMC Technologies
Foster Wheeler
Freeport-McMoRan
Galoc Production Company
Gaz de France
Gazprom
GDF Suez
GE Oil & Gas
Ghana National Petroleum Corporation (GNPC)
Gorgon Upstream
Harvest Natural Resources
Heerema Marine Contractors
Hess
Hibernia Management and Development Company
Hitachi Heavy Industries
Hoegh
Husky Energy
Hydra Offshore
Hyundai Heavy Industries (HHI)
INPEX
Ithaca Energy
ITP Interpipe
JDR Cable Systems
JX Nippon
Kangean Energy Indonesia (KEI)
Kosmos Energy
Koso Kent Introl
Lagos Deep Offshore Logistics (LADOL)
Lam Son JOC
LLOG Exploration Offshore
Lundin Petroleum
Lukoil
Maersk Group
Malaysia Marine and Heavy Engineering
Marathon Oil
McDermott
Murphy Oil
Newfield
Nexans
Nexen Petroleum
Nigerian National Petroleum Corporation (NNPC)
Noble Energy
Ocean Installer
Oceaneering
Oil and Natural Gas Corporation (ONGC)
OMV
OneSubsea
Ophir Energy
OSX EBX Group
Parker
Petróleo Brasileiro (Petrobras)
Petróleos de Venezuela (PDVSA)
Petróleos Mexicanos (PEMEX)
Petrofac
Petroliam Nasional Berhad (Petronas)
Petromin
PetroVietnam Technical Services Corporation (PTSC)
PetroVietnam Exploration and Production Company (PVEP)
Premier Oil
Principia
Providence Resources
Prysmian Group
PTSC Mechanical and Construction
PTT Exploration and Production
QGOG Constellation
Ratio
Reliance Industries
Repsol
Risertec
Roc Oil
Rosneft
Royal Dutch Shell
Royal Niger Company
RWE Dea
Sabre Oil and Gas
Saipem
Salamander Energy
Samsung Heavy Industries
Santos
Sapetro
SapuraAcergy
Sarawak Shell Berhad
Schlumberger
Sea Trucks Group
Sinopec
Société Nationale des Hydrocarbures (Cameroon)
Solartron
Statoil
Stolt Offshore
Stone Energy
Subsea 7
Subsea Riser Products
Suncor Energy
Swiber Offshore
Talisman Energy
TAQA Bratani
Technip
Teekay
TNK-BP
Total
Tripatra Engineers & Constructors
Tullow Oil Plc
Vallourec
Venture Production
Vitol Upstream
Wellstream
West African Ventures
Wintershall
Wood Group Kenny
Woodside Energy
Xstate Resources
Yinka Folawiyo Petroleum
Government Agencies and Other Organisations Mentioned in this Report
American Petroleum Institute (API)
Bureau of Ocean Energy Management (BOEM)
Bureau of Safety and Environmental Enforcement (BOEE)
Danish Energy Agency (DEA)
Department of Energy & Climate Change (DECC)
Helix Well Containment Group (HWCG)
Independent Petroleum Association of America (IPAA)
International Association of Oil & Gas Producers (IOGP)
Marine Well Containment Company (MWCC)
Movement for the Emancipation of the Niger Delta (MEND)
National Ocean Industries Association (NOIA)
National Union for the Total Independence of Angola (UNITA)
Nigerian Content Development and Monitoring Board
Nigerian Ministry of Petroleum Resources
Norwegian Centres of Expertise (NCE)
Norwegian Petroleum Directorate
Organisation of Petroleum Exporting Countries (OPEC)
Popular Movement for the Liberation of Angola (MPLA)
Subsea Energy Australia (SEA)
Subsea UK
Umbilical Manufacturers Federation
United States Oil and Gas Association (USOGA)
US Energy Information Administration (EIA)
US Environmental Protection Agency (EPA)
World Bank
Download sample pages
Complete the form below to download your free sample pages for Subsea Production & Processing Systems Market 2017-2027Download sample pages
Complete the form below to download your free sample pages for Subsea Production & Processing Systems Market 2017-2027Do you have any custom requirements we can help you with?
Any specific country, geo region, market segment or specific company information?
Email us today, we can discuss your needs and see how we can help: jamie.roberts@visiongain.com
Would you like a free report overview of the report of your choice?
If so, please drop an email to Jamie Roberts stating your chosen report title to jamie.roberts@visiongain.com
Visiongain energy reports are compiled using a broad and rich mixture of both primary and secondary information to produce an overall industry outlook. In order to provide our clients with the best product possible product, we do not rely on any one single source of information. Visiongain analysts reach out to market-leading vendors and industry experts where possible but also review a wealth of financial data and product information from a vast range of sources. To find out more about our reports methodology, please email jamie.roberts@visiongain.com
Would you like to get the latest Visiongain energy reports catalogue?
What are the dynamic growth sectors? where are the regional business opportunities?
Which technologies will prevail and who are the leading companies succeeding in these sectors and why?
If you want definitive answers to business critical questions, discover Visiongain’s full range of business intelligence reports.
If so, please email Jamie Roberts on jamie.roberts@visiongain.com or call her today on +44 207 336 6100
“The Visiongain report was extremely insightful and helped us construct our basic go-to market strategy for our solution.”
H.
“F.B has used Visiongain to prepare two separate market studies on the ceramic proppants market over the last 12 months. These reports have been professionally researched and written and have assisted FBX greatly in developing its business strategy and investment plans.”
F.B
“We just received your very interesting report on the Energy Storage Technologies (EST) Market and this is a very impressive and useful document on that subject.”
I.E.N
“Visiongain does an outstanding job on putting the reports together and provides valuable insight at the right informative level for our needs. The EOR Visiongain report provided confirmation and market outlook data for EOR in MENA with the leading countries being Oman, Kuwait and eventually Saudi Arabia.”
E.S
“Visiongain produced a comprehensive, well-structured GTL Market report striking a good balance between scope and detail, global and local perspective, large and small industry segments. It is an informative forecast, useful for practitioners as a trusted and upto-date reference.”
Y.N Ltd
Association of Dutch Suppliers in the Oil & Gas Industry
Society of Naval Architects & Marine Engineers
Association of Diving Contractors
Association of Diving Contractors International
Associazione Imprese Subacquee Italiane
Australian Petroleum Production & Exploration Association
Brazilian Association of Offshore Support Companies
Brazilian Petroleum Institute
Canadian Energy Pipeline
Diving Medical Advisory Committee
European Diving Technology Committee
French Oil and Gas Industry Council
IMarEST – Institute of Marine Engineering, Science & Technology
International Association of Drilling Contractors
International Association of Geophysical Contractors
International Association of Oil & Gas Producers
International Chamber of Shipping
International Shipping Federation
International Marine Contractors Association
International Tanker Owners Pollution Federation
Leading Oil & Gas Industry Competitiveness
Maritime Energy Association
National Ocean Industries Association
Netherlands Oil and Gas Exploration and Production Association
NOF Energy
Norsk olje og gass Norwegian Oil and Gas Association
Offshore Contractors’ Association
Offshore Mechanical Handling Equipment Committee
Oil & Gas UK
Oil Companies International Marine Forum
Ontario Petroleum Institute
Organisation of the Petroleum Exporting Countries
Regional Association of Oil and Natural Gas Companies in Latin America and the Caribbean
Society for Underwater Technology
Society of Maritime Industries
Society of Petroleum Engineers
Society of Petroleum Enginners – Calgary
Step Change in Safety
Subsea UK
The East of England Energy Group
UK Petroleum Industry Association
All the events postponed due to COVID-19.
Latest Energy news
Visiongain Publishes Carbon Capture Utilisation and Storage (CCUS) Market Report 2024-2034
The global carbon capture utilisation and storage (CCUS) market was valued at US$3.75 billion in 2023 and is projected to grow at a CAGR of 20.6% during the forecast period 2024-2034.
19 April 2024
Visiongain Publishes Liquid Biofuels Market Report 2024-2034
The global Liquid Biofuels market was valued at US$90.7 billion in 2023 and is projected to grow at a CAGR of 6.7% during the forecast period 2024-2034.
03 April 2024
Visiongain Publishes Hydrogen Generation Market Report 2024-2034
The global Hydrogen Generation market was valued at US$162.3 billion in 2023 and is projected to grow at a CAGR of 3.7% during the forecast period 2024-2034.
28 March 2024
Visiongain Publishes Biofuel Industry Market Report 2024-2034
The global Biofuel Industry market was valued at US$123.2 billion in 2023 and is projected to grow at a CAGR of 7.6% during the forecast period 2024-2034.
27 March 2024


