This latest report by business intelligence provider Visiongain assesses that Oil Well Christmas Tree Market spending will reach more than USD 32.7 billion by 2030. A Christmas tree is a vertical assembly of mechanical elements including valves, pressure gages, spools, and chokes fitted to the wellhead of completed wells used in oil exploration and manufacturing. To promote flow control, these are either installed on ground ceilings and submerged oil and gas wells. The device takes its title from its Christmas tree-like form.
Increase in global rig count is contributing to the growth of the market
Rigs are important determinants of the oil drilling industry’s results and provide energy-related businesses with economic health information. The increase in number of rigs is directly proportional to the number of investors and energy-related firms investing in the oil and gas industry’s activities. As a result, the quickly increasing worldwide crane count will eventually contribute to increased supply for oil and gas machinery and, in addition, will foster development in the oil well Christmas tree industry during the forecast period.
During the 2020–2030 forecast period, the market christmas tree is expected to grow at a CAGR of about 8.70 percent. It is anticipated that factors such as declining operating costs and growing exploitation of illicit resources will fuel the industry being researched in the coming years. However, absence of investment in the marine oil & gas sector owing to the industry’s downturn in mid-2014, together with increased onshore manufacturing from the United States, is anticipated to hamper the development of the Christmas tree market, especially in the overseas sector over the current era.
The onshore sector accounted for the largest market share in 2020, with most demand coming from countries like the U.S. and India. A large number of discoveries in the countries of South America, such as Guyana and Trinidad and Tobago, have made the region one of the discovery leading regions, creating ample opportunities for the manufacturers of Christmas tree. During the forecast period, North America experienced important development with the bulk of supply coming from the US.
It is therefore critical that you have your timescales correct and your forecasting plans ready. This report will ensure that you do. Visiongain’s report will ensure that you keep informed and ahead of your competitors. Gain that competitive advantage.
Global Oil Well Christmas Tree Market research provides a fundamental overview of the industry, including definitions, classifications, applications and the structure of the industrial chain. Also, the business study calculates the magnitude of the industry, the study takes into account the income produced from this report’s revenues and techniques from different implementation sections. The report provides a comprehensive overview of key market elements and elements such as drivers, past and present-day current trends, supervisory scenario, and technological growth.
A Christmas tree is a vertical installation of mechanical components, including valves, strain gages, spools and chokes, attached to the well of tanks used for oil exploration and production. These are either fitted on surface walls and underwater oil and gas wells to facilitate flow control. The equipment gets its name from its shape, which resembles a Christmas Tree.
Read on to discover how you can exploit the future business opportunities emerging in this sector. Visiongain’s new study tells you and tells you NOW. The 211-pages report provides clear, detailed insight into the global Oil Well Christmas Tree market. Discover the key drivers and challenges affecting the market.
By ordering and reading our brand-new report today, you stay better informed and ready to act.
Report Scope
The report delivers considerable added value by revealing:
57 tables, charts and graphs are analyzing and revealing the growth prospects and outlook for the Oil Well Christmas Tree market.
Global Oil Well Christmas Tree market forecasts and analysis from 2020-2030.
Oil Well Christmas Tree market provides revenue estimates, forecasts and analysis from 2020-2030 for Oil Well Christmas Tree submarkets:
Forecasts and analysis of Oil Well Christmas Tree market by Product between 2020-2030
Flowing Well Oil Christmas Tree Market, 2020-2030
ESP Well Oil Christmas Tree Market, 2020-2030
Screw Pump Well Oil Christmas Tree Market, 2020-2030
Water Injection Well Oil Christmas Tree Market, 2020-2030
Gas-Lift Well Oil Christmas Tree Market, 2020-2030
Others Products Market, 2020-2030
Forecasts and analysis of Oil Well Christmas Tree market by Type between 2020-2030
HPHT Christmas Trees Market, 2020-2030
Horizontal Christmas Trees Market, 2020-2030
Vertical Christmas Trees Market, 2020-2030
Other Type Market, 2020-2030
Forecasts and analysis of Oil Well Christmas Tree market by Deployment between 2020-2030
Onshore Market, 2020-2030
Offshore Market, 2020-2030
Other Market, 2020-2030
Regional Oil Well Christmas Tree market forecasts from 2020-2030 with drivers and restraints for the countries including:
Geographic Breakdown
Focused regional forecasts and analysis explore the future opportunities:
North America Market, 2020-2030
US Market, 2020-2030
Canada Market, 2020-2030
Europe Market, 2020-2030
The UK Market, 2020-2030
Germany Market, 2020-2030
France Market, 2020-2030
Italy Market, 2020-2030
Spain Market, 2020-2030
Rest of Europe Market, 2020-2030
Asia-Pacific Market, 2020-2030
China Market, 2020-2030
India Market, 2020-2030
Japan Market, 2020-2030
Australia & New Zealand Market, 2020-2030
Rest of Asia-Pacific Market, 2020-2030
LAMEA Market, 2020-2030
Latin America Market, 2020-2030
Middle East Market, 2020-2030
Africa Market, 2020-2030

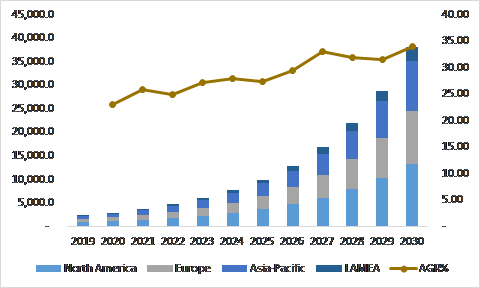
Figure:- Oil Well Christmas Tree Market Size and Forecast by Region, 2020-2030
Due to the increasing exploration and production activities in the United States, the North America region is expected to witness significant growth over the forecast period. The United States has one of the biggest shale gas stocks that can be technically recovered and the world’s second biggest tight oil reserves. Technological development in hydraulic fracturing and small breakeven rates has backed the onshore region’s offshore oil and gas operation, leading in strong supply for oilfield materials such as Christmas tree.
At the beginning of 2018, the Trump administration announced the opening for oil and gas exploration and production of 98 percent of coastal water, which was not permitted under Obama’s government. It is anticipated that the announcement will fuel long-term supply for Christmas tree in the overseas industry. Canada is North America’s second-largest region, responsible for about 23 percent and 17.5 percent of the region’s crude oil and natural gas as of 2019.
Western Canada accounts for approximately 95% of the total production of the nation. It is expected that conventional production will remain flat in the coming years until 2035, rising from 1.32 million b / d in 2019 to 1.33 million b / d. However, the U.S. oil and gas industry in Canada is facing a ton of difficulty. US President Donald Trump’s administration’s tax changes and loosening of legislative frameworks are causing more and more businesses to move west.
Such factors are expected to result in lower investment in 2020 compared to 2019 and hamper the growth in Canadian market demand for Christmas trees. The state is currently operating on 40 to 50 regulatory, strategy and judicial problems, and a significant amount of significant problems that will affect the competitiveness of the nation and how it does its company.
Company profiles for the leading Oil Well Christmas Tree companies
Company Profiles of Leading Players
TechnipFMC plc
Baker Hughes a GE Company
Schlumberger Limited
Aker Solutions
Dril-Quip
GENERAL ELECTRIC
Halliburton
Schlumberger
TechnipFMC
Yantai Jereh Petroleum Equipment & Technologies Co. Ltd
Worldwide Oilfield Machine
Other Key Players in the market
Aker Solutions
Dril-Quip Inc.
Shengji Group
INTERA Ltd
Axon Energy Products
Worldwide Oilfield Machine, Inc
Warren Controls Corp.
American Completion Tools, Inc.
Delta Pacific Valve Mfg. Co.
Palmer Engineering International, LLC
FMC Corp., Petroleum Equipment & Systems Div.
Sturdy Power Industries Ltd.
Vetco Gray, Inc. –
Vetco Gray, Inc.
Jianhu Jielin Petrochemical Machinery Co., Ltd.
Dezhou Saigao Petroleum Machinery Co., Ltd.
Chengdu Zhijin Machinery Equipment Co., Ltd.
Chance Door International Co., Ltd.
Shaanxi FYPE Rigid Machinery Co., Ltd.
Wise Channel Industries Limited
Jinan Paiwo Engineering Machinery Co., Ltd.
Yancheng Qihang Petroleum Machinery Co., Ltd
JOC Machinery Company Limited
JIANGSU YOUYAO PETROLEUM MACHINERY CO., LTD.
V&C Industrial Co., Ltd.
Jinhu Weidong Machinery Co., Ltd.
Xincheng Petroleum Technique Co., Ltd. Dongying
Shanghai WIN Mechanical Technology Co., Ltd.
Hengsheng Forge Co., Ltd.
Anhui Bonway Imp & Exp Co Ltd
Luoyang Runcheng Petrochemical Equipment Co., Ltd
Shanghai Yuying Machinery Technology Co., Ltd.
Shanghai Elim Petroleum Machinery Co., Ltd.
JIANGSU LIANGYI CO., LIMITED
Fangyuan Valve Group Co., Ltd.
Tianjin Elegant Technology Co., Ltd.
Conclusions and recommendations which will aid decision-making
How will you benefit from this report?
Keep your knowledge base up to speed. Don’t get left behind
Reinforce your strategic decision-making with definitive and reliable market data
Learn how to exploit new technological trends
Realise your company’s full potential within the market
Understand the competitive landscape and identify potential new business opportunities & partnerships
Who should read this report?
Anyone with involvement in the Oil Well Christmas Tree
Energy operators
Engineering contractors
Investment managers
Arbitrage companies and divisions
Energy price reporting companies
Energy company managers
Energy consultants
Energy company executives and analysts
Heads of strategic development
Business development managers
Marketing managers
Market analysts,
Technologists
Suppliers
Investors
Banks
Government agencies
Visiongain’s study is intended for anyone requiring commercial analyses for the Oil Well Christmas Tree market and leading companies. You find data, trends and predictions.
Buy our report today the Oil Well Christmas Tree Market Forecast 2020-2030. Avoid missing out by staying informed – get our report now.
Visiongain is a trading partner with the US Federal Government
CCR Ref number: KD4R6
Do you have any custom requirements we can help you with? Any need for specific country, geo region, market segment or specific company information? Contact us today, we can discuss your needs and see how we can help sara.peerun@visiongain.com
Report Overview
1.1 Global Oil Well Christmas Tree Market
1.2 Global Oil Well Christmas Tree Market Overview
1.3 Global Oil Well Christmas Tree Market Segmentation
1.4 The Emergence of Oil Well Christmas Tree in the Industry
1.5 Why You Should Read This Report
1.6 How This Report Delivers
1.7 Key Questions Answered by This Analytical Report
1.8 Methodology
1.8.1 Secondary Research
1.8.2 Market Evaluation & Forecasting Methodology
1.9 Frequently Asked Questions (FAQ)
1.10 Associated Visiongain Reports
1.11 About Visiongain
2. Introduction to Oil Well Christmas Tree Market
2.1 Market Definition
2.2 Industry Outlook
2.3 Value Chain Analysis
2.4 Industry Structure
2.5 Current Status & Trends
2.6 Demand & Supply Analysis
2.7 Trade Analysis
2.8 Price Trend Analysis
3. Global Oil Well Christmas Tree Market Analysis
3.1 PEST Analysis of the Oil Well Christmas Tree Market
3.2 Expert Opinion
3.2.1 Primary Correspondents
3.3 Market Outlook
3.4 Drivers & Restraints
3.5 Dominant Region/Country
3.6 Market Scenario
3.7 Overall Growth Rate, Globally
3.8 SWOT Analysis of the Oil Well Christmas Tree Market
3.8.1 Strengths
3.8.2 Weaknesses
3.8.3 Opportunities
3.8.4 Threats
3.9 Porter’s Five Forces Analysis
3.9.1 Competitive Rivalry
3.9.2 Supplier Power
3.9.3 Buyer Power
3.9.4 Threat of Substitute
3..9.5 Threat of New Entrant
4. Oil Well Christmas Tree: Global Market Analysis by Segments
4.1 Global Oil Well Christmas Tree Market Forecast, by Product 2020-2030
4.1.1 Product Overview
4.1.2 Flowing Well Oil Christmas Tree Market, 2020-2030
4.1.3 ESP Well Oil Christmas Tree Market, 2020-2030
4.1.4 Screw Pump Well Oil Christmas Tree Market, 2020-2030
4.1.5 Water Injection Well Oil Christmas Tree Market, 2020-2030
4.1.6 Gas-Lift Well Oil Christmas Tree Market, 2020-2030
4.1.7 Others Products Market, 2020-2030
4.2 Global Oil Well Christmas Tree Market Forecast, by Type 2020-2030
4.2.1 Type Overview
4.2.2 HPHT Christmas Trees Market, 2020-2030
4.2.3 Horizontal Christmas Trees Market, 2020-2030
4.2.4 Vertical Christmas Trees Market, 2020-2030
4.2.5 Other Type Market, 2020-2030
4.3 Global Oil Well Christmas Tree Market Forecast, by Deployment 2020-2030
4.3.1 Deployment Overview
4.3.2 Onshore Market, 2020-2030
4.3.3 Offshore Market, 2020-2030
4.3.4 Other Market, 2020-2030
5. Leading Regions in Oil Well Christmas Tree Market 2020-2030
5.1 Regional Overview
5.1.1 North America
5.1.2 Europe
5.1.3 Asia Pacific
5.1.4 LAMEA
5.1.5 Leading Countries/ Regions
5.2 U.S. Oil Well Christmas Tree Market Forecast, 2020-2030
5.2.1 U.S. Oil Well Christmas Tree Submarket, By Product Forecast 2020-2030
5.2.2 U.S. Oil Well Christmas Tree Submarket, By Type Forecast 2020-2030
5.2.3 U.S. Oil Well Christmas Tree Submarket, By Deployment Forecast 2020-2030
5.2.4 U.S. Oil Well Christmas Tree Submarket, By Forecast 2020-2030
5.3 Canada Oil Well Christmas Tree Market Forecast, 2020-2030
5.3.1 Canada Oil Well Christmas Tree Submarket, By Product Forecast 2020-2030
5.3.2 Canada Oil Well Christmas Tree Submarket, By Type Forecast 2020-2030
5.3.3 Canada Oil Well Christmas Tree Submarket, By Deployment Forecast 2020-2030
5.3.4 Canada Oil Well Christmas Tree Submarket, By Forecast 2020-2030
5.4 The UK Oil Well Christmas Tree Market Forecast, 2020-2030
5.4.1 The UK Oil Well Christmas Tree Submarket, By Product Forecast 2020-2030
5.4.2 The UK Oil Well Christmas Tree Submarket, By Type Forecast 2020-2030
5.4.3 The UK Oil Well Christmas Tree Submarket, By Deployment Forecast 2020-2030
5.4.4 The UK Oil Well Christmas Tree Submarket, By Forecast 2020-2030
5.5 Germany Oil Well Christmas Tree Market Forecast, 2020-2030
5.5.1 Germany Oil Well Christmas Tree Submarket, By Product Forecast 2020-2030
5.5.2 Germany Oil Well Christmas Tree Submarket, By Type Forecast 2020-2030
5.5.3 Germany Oil Well Christmas Tree Submarket, By Deployment Forecast 2020-2030
5.5.4 Germany Oil Well Christmas Tree Submarket, By Forecast 2020-2030
5.6 France Oil Well Christmas Tree Market Forecast, 2020-2030
5.6.1 France Oil Well Christmas Tree Submarket, By Product Forecast 2020-2030
5.6.2 France Oil Well Christmas Tree Submarket, By Type Forecast 2020-2030
5.6.3 France Oil Well Christmas Tree Submarket, By Deployment Forecast 2020-2030
5.6.4 France Oil Well Christmas Tree Submarket, By Forecast 2020-2030
5.7 Italy Oil Well Christmas Tree Market Forecast, 2020-2030
5.7.1 Italy Oil Well Christmas Tree Submarket, By Product Forecast 2020-2030
5.7.2 Italy Oil Well Christmas Tree Submarket, By Type Forecast 2020-2030
5.7.3 Italy Oil Well Christmas Tree Submarket, By Deployment Forecast 2020-2030
5.7.4 Italy Oil Well Christmas Tree Submarket, By Forecast 2020-2030
5.8 Spain Oil Well Christmas Tree Market Forecast, 2020-2030
5.8.1 Spain Oil Well Christmas Tree Submarket, By Product Forecast 2020-2030
5.8.2 Spain Oil Well Christmas Tree Submarket, By Type Forecast 2020-2030
5.8.3 Spain Oil Well Christmas Tree Submarket, By Deployment Forecast 2020-2030
5.8.4 Spain Oil Well Christmas Tree Submarket, By Forecast 2020-2030
5.9 Rest of Europe Oil Well Christmas Tree Market Forecast, 2020-2030
5.9.1 Rest of Europe Oil Well Christmas Tree Submarket, By Product Forecast 2020-2030
5.9.2 Rest of Europe Oil Well Christmas Tree Submarket, By Type Forecast 2020-2030
5.9.3 Rest of Europe Oil Well Christmas Tree Submarket, By Deployment Forecast 2020-2030
5.9.4 Rest of Europe Oil Well Christmas Tree Submarket, By Forecast 2020-2030
5.10 China Oil Well Christmas Tree Market Forecast, 2020-2030
5.10.1 China Oil Well Christmas Tree Submarket, By Product Forecast 2020-2030
5.10.2 China Oil Well Christmas Tree Submarket, By Type Forecast 2020-2030
5.10.3 China Oil Well Christmas Tree Submarket, By Deployment Forecast 2020-2030
5.10.4 China Oil Well Christmas Tree Submarket, By Forecast 2020-2030
5.11 India Oil Well Christmas Tree Market Forecast, 2020-2030
5.11.1 India Oil Well Christmas Tree Submarket, By Product Forecast 2020-2030
5.11.2 India Oil Well Christmas Tree Submarket, By Type Forecast 2020-2030
5.11.3 India Oil Well Christmas Tree Submarket, By Deployment Forecast 2020-2030
5.11.4 India Oil Well Christmas Tree Submarket, By Forecast 2020-2030
5.12 Japan Oil Well Christmas Tree Market Forecast, 2020-2030
5.12.1 Japan Oil Well Christmas Tree Submarket, By Product Forecast 2020-2030
5.12.2 Japan Oil Well Christmas Tree Submarket, By Type Forecast 2020-2030
5.12.3 Japan Oil Well Christmas Tree Submarket, By Deployment Forecast 2020-2030
5.12.4 Japan Oil Well Christmas Tree Submarket, By Forecast 2020-2030
5.13 Australia & New Zealand Oil Well Christmas Tree Market Forecast, 2020-2030
5.13.1 Australia & New Zealand Oil Well Christmas Tree Submarket, By Product Forecast 2020-2030
5.13.2 Australia & New Zealand Oil Well Christmas Tree Submarket, By Type Forecast 2020-2030
5.13.3 Australia & New Zealand Oil Well Christmas Tree Submarket, By Deployment Forecast 2020-2030
5.13.4 Australia & New Zealand Oil Well Christmas Tree Submarket, By Forecast 2020-2030
5.14 Rest of Asia-Pacific Oil Well Christmas Tree Market Forecast, 2020-2030
5.14.1 Rest of Asia-Pacific Oil Well Christmas Tree Submarket, By Product Forecast 2020-2030
5.14.2 Rest of Asia-Pacific Oil Well Christmas Tree Submarket, By Type Forecast 2020-2030
5.14.3 Rest of Asia-Pacific Oil Well Christmas Tree Submarket, By Deployment Forecast 2020-2030
5.14.4 Rest of Asia-Pacific Oil Well Christmas Tree Submarket, By Forecast 2020-2030
5.15 Latin America Oil Well Christmas Tree Market Forecast, 2020-2030
5.15.1 Latin America Oil Well Christmas Tree Submarket, By Product Forecast 2020-2030
5.15.2 Latin America Oil Well Christmas Tree Submarket, By Type Forecast 2020-2030
5.15.3 Latin America Oil Well Christmas Tree Submarket, By Deployment Forecast 2020-2030
5.15.4 Latin America Oil Well Christmas Tree Submarket, By Forecast 2020-2030
5.16 Middle East Oil Well Christmas Tree Market Forecast, 2020-2030
5.16.1 Middle East Oil Well Christmas Tree Submarket, By Product Forecast 2020-2030
5.16.2 Middle East Oil Well Christmas Tree Submarket, By Type Forecast 2020-2030
5.16.3 Middle East Oil Well Christmas Tree Submarket, By Deployment Forecast 2020-2030
5.16.4 Middle East Oil Well Christmas Tree Submarket, By Forecast 2020-2030
5.17 Africa Oil Well Christmas Tree Market Forecast, 2020-2030
5.17.1 Africa Oil Well Christmas Tree Submarket, By Product Forecast 2020-2030
5.17.2 Africa Oil Well Christmas Tree Submarket, By Type Forecast 2020-2030
5.17.3 Africa Oil Well Christmas Tree Submarket, By Deployment Forecast 2020-2030
5.17.4 Africa Oil Well Christmas Tree Submarket, By Forecast 2020-2030
7. Leading Companies in The Oil Well Christmas Tree Market
7.1 TechnipFMC plc
7.1.1 TechnipFMC plc Products and Services
7.1.2 Analysis of TechnipFMC plc within the Oil Well Christmas Tree Market
7.1.3 TechnipFMC plc M&A Activity
7.1.4 Future Outlook for TechnipFMC plc
7.1.5 TechnipFMC plc Projects
7.2 Baker Hughes a GE Company
7.2.1 Baker Hughes a GE Company Products and Services
7.2.2 Analysis of Baker Hughes a GE Company within the Oil Well Christmas Tree Market
7.2.3 Baker Hughes a GE Company M&A Activity
7.2.4 Future Outlook for Baker Hughes a GE Company
7.2.5 Baker Hughes a GE Company Projects
7.3 Schlumberger Limited
7.3.1 Schlumberger Limited Products and Services
7.3.2 Analysis of Schlumberger Limited within the Oil Well Christmas Tree Market
7.3.3 Schlumberger Limited M&A Activity
7.3.4 Future Outlook for Schlumberger Limited
7.3.5 Schlumberger Limited Projects
7.4 Aker Solutions
7.4.1 Aker Solutions Products and Services
7.4.2 Analysis of Aker Solutions within the Oil Well Christmas Tree Market
7.4.3 Aker Solutions M&A Activity
7.4.4 Future Outlook for Aker Solutions
7.4.5 Aker Solutions Projects
7.5 Dril-Quip
7.5.1 Dril-Quip Products and Services
7.5.2 Analysis of Dril-Quip within the Oil Well Christmas Tree Market
7.5.3 Dril-Quip M&A Activity
7.5.4 Future Outlook for Dril-Quip
7.5.5 Dril-Quip Projects
7.6 General Electric
7.6.1 General Electric Products and Services
7.6.2 Analysis of General Electric within the Oil Well Christmas Tree Market
7.6.3 General Electric M&A Activity
7.6.4 Future Outlook for General Electric
7.6.5 General Electric Projects
7.7 Halliburton
7.7.1 Halliburton Products and Services
7.7.2 Analysis of Halliburton within the Oil Well Christmas Tree Market
7.7.3 Halliburton M&A Activity
7.7.4 Future Outlook for Halliburton
7.7.5 Halliburton Projects
7.8 Schlumberger
7.8.1 Schlumberger Products and Services
7.8.2 Analysis of Schlumberger within the Oil Well Christmas Tree Market
7.8.3 Schlumberger M&A Activity
7.8.4 Future Outlook for Schlumberger
7.8.5 Schlumberger Projects
7.9 TechnipFMC
7.9.1 TechnipFMC Products and Services
7.9.2 Analysis of TechnipFMC within the Oil Well Christmas Tree Market
7.9.3 TechnipFMC M&A Activity
7.9.4 Future Outlook for TechnipFMC
7.9.5 TechnipFMC Projects
7.10 Yantai Jereh Petroleum Equipment & Technologies Co. Ltd
7.10.1 Yantai Jereh Petroleum Equipment & Technologies Co. Ltd Products and Services
7.10.2 Analysis of Yantai Jereh Petroleum Equipment & Technologies Co. Ltd within the Oil Well Christmas Tree Market
7.10.3 Yantai Jereh Petroleum Equipment & Technologies Co. Ltd M&A Activity
7.10.4 Future Outlook for Yantai Jereh Petroleum Equipment & Technologies Co. Ltd
7.10.5 Yantai Jereh Petroleum Equipment & Technologies Co. Ltd Projects
7.11 Worldwide Oilfield Machine
7.11.1 Worldwide Oilfield Machine Products and Services
7.11.2 Analysis of Worldwide Oilfield Machine within the Oil Well Christmas Tree Market
7.11.3 Worldwide Oilfield Machine M&A Activity
7.11.4 Future Outlook for Worldwide Oilfield Machine
7.11.5 Worldwide Oilfield Machine Projects
8. Conclusions and Recommendations
8.1 Global Oil Well Christmas Tree Market Outlook
8.2 Recommendations
9. Glossary
Associated Visiongain Reports
Visiongain Report Sales Order Form
Appendix A
About Visiongain
Appendix B
Visiongain Report Evaluation Form
List of Tables
Table 1.0 Key Highlights
Table 3.1 PEST Analysis, Oil Well Christmas Tree Market
Table 3.2 SWOT Analysis
Table 4.1 Global Oil Well Christmas Tree Market Forecast 2020-2030 ($Bn, AGR %, CAGR %, Cumulative)
Table 4.2 Global Oil Well Christmas Tree Submarket, By Product Forecast 2020-2030 ($billion, AGR %, Cumulative)
Table 4.3 Global Oil Well Christmas Tree Submarket, By Deployment Forecast 2020-2030 ($billion, AGR %, Cumulative)
Table 4.4 Global Oil Well Christmas Tree Submarket, By Forecast 2020-2030 ($billion, AGR %, Cumulative)
Table 5.1 Global Oil Well Christmas Tree Market, by Country/Region Forecast 2020-2030 ($billion, AGR %, Cumulative)
Table 5.2 Global Oil Well Christmas Tree Market, by Country/Region Forecast 2020-2030 ($billion, AGR %, Cumulative)
Table 5.3 Canada Oil Well Christmas Tree Market Forecast 2020-2030 ($billion, , AGR %, CAGR %, Cumulative)
Table 5.4 Canada Oil Well Christmas Tree Submarket, By Product Forecast 2020-2030 ($billion, AGR %, Cumulative)
Table 5.5 Canada Oil Well Christmas Tree Submarket, By Type Forecast 2020-2030 ($billion, AGR %, Cumulative)
Table 5.6 US Oil Well Christmas Tree Market Submarket, By Deployment Forecast 2020-2030 ($billion, , AGR %, CAGR %, Cumulative)
Table 5.7 US Oil Well Christmas Tree Submarket, By Product Forecast 2020-2030 ($billion, AGR %, Cumulative)
Table 5.8 US Oil Well Christmas Tree Submarket, By Type Forecast 2020-2030 ($billion, AGR %, Cumulative)
Table 5.9 Latin America Oil Well Christmas Tree Market Forecast 2020-2030 ($billion, , AGR %, CAGR %, Cumulative)
Table 5.10 Latin America Oil Well Christmas Tree Submarket, By Product Forecast 2020-2030 ($billion, AGR %, Cumulative)
Table 5.11 Latin America Oil Well Christmas Tree Submarket, By Type Forecast 2020-2030 ($billion, AGR %, Cumulative)
Table 5.12 Germany Oil Well Christmas Tree Market Submarket, By Deployment Forecast 2020-2030 ($billion, , AGR %, CAGR %, Cumulative)
Table 5.13 Germany Oil Well Christmas Tree Submarket, By Product Forecast 2020-2030 ($billion, AGR %, Cumulative)
Table 5.14 Germany Oil Well Christmas Tree Submarket, By Type Forecast 2020-2030 ($billion, AGR %, Cumulative)
Table 5.15 UK Oil Well Christmas Tree Market Submarket, By Deployment Forecast 2020-2030 ($billion, , AGR %, CAGR %, Cumulative)
Table 5.16 UK Oil Well Christmas Tree Submarket, By Product Forecast 2020-2030 ($billion, AGR %, Cumulative)
Table 5.17 UK Oil Well Christmas Tree Submarket, By Type Forecast 2020-2030 ($billion, AGR %, Cumulative)
Table 5.18 Spain Oil Well Christmas Tree Market Submarket, By Deployment Forecast 2020-2030 ($billion, , AGR %, CAGR %, Cumulative)
Table 5.19 Spain Oil Well Christmas Tree Submarket, By Product Forecast 2020-2030 ($billion, AGR %, Cumulative)
Table 5.20 Spain Oil Well Christmas Tree Submarket, By Type Forecast 2020-2030 ($billion, AGR %, Cumulative)
Table 5.21 UK Oil Well Christmas Tree Submarket, By Deployment Forecast 2020-2030 ($billion, , AGR %, CAGR %, Cumulative)
Table 5.22 UK Oil Well Christmas Tree Submarket, By Product Forecast 2020-2030 ($billion, AGR %, Cumulative)
Table 5.23 UK Oil Well Christmas Tree Submarket, By Type Forecast 2020-2030 ($billion, AGR %, Cumulative)
Table 5.24 China Oil Well Christmas Tree Submarket, By Deployment Forecast 2020-2030 ($billion, , AGR %, CAGR %, Cumulative)
Table 5.25 China Oil Well Christmas Tree Submarket, By Product Forecast 2020-2030 ($billion, AGR %, Cumulative)
Table 5.26 China Oil Well Christmas Tree Submarket, By Type Forecast 2020-2030 ($billion, AGR %, Cumulative)
Table 5.27 Australia Oil Well Christmas Tree Submarket, By Deployment Forecast 2020-2030 ($billion, , AGR %, CAGR %, Cumulative)
Table 5.28 Australia Oil Well Christmas Tree Submarket, By Product Forecast 2020-2030 ($billion, AGR %, Cumulative)
Table 5.29 Australia Oil Well Christmas Tree Submarket, By Type Forecast 2020-2030 ($billion, AGR %, Cumulative)
Table 5.30 South Korea Oil Well Christmas Tree Submarket, By Deployment Forecast 2020-2030 ($billion, , AGR %, CAGR %, Cumulative)
Table 5.31 South Korea Oil Well Christmas Tree Submarket, By Product Forecast 2020-2030 ($billion, AGR %, Cumulative)
Table 5.32 South Korea Oil Well Christmas Tree Submarket, By Type Forecast 2020-2030 ($billion, AGR %, Cumulative)
Table 5.33 Japan Oil Well Christmas Tree Submarket, By Deployment Forecast 2020-2030 ($billion, , AGR %, CAGR %, Cumulative)
Table 5.34 Japan Oil Well Christmas Tree Submarket, By Product Forecast 2020-2030 ($billion, AGR %, Cumulative)
Table 5.35 Japan Oil Well Christmas Tree Submarket, By Type Forecast 2020-2030 ($billion, AGR %, Cumulative)
Table 5.36 India Oil Well Christmas Tree Submarket, By Deployment Forecast 2020-2030 ($billion, , AGR %, CAGR %, Cumulative)
Table 5.37 India Oil Well Christmas Tree Submarket, By Product Forecast 2020-2030 ($billion, AGR %, Cumulative)
Table 5.38 India Oil Well Christmas Tree Submarket, By Type Forecast 2020-2030 ($billion, AGR %, Cumulative)
Table 5.39 Middle East Oil Well Christmas Tree Submarket, By Deployment Forecast 2020-2030 ($billion, , AGR %, CAGR %, Cumulative)
Table 5.40 Middle East Oil Well Christmas Tree Submarket, By Product Forecast 2020-2030 ($billion, AGR %, Cumulative)
Table 5.41 Middle East Oil Well Christmas Tree Submarket, By Type Forecast 2020-2030 ($billion, AGR %, Cumulative)
Table 5.42 Rest of Asia-Pacific Oil Well Christmas Tree Submarket, By Deployment Forecast 2020-2030 ($billion , , AGR %, CAGR %, Cumulative)
Table 5.43 Rest of Asia-Pacific Oil Well Christmas Tree Submarket, By Product Forecast 2020-2030 ($billion , AGR %, Cumulative)
Table 5.44 Rest of Asia-Pacific Oil Well Christmas Tree Submarket, By Type Forecast 2020-2030 ($billion , AGR %, Cumulative)
Table 5.45 Rest of Europe Oil Well Christmas Tree Submarket, By Deployment Forecast 2020-2030 ($billion, , AGR %, CAGR %, Cumulative)
Table 5.46 Rest of Europe Oil Well Christmas Tree Submarket, By Product Forecast 2020-2030 ($billion, AGR %, Cumulative)
Table 5.47 Rest of Europe Oil Well Christmas Tree Submarket, By Type Forecast 2020-2030 ($billion, AGR %, Cumulative)
Table 5.48 Africa Oil Well Christmas Tree Submarket, By Deployment Forecast 2020-2030 ($billion, , AGR %, CAGR %, Cumulative)
Table 5.49 Africa Oil Well Christmas Tree Submarket, By Product Forecast 2020-2030 ($billion, AGR %, Cumulative)
Table 5.50 Africa Oil Well Christmas Tree Submarket, By Type Forecast 2020-2030 ($billion, AGR %, Cumulative)
Table 5.51 Spain Oil Well Christmas Tree Submarket, By Deployment Forecast 2020-2030 ($billion , , AGR %, CAGR %, Cumulative)
Table 5.52 Spain Oil Well Christmas Tree Submarket, By Product Forecast 2020-2030 ($billion , AGR %, Cumulative)
Table 5.53 Spain Oil Well Christmas Tree Submarket, By Type Forecast 2020-2030 ($billion , AGR %, Cumulative)
Table 7.1 TechnipFMC plc Profile 2019 (Market Entry, Public/Private, Headquarters, Geography, Key Market, Listed on, Products/Services
Table 7.2 TechnipFMC plc Profile 2019 (Market Entry, Public/Private, Headquarter, Total Company Revenue $billion, Change in Revenue, Geography, Key Market, Listed on, Products/Services)
Table 7.3 TechnipFMC plc Products and Services (Product/Service, Notes)
Table 7.4 TechnipFMC plc Total Company Sales 2015-2019 (US$billion, AGR %)
Table 7.5 TechnipFMC plc Total Company Recent Development 2015-2019
Table 7.6 Baker Hughes a GE Company Profile 2019 (Market Entry, Public/Private, Headquarter, Total Company Revenue $billion, Change in Revenue, Geography, Key Market, Listed on, Products/Services)
Table 7.7 Baker Hughes a GE Company Products and Services (Product/Service, Notes)
Table 7.8 Baker Hughes a GE Company Total Company Sales 2015-2019 (US$billion, AGR %)
Table 7.9 Baker Hughes a GE Company Total Company Recent Development 2015-2019
Table 7.10 Schlumberger Limited Profile 2019 (Market Entry, Public/Private, Headquarter, Total Company Revenue $billion, Change in Revenue, Geography, Key Market, Listed on, Products/Services)
Table 7.11 Schlumberger Limited Products and Services (Product/Service, Notes)
Table 7.12 Schlumberger Limited Total Company Sales 2015-2019 (US$billion, AGR %)
Table 7.13 Schlumberger Limited Total Company Recent Development 2015-2019
Table 7.14 Aker Solutions Profile 2019 (Market Entry, Public/Private, Headquarter, Total Company Revenue $billion, Change in Revenue, Geography, Key Market, Listed on, Products/Services)
Table 7.15 Aker Solutions Products and Services (Product/Service, Notes)
Table 7.16 Aker Solutions Total Company Sales 2015-2019 (US$billion, AGR %)
Table 7.17 Aker Solutions Total Company Recent Development 2015-2019
Table 7.18 Dril-Quip Profile 2019 (Market Entry, Public/Private, Headquarter, Total Company Revenue $billion, Change in Revenue, Geography, Key Market, Listed on, Products/Services)
Table 7.19 Dril-Quip Products and Services (Product/Service, Notes)
Table 7.20 Dril-Quip Total Company Sales 2015-2019 (US$billion, AGR %)
Table 7.21 Dril-Quip Total Company Recent Development 2015-2019
Table 7.22 General Electric Profile 2019 (Market Entry, Public/Private, Headquarter, Total Company Revenue $billion, Change in Revenue, Geography, Key Market, Listed on, Products/Services)
Table 7.23 General Electric Products and Services (Product/Service, Notes)
Table 7.24 General Electric Total Company Sales 2015-2019 (US$billion, AGR %)
Table 7.25 General Electric Total Company Recent Development 2015-2019
Table 7.26 Halliburton Profile 2019 (Market Entry, Public/Private, Headquarter, Total Company Revenue $billion, Change in Revenue, Geography, Key Market, Listed on, Products/Services)
Table 7.27 Halliburton Products and Services (Product/Service, Notes)
Table 7.28 Halliburton Total Company Sales 2015-2019 (US$billion, AGR %)
Table 7.29 Halliburton Total Company Recent Development 2015-2019
Table 7.30 Schlumberger Profile 2019 (Market Entry, Public/Private, Headquarter, Total Company Revenue $billion, Change in Revenue, Geography, Key Market, Listed on, Products/Services)
Table 7.31 Schlumberger Products and Services (Product/Service, Notes)
Table 7.32 Schlumberger Total Company Sales 2015-2019 (US$billion, AGR %)
Table 7.33 Schlumberger Total Company Recent Development 2015-2019
Table 7.34 TechnipFMC Profile 2019 (Market Entry, Public/Private, Headquarter, Total Company Revenue $billion, Change in Revenue, Geography, Key Market, Listed on, Products/Services)
Table 7.35 TechnipFMC Products and Services (Product/Service, Notes)
Table 7.36 TechnipFMC Total Company Sales 2015-2019 (US$billion, AGR %)
Table 7.37 TechnipFMC Total Company Recent Development 2015-2019
Table 7.38 Yantai Jereh Petroleum Equipment & Technologies Co. Ltd Profile 2019 (Market Entry, Public/Private, Headquarter, Total Company Revenue $billion, Change in Revenue, Geography, Key Market, Listed on, Products/Services)
Table 7.39 Yantai Jereh Petroleum Equipment & Technologies Co. Ltd Products and Services (Product/Service, Notes)
Table 7.40 Yantai Jereh Petroleum Equipment & Technologies Co. Ltd Total Company Sales 2015-2019 (US$billion, AGR %)
Table 7.41 Yantai Jereh Petroleum Equipment & Technologies Co. Ltd Total Company Recent Development 2015-2019
Table 7.42 Worldwide Oilfield Machine Profile 2019 (Market Entry, Public/Private, Headquarter, Total Company Revenue $billion, Change in Revenue, Geography, Key Market, Listed on, Products/Services)
Table 7.43 Worldwide Oilfield Machine Products and Services (Product/Service, Notes)
Table 7.44 Worldwide Oilfield Machine Total Company Sales 2015-2019 (US$billion, AGR %)
Table 7.45 Worldwide Oilfield Machine Total Company Recent Development 2015-2019
List of Figures
Figure 1.1 Global Oil Well Christmas Tree Market Segmentation
Figure 2.1 Oil Well Christmas Tree Value Chain Analysis
Figure 3.1 Oil Well Christmas Tree Supply-Demand Analysis
Figure 4.1 Global Oil Well Christmas Tree Forecast 2020-2030 ($billion, AGR %)
Figure 4.2 Global Oil Well Christmas Tree Market Forecast 2020-2030
Figure 4.3 Global Oil Well Christmas Tree Submarket Forecast by 2020-2030 ($ billion)
Figure 4.4 Global Oil Well Christmas Tree Market By Product Share Forecast 2020, 2025, 2030 (% Share)
Figure 4.19 Global Oil Well Christmas Tree by Submarket By Product Forecast 2020-2030 ($ million)
Figure 4.20 Global Oil Well Christmas Tree Market, by Share Forecast 2020, 2025, 2030 (% Share)
Figure 4.21 Oil Well Christmas Tree Market, By Product Forecast 2020-2030 ($billion, AGR%)
Figure 4.23 Oil Well Christmas Tree Market, By Product Forecast 2020-2030 ($billion, AGR%)
Figure 4.25 Oil Well Christmas Tree Market, By Product Forecast 2020-2030 ($billion, AGR%)
Figure 4.27 Oil Well Christmas Tree Market, By Product Forecast 2020-2030 ($billion, AGR%)
Figure 5.1 Regional/Country Oil Well Christmas Tree Market, by 2020-2030
Figure 5.3 Leading Country/Regional Oil Well Christmas Tree Market Share, by 2020
Figure 5.4 Leading Country/Regional Oil Well Christmas Tree Market Share, by 2025
Figure 5.5 Leading Country/Regional Oil Well Christmas Tree Market Share, by 2030
Figure 5.6 Canada Oil Well Christmas Tree Market Forecast 2020-2030 ($billion, AGR%)
Figure 5.7 Canada Oil Well Christmas Tree Market, by Forecast 2020-2030
Figure 5.8 Canada Oil Well Christmas Tree Submarket, By Product Forecast 2020-2030
Figure 5.9 Canada Oil Well Christmas Tree Submarket , By Type Forecast 2020-2030
Figure 5.10 Canada Oil Well Christmas Tree Submarket , By Deployment 2020-2030 ($billion, AGR%)
Figure 5.10 U.S. Oil Well Christmas Tree Market Forecast 2020-2030 ($billion, AGR%)
Figure 5.11 U.S. Oil Well Christmas Tree Market, by Forecast 2020-2030
Figure 5.12 U.S. Oil Well Christmas Tree Submarket, By Product Forecast 2020-2030
Figure 5.13 U.S. Oil Well Christmas Tree Submarket , By Type Forecast 2020-2030
Figure 5.13 U.S. Oil Well Christmas Tree Submarket , By Deployment Forecast 2020-2030
Figure 5.14 Latin America Oil Well Christmas Tree Market Forecast 2020-2030 ($billion , AGR%)
Figure 5.15 Latin America Oil Well Christmas Tree Market, by Forecast 2020-2030
Figure 5.16 Latin America Oil Well Christmas Tree Submarket, By Product Forecast 2020-2030
Figure 5.17 Latin America Oil Well Christmas Tree Submarket , By Type Forecast 2020-2030
Figure 5.17 Latin America Oil Well Christmas Tree Submarket , By Deployment Forecast 2020-2030
Figure 5.18 Germany Oil Well Christmas Tree Market Forecast 2020-2030 ($billion, AGR%)
Figure 5.19 Germany Oil Well Christmas Tree Market, by Forecast 2020-2030
Figure 5.20 Germany Oil Well Christmas Tree Submarket, By Product Forecast 2020-2030
Figure 5.21 Germany Oil Well Christmas Tree Submarket , By Type Forecast 2020-2030
Figure 5.21 Germany Oil Well Christmas Tree Submarket , By Deployment Forecast 2020-2030
Figure 5.22 U.K. Oil Well Christmas Tree Market Forecast 2020-2030 ($billion, AGR%)
Figure 5.23 U.K. Oil Well Christmas Tree Market, by Forecast 2020-2030
Figure 5.24 U.K. Oil Well Christmas Tree Submarket, By Product Forecast 2020-2030
Figure 5.25 U.K. Oil Well Christmas Tree Submarket , By Type Forecast 2020-2030
Figure 5.25 U.K. Oil Well Christmas Tree Submarket , By Deployment Forecast 2020-2030
Figure 5.26 Spain Oil Well Christmas Tree Market Forecast 2020-2030 ($billion, AGR%)
Figure 5.27 Spain Oil Well Christmas Tree Market, by Forecast 2020-2030
Figure 5.28 Spain Oil Well Christmas Tree Submarket, By Product Forecast 2020-2030
Figure 5.29 Spain Oil Well Christmas Tree Submarket , By Type Forecast 2020-2030
Figure 5.30 UK Oil Well Christmas Tree Market Forecast 2020-2030 ($billion, AGR%)
Figure 5.31 UK Oil Well Christmas Tree Market, by Forecast 2020-2030
Figure 5.32 UK Oil Well Christmas Tree Submarket, By Product Forecast 2020-2030
Figure 5.33 UK Oil Well Christmas Tree Submarket , By Type Forecast 2020-2030
Figure 5.34 China Oil Well Christmas Tree Market Forecast 2020-2030 ($billion, AGR%)
Figure 5.35 China Oil Well Christmas Tree Submarket , By Deployment, by Forecast 2020-2030
Figure 5.36 China Oil Well Christmas Tree Submarket, By Product Forecast 2020-2030
Figure 5.37 China Oil Well Christmas Tree Submarket , By Type Forecast 2020-2030
Figure 5.38 Australia Oil Well Christmas Tree Market Forecast 2020-2030 ($billion, AGR%)
Figure 5.39 Australia Oil Well Christmas Tree Submarket , By Deployment, by Forecast 2020-2030
Figure 5.40 Australia Oil Well Christmas Tree Submarket, By Product Forecast 2020-2030
Figure 5.41 Australia Oil Well Christmas Tree Submarket , By Type Forecast 2020-2030
Figure 5.42 South Korea Oil Well Christmas Tree Market Forecast 2020-2030 ($billion, AGR%)
Figure 5.43 South Korea Oil Well Christmas Tree Submarket , By Deployment, by Forecast 2020-2030
Figure 5.44 South Korea Oil Well Christmas Tree Submarket, By Product Forecast 2020-2030
Figure 5.45 South Korea Oil Well Christmas Tree Submarket , By Type Forecast 2020-2030
Figure 5.46 Japan Oil Well Christmas Tree Market Forecast 2020-2030 ($billion, AGR%)
Figure 5.47 Japan Oil Well Christmas Tree Submarket , By Deployment, by Forecast 2020-2030
Figure 5.48 Japan Oil Well Christmas Tree Submarket, By Product Forecast 2020-2030
Figure 5.49 Japan Oil Well Christmas Tree Submarket , By Type Forecast 2020-2030
Figure 5.50 India Oil Well Christmas Tree Market Forecast 2020-2030 ($billion, AGR%)
Figure 5.51 India Oil Well Christmas Tree Submarket , By Deployment, by Forecast 2020-2030
Figure 5.52 India Oil Well Christmas Tree Submarket, By Product Forecast 2020-2030
Figure 5.53 India Oil Well Christmas Tree Submarket , By Type Forecast 2020-2030
Figure 5.54 Middle East Oil Well Christmas Tree Market Forecast 2020-2030 ($billion, AGR%)
Figure 5.55 Middle East Oil Well Christmas Tree Submarket , By Deployment, by Forecast 2020-2030
Figure 5.56 Middle East Oil Well Christmas Tree Submarket, By Product Forecast 2020-2030
Figure 5.57 Middle East Oil Well Christmas Tree Submarket , By Type Forecast 2020-2030
Figure 5.70 Rest of the World Oil Well Christmas Tree Market Forecast 2020-2030 ($billion , AGR%)
Figure 5.71 Rest of the World Oil Well Christmas Tree Submarket , By Deployment, by Forecast 2020-2030
Figure 5.72 Rest of the World Oil Well Christmas Tree Submarket, By Product Forecast 2020-2030
Figure 5.73 Rest of the World Oil Well Christmas Tree Submarket , By Type Forecast 2020-2030
Figure 7.1 TechnipFMC plc Total Company Sales 2013-2019 (US$ million, AGR %)
Figure 7.2 Baker Hughes a GE Company Total Company Sales 2013-2019 (US$ million, AGR %)
Figure 7.3 Schlumberger Limited Total Company Sales 2013-2019 (US$ Bn, AGR %)
Figure 7.6 Aker Solutions Company Sales 2013-2019 (US$ bn, AGR %)
Figure 7.7 Aker Solutions Revenue % Share, by Deployment Segment, 2019
Figure 7.8 Aker Solutions Revenue % Share, by Geographical Trade, 2019
Figure 7.9 Aker Solutions Revenue % Share, by Business Segment, 2019
Figure 7.10 Dril-Quip Revenue % Share, by Geographic Segment, 2019
Figure 7.11 General Electric Company Total Company Sales 2013-2019 (US$ million, AGR %)
Figure 7.12 Halliburton Total Company Sales 2013-2019 (US$ million, AGR %)
Figure 7.13 Halliburton Revenue % Share, by Regional Segment, 2019
Figure 7.14 Schlumberger Total Company Sales 2013-2019 (US$ million, AGR %)
Figure 7.15 Schlumberger Revenue % Share, by Regional Segment, 2019
Figure 7.16 Schlumberger Revenue % Share, by Business Segment, 2019
Figure 7.17 TechnipFMC Total Company Sales 2013-2019 (US$ bn, AGR %)
Figure 7.18 Yantai Jereh Petroleum Equipment & Technologies Co. Ltd Total Company Revenue 2013-2019 (US$ bn, AGR %)
Figure 7.19 Yantai Jereh Petroleum Equipment & Technologies Co. Ltd Company Sales 2014-2019 (US$ bn, AGR %)
Figure 7.20 Yantai Jereh Petroleum Equipment & Technologies Co. Ltd Revenue % Share, by Business Segment, 2019