Industries > Energy > Next Generation Energy Storage Technologies (EST) Market Forecast 2017-2027

Next Generation Energy Storage Technologies (EST) Market Forecast 2017-2027
Analysis of Technology Maturity, Performance & Commercialisation of Mechanical (Innovative PHS, AA-CAES, Isothermal CAES & LAES), Chemical (Hydrogen Storage & Fuel Cells), Electrical (SMES) & Electrochemical (Lithium-Air, Lithium-Sulphur, Magnesium-Ion & Zinc-Air Batteries)
The latest research report from business intelligence provider visiongain offers comprehensive analysis of the Next Generation EST market. Visiongain assesses that this market will generate $9.0 bn in 2017.
The Next Generation Energy Storage Technologies (EST) Market Forecast 2017-2027 responds to your need for definitive market data:
Read on to discover how you can exploit the future business opportunities emerging in this sector. Visiongain’s new study tells you and tells you NOW.
In this brand new report you find 187 in-Depth tables, charts and graphs all unavailable elsewhere.
The 240 page report provides clear detailed insight into the global Next Generation EST market. Discover the key drivers and challenges affecting the market.
By ordering and reading our brand new report today you stay better informed and ready to act.
Report Scope
The report delivers considerable added value by revealing:
• 187 tables, charts and graphs analysing and revealing the growth prospects and outlook for the Next Generation EST market.
• Global Next Generation EST market forecasts and analysis from 2017-2027.
• Next Generation EST submarket forecasts from 2017-2027
• Thermal submarket forecast 2017-2027
• Electro Chemical submarket forecast 2017-2027
• Electro Mechanical submarket forecast 2017-2027
• Hydrogen Storage submarket forecast 2017-2027
• Regional Next Generation EST market forecasts from 2017-2027 with drivers and restraints for the regions including;
• North America
• Europe
• China and Japan
• ROW
• Company profiles for the leading 10 Next Generation EST companies
• Johnson Controls
• LG Chem Ltd.
• Duke Energy Corporation
• NextEra Energy, Inc.
• Edison International
• Samsung SDI Co. Ltd.
• Mitsubishi Electric Corporation
• BYD Co. Ltd.
• Robert Bosch GmbH
• ABB Group
• Conclusions and recommendations which will aid decision-making
How will you benefit from this report?
• Keep your knowledge base up to speed. Don’t get left behind
• Reinforce your strategic decision-making with definitive and reliable market data
• Learn how to exploit new technological trends
• Realise your company’s full potential within the market
• Understand the competitive landscape and identify potential new business opportunities & partnerships
Who should read this report?
• Anyone with interest in the Next Generation EST market
• Oil & gas operators
• Commodity traders
• Investment managers
• Arbitrage companies and divisions
• Energy price reporting companies
• Energy company managers
• Energy consultants
• Oil and gas company executives and analysts
• Heads of strategic development
• Business development managers
• Marketing managers
• Market analysts,
• Technologists
• Suppliers
• Investors
• Banks
• Government agencies
Visiongain’s study is intended for anyone requiring commercial analyses for the Next Generation EST market and leading companies. You find data, trends and predictions.
Buy our report today the Next Generation Energy Storage Technologies (EST) Market Forecast 2017-2027: Analysis of Technology Maturity, Performance & Commercialisation of Mechanical (Innovative PHS, AA-CAES, Isothermal CAES & LAES), Chemical (Hydrogen Storage & Fuel Cells), Electrical (SMES) & Electrochemical (Lithium-Air, Lithium-Sulphur, Magnesium-Ion & Zinc-Air Batteries). Avoid missing out by staying informed – get our report now.
Visiongain is a trading partner with the US Federal Government
CCR Ref number: KD4R6
1. Report Overview
1.1 Global Next Generation Energy Storage Technologies Market Overview
1.2 Market Definition
1.3 Why You Should Read This Report
1.4 Benefits of This Report
1.5 Structure of This Report
1.6 Key Questions Answered by This Analytical Report Include:
1.7 Who is This Report For?
1.8 Methodology
1.8.1 Primary Research
1.8.2 Secondary Research
1.8.3 Market Sizing
1.8.4 Forecasting
1.8.5 Visiongain’s Added Value
1.9 Frequently Asked Questions (FAQ)
1.10 Associated visiongain Reports
1.11 About visiongain
2. Introduction to Established and Emerging Energy Storage Technologies
2.1 Categorisation of Energy Storage Technologies
2.2 Installed Energy Storage Capacity
2.3 The Rise of Emerging Energy Storage Technologies
3. The Drivers and Restraints of Next-Generation Energy Storage Technologies
3.1 An Introduction to the Dynamics of the Market
3.2 The Factors that Will Drive and Restraint the Market
3.2.1 Rising Energy Prices Indirectly Incentivise EST
3.2.2 Investments in Research, Development and Demonstration
3.2.3 The Importance of Renewable Energy Integration
3.2.4 Smart Grids and Distributed Power Generation Systems
3.2.5 Growing Electricity Demand
3.2.6 The Developing Alternative Vehicle Market as a Growth Factor
3.2.7 The High Capital Costs of Emerging Energy Storage Technologies
3.2.8 Limited Cost Recovery Opportunities
3.2.9 The Policy and Regulatory Challenges Ahead
3.2.10 The Impact of Weak Market Demand for ESTs
3.2.11 Geographical and Spatial Constraints of Mature Energy Storage Technologies
3.2.12 Conservatism in the Utility Industry
3.2.13 The Need for Large-Scale Demonstration Projects
3.2.14 Raw Material Availability
3.2.15 Technology Development and Deployment Patterns
3.2.16 The Limitations of Established Energy Storage Technologies
3.2.17 Long Investment Cycles
3.2.18 Opportunities for Home Energy Storage and Arbitrage
4. Next-Generation Mechanical Energy Storage Technologies
4.1 Innovative Pumped Hydro Storage
4.1.1 An Introduction to Innovative Pumped Hydro Storage
4.1.2 The Nature of the Innovation
4.1.3 The Performance Characteristics of Innovative PHS Installations
4.1.4 The Applications and Key Competitors of Innovative PHS
4.1.5 Current Deployment of Innovative PHS
4.1.6 Drivers and Restraints of Innovative PHS
4.1.7 The Outlook for Innovative PHS
4.1.8 Companies and Stakeholders Involved in the Innovative PHS Market
4.2 Adiabatic and Isothermal Compressed Air Energy Storage
4.2.1 An Introduction to Adiabatic and Isothermal Compressed Air Energy Storage
4.2.2 The Nature of the Innovation
4.2.3 The Performance Characteristics of Adiabatic and Isothermal CAES
4.2.4 The Applications and Key Competitors of Advanced CAES
4.2.5 Current Deployment of Compressed Air Energy Storage
4.2.6 Drivers and Restraints of Advanced Compressed Air Energy Storage
4.2.7 The Outlook for Advanced Compressed Air Energy Storage
4.2.8 Companies and Stakeholders Involved in the Advanced CAES Market
4.3 Liquid Aid Energy Storage (LAES)
4.3.1 An Introduction to Liquid Air Energy Storage
4.3.2 The Nature of the Innovation
4.3.3 The Performance Characteristics of Liquid Air Energy Storage
4.3.4 The Applications and Key Competitors of Liquid Air Energy Storage
5. Next-Generation Chemical Energy Storage Technologies
5.1 Large-Scale Hydrogen Energy Storage Systems and Hydrogen Fuel Cells
5.1.1 An Introduction to Large-Scale Hydrogen Energy Storage Systems and Hydrogen Fuel Cells
5.1.2 The Nature of the Innovation
5.1.3 The Performance Characteristics of Large-Scale Hydrogen Energy Storage Systems and Hydrogen Fuel Cells
5.1.4 The Applications and Key Competitors of Large-Scale Hydrogen Storage Systems and Hydrogen Fuel Cells
5.1.5 Current Deployment of Large-Scale Hydrogen Energy Storage Systems and Hydrogen Fuel Cells
5.1.6 Drivers and Restraints of Large-Scale Hydrogen Storage Systems and Hydrogen Fuel Cells
5.1.7 The Outlook for Large-Scale Hydrogen Energy Storage Systems and Hydrogen Fuel Cells
5.1.8 Companies and Stakeholders Involved in the Hydrogen and Fuel Cells Energy Storage Market
6. Next-Generation Electrical Energy Storage Technologies
6.1 Superconducting Magnetic Energy Storage (SMES)
6.1.1 An Introduction to Superconducting Magnetic Energy Storage (SMES)
6.1.2 The Nature of the Innovation
6.1.3 The Performance Characteristics of Superconducting Magnetic Energy Storage
6.1.4 The Applications and Key Competitors of Superconducting Magnetic Energy Storage
6.1.5 Current Deployment of Superconducting Magnetic Energy Storage
6.1.6 Drivers and Restraints of Superconducting Magnetic Energy Storage
6.1.7 The Outlook for Superconducting Magnetic Energy Storage
6.1.8 Companies and Stakeholders Involved in the Superconducting Magnetic Energy Storage Market
7. Next-Generation Electrochemical Energy Storage Technologies
7.1 An Introduction to Next-Generation Battery Technologies
7.2 The Key Drivers of Innovation in the Market
7.3 Key Patterns of Innovation in the Market
7.4 Lithium-air (Li-Air)
7.4.1 Nature of the Innovation
7.4.2 The Performance Characteristics of Lithium Air Batteries
7.4.3 The Applications and Key Competitors of Lithium Air Batteries
7.4.4 Current Deployment of Lithium Air Batteries
7.4.5 The Drivers and Restraints of the Lithium Air Batteries Market
7.4.6 The Outlook for Lithium Air Batteries
7.4.7 Key Companies and Stakeholders Involved in the Lithium Air Battery Market
7.5 Lithium-Sulphur (Li-S)
7.5.1 Nature of the Innovation
7.5.2 The Performance Characteristics of Lithium Sulphur Batteries
7.5.3 The Applications and Key Competitors of Lithium Sulphur Batteries
7.5.4 Current Deployment of Lithium Sulphur Batteries
7.5.5 The Drivers and Restraints of the Lithium Sulphur Battery Market
7.5.6 The Outlook for Lithium Sulphur Batteries
7.5.7 Key Companies and Stakeholders Involved in the Lithium Sulphur Battery Market
7.6 Magnesium-Ion (Mg-Ion)
7.6.1 Nature of the Innovation
7.6.2 The Performance Characteristics of Magnesium Ion Batteries
7.6.3 The Applications and Key Competitors of Magnesium-Ion Batteries
7.6.4 Current Deployment of Magnesium Ion Batteries
7.6.5 The Drivers and Restraints of Magnesium-Ion Batteries
7.6.6 The Outlook for Magnesium-Ion Batteries
7.6.7 Key Companies and Stakeholders Involved in the Magnesium Ion Battery Market
7.7 Zinc-Air (Zn-air)
7.7.1 Nature of the Innovation
7.7.2 The Performance Characteristics of Zinc-Air Batteries
7.7.3 The Main Applications and Key Competitors of Zinc-Air Batteries
7.7.4 Current Deployment of Zinc-Air Batteries
7.7.5 The Drivers and Restraints of the Zinc Air Battery Market
7.7.6 The Outlook for Zinc-Air Batteries
7.7.7 Key Companies and Stakeholders in the Zinc-Air Battery Market
7.8 Concluding Remarks on Emerging Battery Storage Technologies
8. Next-Generation Thermal Energy Storage Technologies
8.1 An Introduction to Next-Generation Thermal Battery Storage Technologies
9. Expert Opinions
9.1 Expert Interview with Paul DiRenzo, Jr from Peak Hour Power
9.1.1 The Growing Interest in Innovative Pumped Hydro Storage Installations
9.1.2 The Opportunities and Challenges of Seawater PHS
9.1.3 The Competition of Other Next-Generation Bulk Storage Technologies
9.2 Expert Interview with Giw Zanganeh, Airlight Energy
9.2.1 Latest Developments at Airlight Energy
9.2.2 CAES and Thermal Energy Storage in the Context of Other ESTs
9.2.3 The Market Space and Applications of Thermal Energy Storage
9.2.4 The Maturity and Key Markets of the AA-CAES Technology
9.3 Expert Interview with Gareth Brett Highview Power
9.3.1 Latest Developments at Highview Power
9.3.2 Liquid Air Energy Storage Technology
9.3.3 The Maturity and Commercial Viability of the Technology
9.3.4 The Key Challenges and Competitors
9.3.5 Media Attention and the Hype Surrounding Emerging Technologies
9.3.6 The Technical Specifications and Performance of the Technology
9.3.7 Key Markets and Main Regulatory Drivers/Restraints
9.3.8 The Status of Energy Storage Assets
9.3.9 The Outlook for Next-Generation ESTs
9.4 Expert Interview with Philippe Bouchard, EoS Energy Storage
9.4.1 Latest Developments at EoS Energy Storage
9.4.2 EoS Energy Storage and Next-Generation Battery Chemistries
9.4.3 The Performance Characteristics of Eos Battery Chemistries
9.4.4 The Key Competitors in the Market
9.4.5 The Maturity of the Hybrid Cathode Battery Technology
9.4.6 The Main Patterns of Innovation in the Energy Storage Sector
9.4.7 Key National Markets
10. PEST Analysis of the Next-Generation Energy Storage Market
11. Established and Emerging Energy Storage Technologies, a Comparative Analysis
12. The Global Landscape of the Emerging Energy Storage Technologies Market
12.1 Next-Generation Energy Storage Technologies in North America
12.1.1 Drivers and Restraints of Next-Generation EST development and Deployment in North America
12.2 Next-Generation Energy Storage Technologies in Europe
12.2.1 Drivers and Restraints of Next-Generation EST Development and Deployment in Europe
12.3 Next-Generation Energy Storage Technologies in Asia
13. The Leading Companies in the Next Generation Energy Storage Technologies Market
13.1 Johnson Controls
13.1.1 Johnson Controls Total Company Sales 2011-2016
13.1.2 Johnson Controls Sales in the Energy Storage Technologies Market 2011-2016
13.2 LG Chem Ltd.
13.2.1 LG Chem Ltd. Total Company Sales 2012-2016
13.2.2 LG Chem Ltd. Sales in the Energy Storage Technologies Market 2011-2015
13.3 Duke Energy Corporation
13.3.1 Duke Energy Corporation Total Company Sales 2011-2016
13.3.2 Duke Energy Corporation Sales in the Energy Storage Technologies Market 2013-2016
13.4 NextEra Energy, Inc.
13.4.1 NextEra Energy, Inc. Total Company Sales 2011-2016
13.4.2 NextEra Energy, Inc. Sales in the Energy Storage Tehnologies Market 2011-2016
13.5 Edison International
13.5.1 Edison International Total Company Sales 2011-2016
13.6 Samsung SDI Co. Ltd.
13.6.1 Samsung SDI Co. Ltd. Total Company Sales 2011-2016
13.6.2 Samsung SDI Co. Ltd. Sales in the Energy Storage Technologies Market 2014-2016
13.7 Mitsubishi Electric Corporation
13.7.1 Mitsubishi Electric Corporation Total Company Sales 2011-2016
13.7.2 Mitsubishi Electric Corporation Sales in the Energy Storage Technologies Market 2011-2016
13.8 BYD Co. Ltd.
13.8.1 BYD Co. Ltd. Total Company Sales 2011-2016
13.8.2 BYD Co. Ltd Sales in the Energy Storage Technologies Market 2011-2016
13.9 Robert Bosch GmbH
13.9.1 Robert Bosch GmbH Total Company Sales 2013-2016
13.9.2 Robert Bosch GmbH Sales in the Energy Storage Technologies Market 2015-2016
13.10 ABB Group
13.10.1 ABB Group Total Company Sales 2011-2016
13.10.2 ABB Group Sales in the Energy Storage Technologies 2014-2016
13.11 Other Companies Involved in the Next Generation Energy Storage Technologies Market 2016
14. Conclusions and Recommendations
14.1 Drivers and Restraints of the Emerging Energy Storage Technologies Market
14.2 The Outlook for Innovative Pumped Hydro Storage
14.3 The Outlook for Advanced Compressed Air Energy Storage
15. Glossary
Associated visiongain Reports
visiongain Report Sales Order Form
Appendix A
About visiongain
Appendix B
visiongain report evaluation form
List of Tables
Table 1.1 Example of Standardised Metric Used for the Comparison of Energy Storage Technologies in Radial Graphs Presented Throughout This Report
Table 2.1 Global Next Generation Energy Storage Technologies Market Forecast 2017-2027 (MW, AGR %, CAGR %, Cumulative)
Table 2.2 List and Description of Main EST Applications
Table 3.1 Recent Demonstration Projects Funded by ARRA (Name, EST, MW Size, $m Cost, Planned Application)
Table 3.2 Global EST Market Drivers & Restraints
Table 4.1 Global Next Generation Energy Storage Technologies Market Forecast, By Mechanical Energy Storage Technology 2017-2027 (MW, AGR %, CAGR %, Cumulative)
Table 4.2 PHS main characteristics (Lifetime, Capacity MW, Efficiency %, Maturity)
Table 4.3 List of all Operating Innovative Pumped Hydro Installations (Name, Location, Capacity MW, Type, Commissioning)
Table 4.4 Pumped Hydro Storage (PHS) Market Drivers & Restraints
Table 4.5 List of all Planned Innovative Pumped Hydro Installations (Name, Location, Capacity MW, Type, Commissioning)
Table 4.6 Performance Characteristics of Conventional and Advanced CAES (Lifetime, Capacity MW, Efficiency %, Maturity)
Table 4.7 Installed CAES Capacity by National Market (MW)
Table 4.8 Key Diabatic and Adiabatic Compressed Air Energy Projects (Name, Location, Capacity MW, Type, Commissioning)
Table 4.9 Advanced CAES Market Drivers & Restraints
Table 4.10 Project Details for the Poleggio-Loderio Pilot AA-CAES Plant (Name, Location, Companies and Organisations Involved, Capacity kW, Type, Commissioning Date)
Table 4.11 The Main Characteristics of Liquid Air Energy Storage (Lifetime, Capacity MW, Efficiency %, Maturity)
Table 4.12 Drivers and Restraints of the LAES technology
Table 5.1 Global Next Generation Energy Storage Technologies Market Forecast, By Chemical Energy Storage Technology 2017-2027 (MW, AGR %, CAGR %, Cumulative)
Table 5.2 Hydrogen Main Characteristics (Lifetime, Capacity, Efficiency, Maturity)
Table 5.3 Large Scale Hydrogen Energy Storage and Hydrogen Fuel Cell Drivers & Restraints
Table 6.1 Performance characteristics SMES (Lifetime, Capacity MW, Efficiency %, Maturity)
Table 6.2 Drivers & Restraints of the SMES Market
Table 7.1 Global Next Generation Energy Storage Technologies Market Forecast, By Electrochemical Energy Storage Technology 2017-2027 (MW, AGR %, CAGR %, Cumulative)
Table 7.2 Main Performance Characteristics of Lithium-Air Batteries (Energy density, Cycle life, Efficiency, Maturity)
Table 7.3 Lithium Air Batteries Market Drivers & Restraints
Table 7.4 Main Performance Characteristics of Lithium Sulphur Batteries (Energy Density, Cycle Life, Efficiency, Maturity)
Table 7.5 Lithium Sulphur Batteries Market Drivers and Restraints
Table 7.6 Main Performance Characteristics for Magnesium Ion Batteries (Energy Density, Cycle Life, Efficiency, Maturity)
Table 7.7 Magnesium Ion Batteries Market Drivers & Restraints
Table 7.8 Main Performance Characteristics of Zinc Air Batteries (Energy Density, Cycle Life, Efficiency, Maturity)
Table 7.9 Zinc Air Batteries Market Drivers & Restraints
Table 10.1 PEST Analysis of the Emerging EST Market
Table 11.1 Comparison of Key Established and Emerging Energy Storage Technologies (Maturity, Capacity, Efficiency, Lifecycle)
Table 11.2 The Development Stage and Challenges of Established and Emerging Energy Storage Technologies
Table 12.1 Global Next Generation Energy Storage Technologies Market Forecast, By Region 2017-2027 ($bn, AGR %, CAGR %, Cumulative)
Table 12.2 Innovative PHS Submarket Forecast 2017-2027 ($m, AGR %, CAGR %, Cumulative)
Table 12.3 North America Next Generation Energy Storage Technologies Market Forecast 2017-2027 ($bn, AGR %, CAGR %, Cumulative)
Table 12.4 North America Next-Generation EST Market Drivers & Restraints
Table 12.5 Europe Next Generation Energy Storage Technologies Market Forecast 2017-2027 ($bn, AGR %, CAGR %, Cumulative)
Table 12.6 Innovative PHS Submarket Forecast 2017-2027 ($m, AGR %, CAGR %, Cumulative)
Table 12.7 European Next-Generation EST Market Drivers & Restraints
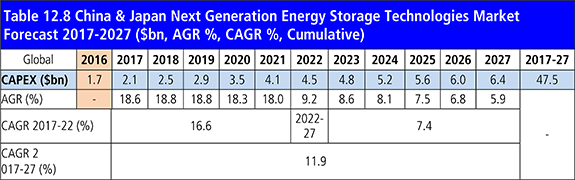
Table 12.8 China & Japan Next Generation Energy Storage Technologies Market Forecast 2017-2027 ($bn, AGR %, CAGR %, Cumulative)
Table 12.9 Asian Next-Generation EST Market Drivers & Restraints
Table 13.1 Johnson Controls 2016 ((CEO, Total Company Sales US$m, Sales From Company Division That Includes EST (US$m), Share of Total Company Sales From Company Division That Includes EST (%), Net Income / Loss US$m, Net Capital ExpenditureUS$m, Strongest Business Region, Business Segment in the Market, HQ, Founded, No. of Employees, IR Contact, Ticker, Website)
Table 13.2 Johnson Controls Total Company Sales 2010-2016 (US$m, AGR %)
Table 13.3 Johnson Controls Sales in the Energy Storage Technologies Market 2011-2016 (US$m, AGR %)
Table 13.4 LG Chem Ltd. 2015 (CEO, Total Company Sales US$m, Sales From Company Division That Includes EST (US$m), Share of Total Company Sales From Company Division That Includes EST (%), Net Capital Expenditure US$m, Strongest Business Region, Business Segment in the Market, HQ, Founded, No. of Employees, IR Contact, Ticker, Website)
Table 13.5 LG Chem Ltd. Total Company Sales 2011-2016 (US$m, AGR %)
Table 13.6 LG Chem Ltd. Sales in the Energy Storage Technologies Market 2011-2015 (US$m, AGR %)
Table 13.7 Duke Energy Corporation Profile 2016 (CEO, Total Company Sales US$m, Sales From Company Division That Includes EST (US$m), Share of Total Company Sales From Company Division That Includes EST (%), Net Capital ExpenditureUS$m, Strongest Business Region, Business Segment in the Market, HQ, Founded, No. of Employees, IR Contact, Ticker, Website)
Table 13.8 Duke Energy Corporation Total Company Sales 2010-2016 (US$m, AGR %)
Table 13.9 Duke Energy Corporation Sales in the Energy Storage Technologies Market 2013-2015 (US$m, AGR %)
Table 13.10 NextEra Energy, Inc. Profile 2016 (CEO, Total Company Sales US$m, Sales From Company Division That Includes EST (US$m), Share of Total Company Sales From Company Division That Includes EST (%), Net Capital ExpenditureUS$m, Strongest Business Region, Business Segment in the Market, HQ, Founded, No. of Employees, IR Contact, Ticker, Website)
Table 13.11 NextEra Energy, Inc. Total Company Sales 2010-2016 (US$m, AGR %)
Table 13.12 NextEra Energy, Inc. Sales in the Energy Storage Technologies Market 2010-2016 (US$m, AGR %)
Table 13.13 Edison International 2016 (CEO, Total Company Sales US$m, Net Income / Loss US$m, Net Capital ExpenditureUS$m, Business Segment in the Market, HQ, Founded, No. of Employees, IR Contact, Ticker, Website)
Table 13.14 Edison International Total Company Sales 2010-2016 (US$m, AGR %)
Table 13.15 Samsung SDI Co. Ltd. 2016 (CEO, Total Company Sales US$m, Sales From Company Division That Includes EST (US$m), Share of Total Company Sales From Company Division That Includes EST (%), Net Capital Expenditure US$m, Strongest Business Region, Business Segment in the Market, HQ, Founded, No. of Employees, IR Contact, Ticker, Website)
Table 13.16 Samsung SDI Co. Ltd. Total Company Sales 2010-2015 (US$m, AGR %)
Table 13.17 Samsung SDI Co. Ltd. Sales in the Energy Storage Technologies Market 2014-2015 (US$m, AGR %)
Table 13.18 Mitsubishi Electric Corporation Profile 2016 (CEO, Total Company Sales US$m, Sales From Company Division That Includes EST (US$m), Share of Total Company Sales From Company Division That Includes EST (%), Net Income / Loss US$m, Net Capital Expenditure US$m, Strongest Business Region, Business Segment in the Market, HQ, Founded, No. of Employees, IR Contact, Ticker, Website)
Table 13.19 Mitsubishi Electric Corporation Total Company Sales 2010-2016 (US$m, AGR %)
Table 13.20 Mitsubishi Electric Corporation Sales in the Energy Storage Technologies Market 2010-2016 (US$m, AGR %)
Table 13.21 BYD Co. Ltd Profile 2016 (CEO, Total Company Sales US$m, Sales From Company Division That Includes EST (US$m), Share of Total Company Sales From Company Division That Includes EST (%), Net Capital Expenditure US$m, Strongest Business Region, Business Segment in the Market, HQ, Founded, No. of Employees, IR Contact, Ticker, Website)
Table 13.22 BYD Co. Ltd Total Company Sales 2010-2016 (US$m, AGR %)
Table 13.23 BYD Co. Ltd Sales in the Energy Storage Technologies Market 2010-2016 (US$m, AGR %)
Table 13.24 Robert Bosch GmbH Profile 2016 (CEO, Total Company Sales US$m, Sales From Company Division That Includes EST (US$m), Share of Total Company Sales From Company Division That Includes EST (%), Net Capital Expenditure S$m, Strongest Business Region, Business Segment in the Market, HQ, Founded, No. of Employees, IR Contact, Ticker, Website)
Table 13.25 Robert Bosch GmbH Total Company Sales 2012-2016 (US$m, AGR %)
Table 13.26 Robert Bosch GmbH Sales in the Energy Storage Technologies Market 2015-2016 (US$m, AGR %)
Table 13.27 ABB Group Profile 2016 (CEO, Total Company Sales US$m, Sales From Company Division That Includes EST (US$m), Share of Total Company Sales From Company Division That Includes EST (%), Net Capital Expenditure US$m, Strongest Business Region, Business Segment in the Market, HQ, Founded, No. of Employees, IR Contact, Ticker, Website)
Table 13.28 ABB Group Total Company Sales 2010-2016 (US$m, AGR %)
Table 13.29 ABB Group Sales in the Energy Storage Technologies 2014-2016 (US$m, AGR %)
Table 13.30 Other Companies Involved in the Next Generation Energy Storage Technologies Market 2016 (Company, Location)
Table 14.1 Global Next Generation Energy Storage Technologies Market Forecast 2017-2027 (MW, AGR %, CAGR %, Cumulative)
Table 14.2 Global Next Generation Energy Storage Technologies Market Forecast, By Region 2017-2027 ($bn, AGR %, CAGR %, Cumulative)
Table 14.3 Global EST Market Drivers & Restraints
List of Figures
Figure 1.1 Next-Generation Energy Storage Technologies Market Overview
Figure 1.2 Development Stage of Different Energy Storage Technologies
Figure 1.3 The Performance Characteristics of Advanced and Conventional CAES (Lifecycle-Years, Efficiency %, Capacity, Maturity) on a Metric Standardised for all Emerging Technologies
Figure 2.1 Energy Storage Technologies Categorisation
Figure 2.2 Electricity Storage Matrix: EST Characteristics and Requirements of Key Applications
Figure 2.3 Global EST Market Structure Overview
Figure 2.4 Global Energy Storage Capacity by EST type (GW) 1996-2015
Figure 2.5 Global Energy Storage Capacity by EST type (GW) 1996-2015
Figure 2.6 Key Next-Generation EST Market Structure Overview
Figure 2.7 EST Overview of Types of Applications
Figure 3.1 Industrial Electricity Price History in France, Germany, Italy, UK, Japan and USA 1979-2014 (Pence/kWh)
Figure 3.2 Industrial Electricity Prices for Medium-Sized Industries in European Countries 2004-2014 (EUR/kWh)
Figure 3.3 Industrial Electricity Prices for Medium Sized Industries in Germany, Spain, France and the United Kingdom 2004-2014 (EUR/kWh)
Figure 3.4 Total Public Energy RD&D Spending of IEA Members 2015 (% of Total RD&D Spending on Energy-Related Projects)
Figure 3.5 Evolution of Total Public Energy RD&D Spending by Selected IEA members 1985-2013 ($m)
Figure 3.6 The Scale and Composition of Installed RES capacity in Selected Countries and Regions (GW)
Figure 3.7 Electricity Generated from Renewable Sources, EU 28, 2003-2013 (TWh, % of Consumption)
Figure 3.8 Number of FCEVs expected to operate in the US, South Korea, Japan and Europe, 2020
Figure 3.9 Technology and Innovation Adoption Lifecycle
Energy Storage Technology 2017-2027 (MW, AGR %, CAGR %, Cumulative)
Figure 4.1 Main Types of PHS Installations
Figure 4.2 Evolution of Installed Capacity in the Open-Loop, Closed-Loop and Innovative PHS Submarkets (1926-2015, MW)
Figure 4.3 Main Patterns of Innovation in the Global PHS Sector
Figure 4.4 Average Capacity of Existing and Planned PHS Installations (Submarket, MW)
Figure 4.5 The Performance Characteristics of Innovative PHS (Lifecycle-years, Efficiency %, Capacity, Maturity) on a Metric Standardised for all Emerging Technologies
Figure 4.6 Main Applications of Innovative PHS
Figure 4.7 Main Competitors of Innovative PHS
Figure 4.8 Key Market Spaces for Innovative PHS
Figure 4.9 Evolution of Installed Capacity in the Innovative PHS Submarket 1966 - 2015 (MW)
Figure 4.10 Total CAPEX on Innovative PHS by National Market (Cumulative $m)
Figure 4.11 Structure of the CAES Market
Figure 4.12 Round-Trip Efficiency of Conventional Diabatic CAES and Advanced CAES (%)
Figure 4.13 The Performance Characteristics of Advanced and Conventional CAES (Lifecycle-years, Efficiency %, Capacity, Maturity) on a Metric Standardised for all Emerging Technologies
Figure 4.14 Main Applications of Advanced Compressed Air Energy Storage
Figure 4.15 Main Competitors of Advanced Compressed Air Energy Storage
Figure 4.16 Key Market Spaces for Advanced CAES
Figure 4.17 Installed CAES Capacity by Category: Diabatic and Isothermal (MW, % of total)
Figure 4.18 Anticipated progress of AA-CAES through the pilot stage onto commercialisation (2014-2020)
Figure 4.19 Selection of Stakeholders and Companies Involved in the Advanced Compressed Air Energy Storage Market
Figure 4.20 The Stages Involved in Liquid Air Energy Storage
Figure 4.21 Round-Trip Efficiency of Liquid Air Energy Storage Variants (Standalone, Integrating Waste Heat and Integrating Waste Cold, %)
Figure 4.22 The Performance Characteristics of Liquid Air Energy Storage (Lifecycle-years, Efficiency %, Capacity, Maturity) on a Metric Standardised for all Emerging Technologies
Figure 4.23 Main Applications of Liquid Air Energy Storage
Figure 4.24 Main Competitors of Liquid Air Energy Storage
Figure 4.25 Key Market Spaces for Liquid Air Energy Storage
Figure 4.26 The Historic and Expected Development of Liquid Air Energy Storage (Conceptualisation to Commercialisation, 2005-2018)
Figure 4.27 Selection of Stakeholders and Companies Involved in the Liquid Air Energy Storage Market
Figure 5.1 The Fundamentals of Hydrogen Storage and Hydrogen Fuel Cells
Figure 5.2 The Round-Trip Efficiency of Hydrogen Storage by Pathway Variant ( Electricity > Gas > Electricity and Heat, Electricity > Gas > Electricity and Electricity > Gas) (%)
Figure 5.3 The Performance Characteristics of Large-Scale Hydrogen Energy Storage Systems and Hydrogen Fuel Cells (Lifecycle-Years, Efficiency %, Capacity, Maturity) on a Metric Standardised for all Emerging Technologies
Figure 5.4 Main Applications of Large-Scale Hydrogen Storage Systems and Hydrogen Fuel Cells
Figure 5.5 Main Competitors of Large-Scale Hydrogen Storage Systems
Figure 5.6 Main Competitors of Hydrogen Fuel Cells
Figure 5.7 Key Market Spaces for Hydrogen Storage and Hydrogen Fuel Cells
Figure 5.8 FCEV Fleet in Operation in Leading National and Regional Markets as of 2014
Figure 5.9 Hydrogen Fuelling Stations in Operation in Leading National and Regional Markets as of 2014
Figure 5.10 The Main Types of Hydrogen Storage
Figure 5.11 Existing and Planned Hydrogen Infrastructure in Leading Global Markets (Hydrogen Fuelling Stations)
Figure 5.12 Existing and Planned Hydrogen Infrastructure in Leading Global Markets (Hydrogen Fuelling Stations)
Figure 5.13 Existing and Planned Alternative Fuelling Infrastructure in Leading Global Markets (Hydrogen Fuelling Stations)
Figure 5.14 Selection of Stakeholders and Companies Involved in the Large Scale Hydrogen Energy Storage Systems and Hydrogen Fuel Cells Market
Figure 6.1 Variants of SMES technology
Figure 6.2 The Performance Characteristics of Superconducting Magnetic Energy Storage (Lifecycle-Years, Efficiency %, Capacity, Maturity) on a Metric Standardised for all Emerging Technologies
Figure 6.3 Main Applications for Superconducting Magnetic Energy Storage
Figure 6.4 Main Competitors of Superconducting Magnetic Energy Storage
Figure 6.5 Key Market Spaces for Superconducting Magnetic Energy Storage
Figure 6.6 Selection of Stakeholders and Companies Involved in the Superconducting Magnetic Energy Storage Market
Figure 7.1 Key Emerging Battery Chemistries
Figure 7.2 Li-air Categorisation by Electrolyte
Figure 7.3 The Performance Characteristics of Lithium Air Batteries (Lifecycle-years, Efficiency %, Capacity, Maturity) on a Metric Standardised for all Emerging Technologies
Figure 7.4 The Performance Characteristics of Lithium Sulphur Batteries (Lifecycle-years, Efficiency %, Capacity, Maturity) on a Metric Standardised for all Emerging Technologies
Figure 7.5 Main Types of Applications of Lithium Sulphur Batteries
Figure 7.6 Key Market Spaces for Lithium Sulphur Batteries
Figure 7.7 Selection of Stakeholders and Companies Involved in the Lithium Sulphur battery Market
Figure 7.8 Selection of Stakeholders and Companies Involved in the Magnesium-Ion Battery Market
Figure 7.9 The Performance Characteristics of Zinc Air (Lifecycle-Years, Efficiency %, Capacity, Maturity) on a Metric Standardised for all Emerging Technologies
Figure 7.10 Main Applications of Zinc Air Batteries
Figure 7.11 Selection of Stakeholders and Companies Involved in the Zinc-Air Battery Market
Figure 9.1 Eos Energy Storage Aurora Product Specifications
Figure 9.2 Eos Energy Storage: Technology Schematic
Figure 11.1 EST Characteristics and Requirements of Key Applications
Figure 11.2 Cost and Backup Time Comparison of Power Quality Energy Storage Technologies Except Pumped Storage (Euro/kWh & hours)
Figure 11.3 Comparison of the Round-trip Efficiency of Key Established and Emerging Energy Storage Technologies (%)
Figure 12.1 Key National Markets Involved in the Development of Next-Generation Energy Storage Technologies
Figure 12.2 Overview of the Key Next-Generation ESTs Under Development in North America
Figure 12.3 Overview of the Key Next-Generation ESTs Under Development in Europe
Figure 12.4 Overview of the Key Next-Generation ESTs Under Development in Asia
Figure 13.1 Johnson Controls Total Company Sales 2011-2016 (US$m, AGR %)
Figure 13.2 Johnson Controls Sales in the Enery Storage Technologies 2011-2016 (US$m, AGR %)
Figure 13.3 LG Chem Ltd. Total Company Sales 2012-2016 (US$m, AGR %)
Figure 13.4 LG Chem Ltd. Sales in the Energy Storage Technologies Market 2011-2015 (US$m, AGR %)
Figure 13.5 Duke Energy Corporation Total Company Sales 2011-2016 (US$m, AGR %)
Figure 13.6 Duke Energy Corporation Sales in the Energy Storage Technologies Market 2013-2016 (US$m, AGR %)
Figure 13.7 NextEra Energy, Inc. Total Company Sales 2011-2016 (US$m, AGR %)
Figure 13.8 NextEra Energy, Inc. Sales in the Energy Storage Technologies Market 2011-2016 (US$m, AGR %)
Figure 13.9 Edison International Total Company Sales 2011-2016 (US$m, AGR %)
Figure 13.10 Samsung SDI Co. Ltd. Total Company Sales 2011-2016 (US$m, AGR %)
Figure 13.11 Samsung SDI Co. Ltd. Sales in the Energy Storage Technologies Market 2014-2016 (US$m, AGR %)
Figure 13.12 Mitsubishi Electric Corporation Total Company Sales 2011-2016 (US$m, AGR %)
Figure 13.13 Mitsubishi Electric Corporation Sales in the Energy Storage Technologies Market 2011-2016 (US$m, AGR %)
Figure 13.14 BYD Co. Ltd Total Company Sales 2011-2016 (US$m, AGR %)
Figure 13.15 BYD Co. Ltd Sales in the Energy Storage Technologies Market 2011-2016 (US$m, AGR %)
Figure 13.16 Robert Bosch GmbH Total Company Sales 2013-2016 (US$m, AGR %)
Figure 13.17 Robert Bosch GmbH Sales in the Energy Storage Technologies Market 2015-2016 (US$m)
Figure 13.18 ABB Group Total Company Sales 2011-2016 (US$m, AGR %)
Figure 13.19 ABB Group Sales in the Energy Storage Technologies 2014-2016 (US$m, AGR %)
Figure 14.1 Next-Generation Energy Storage Technologies Market Overview
Figure 14.2 Development Stage of Different Energy Storage Technologies
Figure 14.3 Anticipated progress of AA-CAES through the pilot stage onto commercialisation (2014-2020)
Figure 14.4 The Historic and Expected Development of Liquid Air Energy Storage (Conceptualisation to Commercialisation, 2005-2018)
Figure 14.5 Existing and Planned Hydrogen Infrastructure in Leading Global Markets (Hydrogen Fuelling Stations)
ABB Group
A123 Systems
Air Liquide
Air Products
Airbus Defense and Space
ALACAES
Alpiq
Axpo
Ballard Power Systems
Bruker
Byd Co. Ltd.
Chubu Electric
DLR
Dresser Rand
Duke Energy Corporation
E.ON
Eagle Crest Energy
Edison International
EDF
Electric Power Development Co.,
Ener1
Enercon
Energias de Portugal
EnZinc
Eos Energy Storage
Fluidic Energy
Fujikura
Furukawa Electric
Gartner
General Compression
General Electric
General Motors
Grid Logic
Gridflex Energy LLC Principals
Highview Power
Hitachi
Honda
Hydrogenics
IBM
Illwerge AG
ITM Power
J-Power
Johnson Controls
Linde
LG Chem Ltd.
Magnum Energy Storage
Mercedes-Benz
Mitsubishi Electric Corporation
NextEra Energy Inc.
Nissan
Norsk Hydro
Oxis Energy
Pacific Gas and Electric
Peak Hour Power LLC
Pellion Technologies
PG&E
Phinergy
PJM
Proinso
Proton Motor
Proton Motor
ReVolt Technology
Robert Bosch GmbH
RWE
Samsung SDI Co. Ltd.
Siemens Dailmer
Sion Power
Sony
Superconductor Technologies
SuperPower
SustainX
Tesla
Texas Center for Superconductivity
Thüga
Toyota
UTC Power
Valence Technology
Verbund
Volkswagen
ZAF Energy Systems
Züblin
Other Organisations Mentioned in This Report
Advanced Research Projects Agency – Energy (ARPA-E)
Brookhaven National Laboratory
California Public Utility Commission (CPUC)
Cambridge University
China Electrical Power Research Initiative (CEPRI)
Companies and organisations to look into
Electric Power Research Institute (EPRI)
Electric Vehicle Initiative (EVI)
Electricity Storage Association
European Commission
European Institute for Energy Research (EIFER)
European Parliament
European Photovoltaic Industry Association (EPIA)
European Union (EU)
Fraunhofer Center for Energy Storage
Fraunhofer Institute
German National Research Center for Aeronautics
Germany Federal Association of Energy and Water Industries (BDEW)
Germany Federal Association of Energy Storage (BVES)
Global Wind Energy Council (GWEC)
Hessian Ministry for the Environment, Energy, Agriculture and Consumer Protection
High Energy Research Organisation
International Energy Agency (IEA)
Italian Ministry of Economy and Finances
Japan the Ministry of Economy, Trade and Industry (METI)
Korea Institute of Energy Research (KIER)
Lawrence Berkeley National Lab
National Energy Administration (NEA)
Ontario Ministry of Energy
Organisation for Economic Co-operation and Development (OECD)
REN21 (The Renewable Energy Network for the 21st Century)
Southern California Edison
Swiss Federal Office of Energy (SFOE)
Texas Centre for Superconductivity
Toyota Research Institute of North America (TRINA)
UK Department of Energy and Climate Change (DECC)
UK National Grid
United States Department of Energy (DOE).
Universität Magdeburg
United Nations Framework Convention on Climate Change (UNFCC)
US Energy Information Administration (EIA)
US Federal Energy Regulatory Commission (FERC)
Vehicle Technologies Office (VTO)
Download sample pages
Complete the form below to download your free sample pages for Next Generation Energy Storage Technologies (EST) Market Forecast 2017-2027Download sample pages
Complete the form below to download your free sample pages for Next Generation Energy Storage Technologies (EST) Market Forecast 2017-2027Do you have any custom requirements we can help you with?
Any specific country, geo region, market segment or specific company information?
Email us today, we can discuss your needs and see how we can help: jamie.roberts@visiongain.com
Would you like a free report overview of the report of your choice?
If so, please drop an email to Jamie Roberts stating your chosen report title to jamie.roberts@visiongain.com
Visiongain energy reports are compiled using a broad and rich mixture of both primary and secondary information to produce an overall industry outlook. In order to provide our clients with the best product possible product, we do not rely on any one single source of information. Visiongain analysts reach out to market-leading vendors and industry experts where possible but also review a wealth of financial data and product information from a vast range of sources. To find out more about our reports methodology, please email jamie.roberts@visiongain.com
Would you like to get the latest Visiongain energy reports catalogue?
What are the dynamic growth sectors? where are the regional business opportunities?
Which technologies will prevail and who are the leading companies succeeding in these sectors and why?
If you want definitive answers to business critical questions, discover Visiongain’s full range of business intelligence reports.
If so, please email Jamie Roberts on jamie.roberts@visiongain.com or call her today on +44 207 336 6100
“The Visiongain report was extremely insightful and helped us construct our basic go-to market strategy for our solution.”
H.
“F.B has used Visiongain to prepare two separate market studies on the ceramic proppants market over the last 12 months. These reports have been professionally researched and written and have assisted FBX greatly in developing its business strategy and investment plans.”
F.B
“We just received your very interesting report on the Energy Storage Technologies (EST) Market and this is a very impressive and useful document on that subject.”
I.E.N
“Visiongain does an outstanding job on putting the reports together and provides valuable insight at the right informative level for our needs. The EOR Visiongain report provided confirmation and market outlook data for EOR in MENA with the leading countries being Oman, Kuwait and eventually Saudi Arabia.”
E.S
“Visiongain produced a comprehensive, well-structured GTL Market report striking a good balance between scope and detail, global and local perspective, large and small industry segments. It is an informative forecast, useful for practitioners as a trusted and upto-date reference.”
Y.N Ltd
Association of Dutch Suppliers in the Oil & Gas Industry
Society of Naval Architects & Marine Engineers
Association of Diving Contractors
Association of Diving Contractors International
Associazione Imprese Subacquee Italiane
Australian Petroleum Production & Exploration Association
Brazilian Association of Offshore Support Companies
Brazilian Petroleum Institute
Canadian Energy Pipeline
Diving Medical Advisory Committee
European Diving Technology Committee
French Oil and Gas Industry Council
IMarEST – Institute of Marine Engineering, Science & Technology
International Association of Drilling Contractors
International Association of Geophysical Contractors
International Association of Oil & Gas Producers
International Chamber of Shipping
International Shipping Federation
International Marine Contractors Association
International Tanker Owners Pollution Federation
Leading Oil & Gas Industry Competitiveness
Maritime Energy Association
National Ocean Industries Association
Netherlands Oil and Gas Exploration and Production Association
NOF Energy
Norsk olje og gass Norwegian Oil and Gas Association
Offshore Contractors’ Association
Offshore Mechanical Handling Equipment Committee
Oil & Gas UK
Oil Companies International Marine Forum
Ontario Petroleum Institute
Organisation of the Petroleum Exporting Countries
Regional Association of Oil and Natural Gas Companies in Latin America and the Caribbean
Society for Underwater Technology
Society of Maritime Industries
Society of Petroleum Engineers
Society of Petroleum Enginners – Calgary
Step Change in Safety
Subsea UK
The East of England Energy Group
UK Petroleum Industry Association
All the events postponed due to COVID-19.
Don’t Miss Out!
Latest Energy news
Energy as a Service (EaaS) Market
The global Energy as a Service (EaaS) market is projected to grow at a CAGR of 12.6% by 2034
25 July 2024
Synthetic Fuels Market
The global Synthetic Fuels market is projected to grow at a CAGR of 23% by 2034
18 July 2024
Power-to-X (P2X) Market
The global Power-to-X (P2X) market is projected to grow at a CAGR of 10.6% by 2034
09 July 2024
Airborne Wind Energy Market
The global Airborne Wind Energy market is projected to grow at a CAGR of 9.7% by 2034
05 June 2024


