Visiongain has calculated that the LNG Carrier market will see a capital expenditure (CAPEX) of $10,281 mn in 2017. Read on to discover the potential business opportunities available.
Liquefied Natural Gas (LNG) is one of the most commercially-viable energy solutions adopted by developing economies such as Asia Pacific to fulfil their energy requirements. Looking at the growth prospects, it is evident that access to economic and abundant energy sources would be a crucial factor supporting the momentum of this growth.
The LNG carrier market is driven by the arbitrage opportunity that exists between the supply side (North America, Africa, Qatar, Australia and Russia) and demand side (East Asia, Europe and emerging importers) of the LNG market. Very strong dynamics on both sides has created an opportunity for profits to be made. However, this opportunity can be constrained by lack of liquefaction capacity or LNG carriers.
In recent years, a large number of LNG carriers have been constructed, however, as prices fell, and the global market started to experience an oversupply of LNG due to a slowdown in LNG demand growth Since most LNG is sold on long-term contracts that are linked to the price of oil, LNG prices have also fallen and will continue to fall into 2017.
Visiongain’s global LNG Carrier market report can keep you informed and up to date with the developments in the market.
With reference to this report, it details the key investments trend in the global market, subdivided by regions, capital expenditure and projects. Through extensive secondary research and interviews with industry experts, visiongain has identified a series of market trends that will impact the LNG Carrier market over the forecast timeframe.
The report will answer questions such as:
– How is the Liquefied Natural Gas (LNG) Carrier market evolving?
– What is driving and restraining the Liquefied Natural Gas (LNG) Carrier market dynamics?
– How will each submarket segment grow over the forecast period and how much sales will these submarkets account for in 2027?
– How will market shares of each the Liquefied Natural Gas (LNG) Carrier submarket develop from 2017-2027?
– Which individual technologies/type will prevail and how will these shifts be responded to?
– Which Liquefied Natural Gas (LNG) Carrier submarket will be the main driver of the overall market from 2017-2027?
– How will political and regulatory factors influence regional the Liquefied Natural Gas (LNG) Carrier market and submarkets?
– Will leading national the Liquefied Natural Gas (LNG) Carrier market broadly follow macroeconomic dynamics, or will individual country sectors outperform the rest of the economy?
– How will market shares of the national markets change by 2027 and which nation will lead the market in 2027?
– Who are the leading players and what are their prospects over the forecast period?
– How will the sector evolve as alliances form during the period between 2017 and 2027?
Five Reasons Why You Must Order and Read This Report Today:
1) The report provides forecasts for the four main containment systems in the LNG carrier market
– GTT No 96 CAPEX 2017-2027
– T-Mark III and Mark Flex CAPEX 2017-2027
– Moss CAPEX 2017-2027
– SPB CAPEX 2017-2027
2) The report provides CAPEX forecasts (2017-2027), plus analysis, for four national LNG carrier constructor markets, providing unique insight into LNG industry development
– South Korea CAPEX 2017-2027
– Japan CAPEX 2017-2027
– China CAPEX 2017-2027
– India CAPEX 2017-2027
3) The report reveals tables detailing all existing and scrapped LNG carriers, as well as the full order book of upcoming carriers:
Existing Carriers:
– Ship Name
– Year Built
– Shipbuilder
– Operator
– Capacity
– Containment System
Order Book:
– Shipbuilder
– Expected Delivery Date
– Operator
– Containment System
– Capacity
4) The report includes Expert opinion regarding the LNG Carrier Market and its Future Outlook
– Mitsubishi Heavy Industries, Ltd.
5) The report provides market share and detailed profiles of the leading companies operating within the LNG Carrier market:
– Samsung Heavy Industries (SHI)
– Kawasaki Heavy Industries
– NYK Line.
– Misc Berhad
– STX Offshore and Shipbuilding
– Hudong Zhonghua
– Daewoo Shipbuilding and Marine Engineering (DSME)
– Mitsubishi Heavy Industries, Ltd.
– Maran Gas Maritime Inc. (MGM)
– Hyundai Heavy Industries Co., Ltd.
This independent 247-page report guarantees you will remain better informed than your competitors. With 108 tables and figures examining the LNG Carrier market space, the report gives you a direct, detailed breakdown of the market. PLUS, Capital expenditure AND details of all existing and scrapped LNG carriers, as well as the full order book of upcoming carriers from 2017-2027. This report will keep your knowledge that one step ahead of your rivals.
This report is essential reading for you or anyone in the Oil and Gas sector. Purchasing this report today will help you to recognise those important market opportunities and understand the possibilities there. I look forward to receiving your order.
Visiongain is a trading partner with the US Federal Government
CCR Ref number: KD4R6
1. Report Overview
1.1 Liquefied Natural Gas (LNG) Carrier Market Overview
1.2 Market Structure Overview and Market Definition
1.3 Why You Should Read This Report
1.4 How This Report Delivers
1.5 Key Questions Answered by This Analytical Report Include:
1.6 Who is This Report For?
1.7 Methodology
1.7.1 Primary Research
1.7.2 Secondary Research
1.7.3 Market Evaluation & Forecasting Methodology
1.8 Frequently Asked Questions (FAQ)
1.9 Associated Visiongain Reports
1.10 About Visiongain
2. Introduction to the Liquefied Natural Gas (LNG) Carrier Market
2.1 Global LNG Carrier Market Structure
2.2 Market Definition
2.3 LNG Carrier Industry Outlook
2.4 LNG- Value Chain Analysis
3. Global Overview of Liquefied Natural Gas (LNG)Carrier Market 2017-2027
3.1 Demand Side Factors
3.2 Supply-Side Drivers
3.3 Global LNG Market: Where Are We Now; Where Will We Be in 5 Years; Where Will We Be in 10 Years?
3.4 Oil Price Analysis
3.5 Supply-Side Factors
3.6 Demand-Side Factors
3.7 Other Major Variables that Impact the Oil Price
3.8 Oil Price and LNG Price Relationship
3.9 Towards an Oversupplied LNG Market
3.10 LNG Carriers Fleet and Historical Data
3.11 Global Liquefied Natural Gas (LNG) Carrier Drivers and Restraints
4. Liquefied Natural Gas (LNG) Carrier Submarkets Forecasts 2017-2027
4.1 Global Liquefied Natural Gas (LNG) Carrier Submarkets Forecasts, by Type 2017-2027
4.1.1 Global GTT No 96 Liquefied Natural Gas (LNG) Carrier Forecasts 2017-2027
4.1.2 Global Mark III Forecasts 2017-2027
4.1.3 Global Moss Forecasts 2017-2027
4.1.4 Global SPB Forecasts 2017-2027
4.1.5 Global Small Scale Forecasts 2017-2027
4.1.5.1 Small-Scale LNG Carriers Represent a Logical Expansion of LNG Supply Chain
4.1.5.2 Expanding Use of Satellite Stations
4.1.5.3 Development of River-Based LNG Carriers
4.1.5.4 Use of Small-Scale LNG for Island Distribution
4.1.5.5 Expansion of LNG Bunkering
4.1.5.6 Small-Scale LNG Containment Technology Advantage
4.1.5.7 Japanese Small-Scale LNG Prospects
4.1.5.8 Ship-to-Ship Transfers of LNG
4.1.5.9 Environmental Benefits and Small-Scale LNG Carriers
4.1.5.10 LNG Transportation Sector
5. Leading Regional Players in Liquefied Natural Gas (LNG) Carrier Market 2017-2027
5.1 China LNG Carrier Market 2017-2027
5.1.1 Chinese Demand for LNG Carriers
5.1.2 Are Expanding Natural Gas Pipeline Supplies to China a Threat to the Chinese LNG Carrier Market?
5.1.3 Increasing Numbers of Chinese Shipyards Capable of Building LNG Carriers
5.1.4 LNG Carrier Construction and the Chinese Yuan
5.1.5 Labour Costs, Foreign Orders and Attractive Financing
5.1.6 Small-Scale LNG Carrier Construction in China
5.1.7 Limitations on LNG Carrier Market in China
5.1.8 Chinese LNG Carrier Orders
5.1.9 China Liquefied Natural Gas (LNG) Carrier Drivers and Restraints
5.2 Japan LNG Carrier Market 2017-2027
5.2.1 The Japanese Yen and LNG Carrier Orders
5.2.2 Are Wage Levels Affecting Japanese LNG Carrier Orders?
5.2.3 The Competitive Advantage of Japanese LNG Carriers
5.2.4 Shift Away From Long-Term Contracts Hurting Japanese LNG Carrier Construction Industry
5.2.5 The Potential for More LNG Carrier Construction in Japan
5.2.6 The Challenge of China to Japanese LNG Carrier Builders
5.2.7 The Advantage of Moss Spherical Containment Systems (Only Used by Japanese Shipbuilders)
5.2.8 The Small-Scale LNG Carrier Market in Japan
5.2.9 The Challenge to Japanese LNG Carrier Builders of South Korean Shipbuilders
5.2.10 Japanese LNG Carrier Orders
5.2.11 Japan Liquefied Natural Gas (LNG) Carrier Drivers and Restraints
5.3 South Korea LNG Carrier Market 2017-2027
5.3.1 Bulk Orders Potential Provides Competitive Advantage
5.3.2 Highly Trusted Status of South Korean Shipbuilders
5.3.3 Q-Max and Q-Flex Vessel History
5.3.4 The Challenge to South Korea of Chinese Shipbuilders
5.3.5 South Korean LNG Carrier Propulsion Systems Provide Competitive Advantage
5.3.6 South Korean Shipbuilding Expertise Depth
5.3.7 South Korean LNG Carrier Orders
5.3.8 South Korea Liquefied Natural Gas (LNG) Carrier Drivers and Restraints
5.4 India LNG Carrier Market 2017-2027
5.4.1 Pipapav Defence and Offshore Engineering Ltd.
5.4.2 L&T Shipbuilding Ltd.
5.4.3 Cochin Shipyard Ltd.
5.4.4 Other National LNG Building Shipyards with Past Orders
5.4.5 India Liquefied Natural Gas (LNG) Carrier Drivers and Restraints
5.5 Rest of the World LNG Carrier Market 2017-2027
5.5.1 East African LNG Exports and the LNG Carrier Market
5.5.2 The Impact of North American LNG Exports on the LNG Carrier Market
5.5.3 West African Natural Gas Supply, LNG Carrier Mileage and LNG Carrier Demand
5.5.4 Norway, Russia and Ice-Class LNG Carriers
5.5.5 Rest of the World Liquefied Natural Gas (LNG) Carrier Drivers and Restraints
6. PESTEL Analysis of the LNG Carrier Market
6.1 PEST Analysis
7. Expert Opinion
7.1 Primary Correspondents - Mitsubishi Heavy Industries, Ltd.
7.2 Global Liquefied Natural Gas (LNG) Carrier Outlook
7.3 Driver & Restraints
7.4 Dominant Region/Country in the LNG Carrier Market
7.6 Overall Growth Rate
8. Leading Companies in LNG Carrier Market
8.1 Global LNG Carrier Market, Company Market Share (%), 2016
8.2 Samsung Heavy Industries (SHI)
8.2.1 Samsung Heavy Industries (SHI) Business Overview
8.2.2 Samsung Heavy Industries (SHI) Future Outlook
8.3 Kawasaki Heavy Industries
8.3.1 Kawasaki Heavy Industries Business Overview
8.3.2 Kawasaki Heavy Industries Future Outlook
8.4 NYK Line.
8.4.1 NYK Line. Business Overview
8.4.2 NYK Line. Future Outlook
8.5 Misc Berhad
8.5.1 Misc Berhad Business Overview
8.5.2 Misc Berhad Future Outlook
8.6 STX Offshore and Shipbuilding
8.6.1 STX Offshore and Shipbuilding Business Overview
8.6.2 STX Offshore and Shipbuilding Future Outlook
8.7 Hudong Zhonghua
8.7.1 Hudong Zhonghua Business Overview
8.7.2 Hudong Zhonghua Future Outlook
8.8 Daewoo Shipbuilding and Marine Engineering (DSME)
8.8.1 Daewoo Shipbuilding and Marine Engineering (DSME) Business Overview
8.8.2 Daewoo Shipbuilding and Marine Engineering (DSME) Future Outlook
8.9 Mitsubishi Heavy Industries, Ltd.
8.9.1 Mitsubishi Heavy Industries, Ltd. Business Overview
8.9.2 Mitsubishi Heavy Industries, Ltd. Future Outlook
8.10 Maran Gas Maritime Inc. (MGM)
8.10.1 Maran Gas Maritime Inc. (MGM) Business Overview
8.10.2 Maran Gas Maritime Inc. (MGM) Future Outlook
8.11 Hyundai Heavy Industries Co., Ltd.
8.11.1 Hyundai Heavy Industries Co., Ltd. Business Overview
8.11.2 Hyundai Heavy Industries Co., Ltd. Future Outlook
9. Conclusions and Recommendations
9.1 Key Findings
9.2 Recommendations
10. Glossary
Appendix
Associated Visiongain Reports
Visiongain Report Sales Order Form
Appendix A
Appendix B
Visiongain Report Evaluation Form
List of Tables
Table 1.1 Global LNG Carrier Market by Regional Market Forecast 2017-2027 ($ mn, AGR %, CAGR)
Table 3.1 Global Liquefied Natural Gas (LNG) Carrier Forecast 2017-2027 ($mn, AGR %, CAGR %, Cumulative)
Table 3.2 LNG Carriers List, Above 60,000cm of Capacity, (Year Built, Ship Name, Shipbuilder, Capacity (cm), Operator, Cargo System)
Table 3.3 Global Liquefaction Natural Gas (LNG) Carrier Drivers and Restraints
Table 4.1 Global Liquefied Natural Gas (LNG) Carrier Market Forecast 2017-2027 ($mn, AGR %, Cumulative)
Table 4.2 Global GTT No 96 Liquefied Natural Gas (LNG) Carrier Forecast 2017-2027($mn, AGR %, CAGR %, Cumulative)
Table 4.3 GTT No. 96 LNG Carrier Orders (Containment System, Shipbuilder, Owner, Year, Capacity (cm))
Table 4.4 Global GTT No. 96 Drivers and Restraints
Table 4.5 Global Mark III Liquefied Natural Gas Carrier Forecast 2017-2027($mn, AGR %, CAGR %, Cumulative)
Table 4.6 Mark III LNG Carrier Orders (Containment System, Shipbuilder, Owner, Year, Capacity (cm))
Table 4.7 Global Mark III Drivers and Restraints
Table 4.8 Global Moss Liquefied Natural Gas Carrier Forecast 2017-2027($mn, AGR %, CAGR %, Cumulative)
Table 4.9 Moss LNG Carrier Orders (Containment System, Shipbuilder, Owner, Year, Capacity (cm))
Table 4.10 Global Moss Drivers and Restraints
Table 4.11 Global SPB Liquefied Natural Gas Carrier Forecast 2017-2027($mn, AGR %, CAGR %, Cumulative)
Table 4.12 SPB LNG Carrier Orders (Containment System, Shipbuilder, Owner, Year, Capacity (cm))
Table 4.13 Global SBP Drivers and Restraints
Table 4.14 Global Small Scale Liquefied Natural Gas Carrier Forecast 2017-2027($mn, AGR %, CAGR %, Cumulative)
Table 5.1 Global LNG Carrier Market, by Country/Region Forecast 2017-2027 ($mn, AGR %, Cumulative)
Table 5.2 China LNG Carrier CAPEX 2017-2027 ($m, AGR %, Cumulative)
Table 5.3 Chinese LNG Import Terminals (Country, Terminal Name, Start Year, Capacity (MTPA), EPC Cost ($), Owners, Status)
Table 5.4 Current Chinese LNG Carrier Order Book (Containment System, Shipbuilder, Owner, Delivery Year, Capacity (cm))
Table 5.5 China Liquefaction Natural Gas (LNG) Carrier Drivers and Restraints
Table 5.6 Japan LNG Carrier CAPEX 2017-2027 ($m, AGR %, Cumulative)
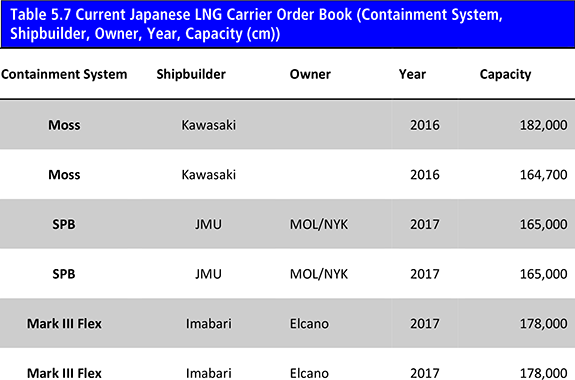
Table 5.7 Current Japanese LNG Carrier Order Book (Containment System, Shipbuilder, Owner, Year, Capacity (cm))
Table 5.8 Japan Liquefaction Natural Gas (LNG) Carrier Drivers and Restraints
Table 5.9 South Korea LNG Carrier CAPEX 2017-2027 ($m, AGR %, Cumulative)
Table 5.10 Current South Korean LNG Carrier Order Book (Containment System, Shipbuilder, Owner, Year, Capacity(cm)
Table 5.11 South Korea Liquefaction Natural Gas (LNG) Carrier Drivers and Restraints
Table 5.12 India LNG Carrier CAPEX 2017-2027 ($m, AGR %, Cumulative)
Table 5.13 India Liquefaction Natural Gas (LNG) Carrier Drivers and Restraints
Table 5.14 Rest of the World LNG Carrier CAPEX 2017-2027 ($m, AGR %, Cumulative)
Table 5.15 Rest of the World Liquefaction Natural Gas (LNG) Carrier Drivers and Restraints
Table 8.1 Samsung Heavy Industries (SHI) Profile 2016 (Market Entry, Public/Private, Headquarters, Total Company Sales $mn, Change in Revenue, Geography, Key Markets, Company Sales from Hydrogen Generator Market, Listed on, Products/Services Strongest Business Region, No. of Employees)
Table 8.2 Samsung Heavy Industries (SHI) LNG Carrier Orders (Containment System, Shipbuilder, Owner, Year, Capacity (cm))
Table 8.3 Samsung Heavy Industries (SHI) Total Company Sales 2012-2016 ($ bn, AGR %)
Table 8.4 Kawasaki Heavy Industries Profile 2015 (Market Entry, Public/Private, Headquarter, Total Company Sales $bn, Change in Revenue, Geography, Key Market, Company Sales from Hydrogen Generator Market, Listed on, Products/Services Strongest Business Region, No. of Employees)
Table 8.5 Kawasaki Heavy Industries LNG Carrier Orders (Containment System, Shipbuilder, Owner, Year, Capacity (cm))
Table 8.6 Kawasaki Heavy Industries Total Company Sales 2013-2016 ($ bn, AGR %)
Table 8.7 NYK Line. Profile 2016 (Market Entry, Public/Private, Headquarter, Total Company Sales $bn, Change in Revenue, Geography, Key Market, Company Sales from Hydrogen Generator Market, Listed on, Products/Services Strongest Business Region, Submarket Involvement, No. of Employees)
Table 8.8 NYK Line. LNG Carrier Orders (Containment System, Shipbuilder, Owner, Year, Capacity (cm))
Table 8.9 NYK Line. Total Company Sales 2012-2016 ($ bn, AGR %)
Table 8.10 Misc Berhad Profile 2016 (Market Entry, Public/Private, Headquarter, Total Company Sales $bn, Change in Revenue, Geography, Key Market, Company Sales from Hydrogen Generator Market, Listed on, Products/Services Strongest Business Region, Submarket Involvement, No. of Employees)
Table 8.11 Misc Berhad LNG Carrier Orders (Containment System, Shipbuilder, Owner, Year, Capacity)
Table 8.12 Misc Berhad Total Company Sales 2013-2016 ($ bn, AGR %)
Table 8.13 STX Offshore and Shipbuilding Profile 2016 (Market Entry, Public/Private, Headquarter, Total Company Sales $bn, Change in Revenue, Geography, Key Market, Company Sales from Hydrogen Generator Market, Listed on, Products/Services Strongest Business Region, Submarket Involvement, No. of Employees)
Table 8.14 Hudong Zhonghua Profile 2016 (Market Entry, Public/Private, Headquarter, Total Company Sales $bn, Change in Revenue, Geography, Key Market, Company Sales from Hydrogen Generator Market, Listed on, Products/Services Strongest Business Region, Submarket Involvement, No. of Employees)
Table 8.15 Hudong Zhonghua LNG Carrier Orders (Containment System, Shipbuilder, Owner, Year, Capacity (cm))
Table 8.16 Daewoo Shipbuilding and Marine Engineering (DSME) Profile 2016 (Market Entry, Public/Private, Headquarter, Total Company Sales $bn, Change in Revenue, Geography, Key Market, Company Sales from Hydrogen Generator Market, Listed on, Products/Services Strongest Business Region, Submarket Involvement, No. of Employees)
Table 8.17 Daewoo Shipbuilding and Marine Engineering (DSME) Total Company Sales 2013-2016 ($ bn, AGR %)
Table 8.18 Mitsubishi Heavy Industries, Ltd. Profile 2016(Market Entry, Public/Private, Headquarter, Total Company Sales $bn, Change in Revenue, Geography, Key Market, Company Sales from Hydrogen Generator Market, Listed on, Products/Services Strongest Business Region, Submarket Involvement, No. of Employees)
Table 8.19 Mitsubishi Heavy Industries Ltd. LNG Carrier Orders (Containment System, Shipbuilder, Owner, Year, Capacity (cm))
Table 8.20 Mitsubishi Heavy Industries Ltd. Total Company Sales 2012-2016 ($ bn, AGR %)
Table 8.21 Maran Gas Maritime Inc. (MGM) Profile 2016(Market Entry, Public/Private, Headquarter, Total Company Sales $mn, Change in Revenue, Geography, Key Market, Company Sales from Hydrogen Generator Market, Listed on, Products/Services Strongest Business Region, Submarket Involvement, No. of Employees)
Table 8.22 Maran Gas Maritime Inc. (MGM) LNG Carrier Orders (Containment System, Shipbuilder, Owner, Year, Capacity (cm))
Table 8.23 Hyundai Heavy Industries Co., Ltd. Profile 2016 (Market Entry, Public/Private, Headquarter, Total Company Sales $mn, Change in Revenue, Geography, Key Market, Company Sales from Hydrogen Generator Market, Listed on, Products/Services Strongest Business Region, Submarket Involvement, No. of Employees)
Table 8.24 Hyundai Heavy Industries Co. and Hyundai Samho LNG Carrier Orders (Containment System, Shipbuilder, Owner, Year, Capacity (cm))
List of Figures
Figure 1.1 LNG Carrier Market by Country/Region Market Share Forecast 2017, 2022, 2027 (% Share)
Figure 2.1 Global LNG Carrier Market Segmentation Overview
Figure 2.2 LNG Carrier, Value Chain Analysis
Figure 3.1 Global Liquefied Natural Gas (LNG) Carrier Forecast 2017-2027 ($mn, AGR %)
Figure 3.2 Top 10 LNG Exporter Countries (Million Tons), 2016
Figure 3.3 WTI, Brent, Dubai, Nigerian Forcados Oil Prices 2000-2016 ($/bbl)
Figure 4.1 Global Liquefied Natural Gas (LNG) Carrier Submarket Forecast 2017-2027 ($mn)
Figure 4.2 Global Liquefied Natural Gas (LNG) Carrier Market by Type (CAPEX) Share Forecast 2017, 2022, 2027 (% Share)
Figure 4.3 Liquefied Natural Gas (LNG) Carrier Market, By GTT No 96 Forecast 2017-2027 ($mn, AGR%)
Figure 4.4 Liquefied Natural Gas (LNG) Carrier Market, By Mark III Forecast 2017-2027 ($mn, AGR%)
Figure 4.5 Liquefied Natural Gas (LNG) Carrier Market, By Moss Forecast 2017-2027 ($mn, AGR%)
Figure 4.6 Liquefied Natural Gas (LNG) Carrier Market, By SPB Forecast 2017-2027 ($mn, AGR%)
Figure 4.7 Liquefied Natural Gas (LNG) Carrier Market, By Small Scale Forecast 2017-2027 ($mn, AGR%)
Figure 4.8 LNG Bunkering Capacity Forecast (bcm), 2015-2025
Figure 5.1 Regional LNG Carrier Market, by CAPEX 2017-2027
Figure 5.2 Regional LNG Carrier Market 2017-2027
Figure 5.3 Leading Country/Regional LNG Carrier Market Share, by CAPEX 2017
Figure 5.4 Leading Country/Regional LNG Carrier Market Share, by CAPEX 2022
Figure 5.5 Leading Country/Regional LNG Carrier Market Share, 2027
Figure 5.6 China LNG Carrier Forecast 2017-2027 ($mn, AGR%)
Figure 5.7 China LNG Carrier Share Forecast 2017, 2022, 2027 (% Share)
Figure 5.8: China LNG Carrier, by Type, 2016
Figure 5.9 Japan LNG Carrier Forecast 2017-2027 ($mn, AGR%)
Figure 5.10 Japan LNG Carrier Share Forecast 2017, 2022, 2027 (% Share)
Figure 5.11 Japan LNG Carrier, by Type, 2016
Figure 5.12 South Korea LNG Carrier Forecast 2017-2027 ($mn, AGR%)
Figure 5.13 South Korea LNG Carrier Share Forecast 2017, 2022, 2027 (% Share)
Figure 5.14 South Korea LNG Carrier, by Type, 2016
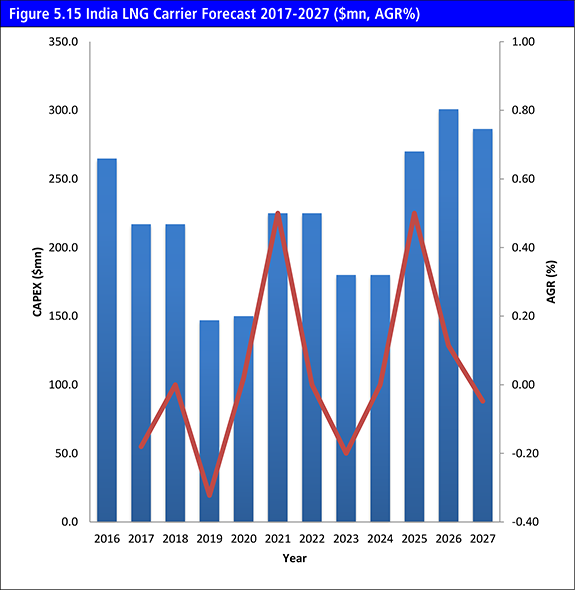
Figure 5.15 India LNG Carrier Forecast 2017-2027 ($mn, AGR%)
Figure 5.16 India LNG Carrier Share Forecast 2017, 2022, 2027 (% Share)
Figure 5.17 India LNG Carrier, by Type, 2016
Figure 5.18 Rest of the World LNG Carrier Forecast 2017-2027 ($mn, AGR%)
Figure 5.19 Rest of the World LNG Carrier Share Forecast 2017, 2022, 2027 (% Share)
Figure 5.20 Rest of the World LNG Carrier, by Type, 2016
Figure 8.1 Leading Companies Market Share, 2016 LNG Carrier Market
Figure 8.2 Leading Companies Market Share, 2016 LNG Carrier Market
Figure 8.3 Samsung Heavy Industries (SHI), LNG Carrier Types Delivered and Under Construction Status 2016
Figure 8.4 Samsung Heavy Industries (SHI) Revenue, ($bn & AGR %), Y-o-Y Revenue Growth, 2012-2016
Figure 8.5 Kawasaki Heavy Industries, % Revenue Share, by Business Segment, 2016
Figure 8.6 Kawasaki Heavy Industries, % Revenue Share, by Geographical Segment, 2017
Figure 8.7 Kawasaki Heavy Industries Revenue, ($bn & AGR %), Y-o-Y Revenue Growth, 2013-2017
Figure 8.8 NYK Line., % Revenue Share, by Business Segment, 2017
Figure 8.9 NYK Line. Revenue, ($bn & AGR %), Y-o-Y Revenue Growth, 2014-2017
Figure 8.10 Misc Berhad LNG Revenue, ($bn & AGR %), Y-o-Y Revenue Growth, 2013-2016
Figure 8.11 Misc Berhad Revenue Breakup, by Business Segment, 2016
Figure 8.12 Daewoo Shipbuilding and Marine Engineering (DSME), % Revenue Share, by Business Segment, 2016
Figure 8.13 Daewoo Shipbuilding and Marine Engineering (DSME), ($mn & AGR %), Y-o-Y Revenue Growth, 2013-2016
Figure 8.14 Mitsubishi Heavy Industries Ltd., % Revenue Share, by Business Segment, 2016
Figure 8.15 Mitsubishi Heavy Industries Ltd., % Revenue Share, by Geography Segment, 2016
Figure 8.16 Mitsubishi Heavy Industries Ltd. Revenue, ($bn & AGR %), Y-o-Y Revenue Growth, 2012-2016
Figure 8.17 Hyundai Heavy Industries Co., % Revenue Share, by Sales Order Breakdown, 2013


