Ionic Liquids market
The study Ionic Liquids Market offers insights on various drivers and trends driving the market along with R&D progress, and predicted revenues.
Where is the Ionic Liquids Market heading? If you are involved in this industry you must read this newly updated report. Visiongain’s report shows you the potential revenues streams to 2030, assessing data, trends, opportunities and business prospects there.
Discover how to stay ahead
Our 207-page report provides 170+ tables, 90+ charts, and graphs. Read on to discover the most lucrative areas in the industry and the future market prospects. Our new study lets you assess forecasted sales at overall world market and regional level. See financial performance of companies, latest news, and revenues. Ensure you remain competitive as new innovations by existing key players boost the market. Much opportunity remains in this growing Ionic Liquids Market. See how to exploit the opportunities.
Forecasts to 2030 and other analyses reveal the commercial prospects
• In addition to revenue forecasting to 2030, for application, regional, and national level markets, our new study provides you with recent results, growth rates, and market shares.
• You will find original analyses, with business outlooks and developments.
• Discover qualitative analyses (including market dynamics, drivers, and restraints), Value chain, PESTEL, Porters’ Five Forces, and SWOT analysis.
• The study covers the competitive landscape of existing/prospective players in the industry and their strategic initiatives for the product development
The study covers a qualitative and quantitative analysis of the market segmented on the basis of application. Moreover, the study provides similar information for the key geographies.
Discover sales predictions for the world market and submarkets
Along with revenue prediction for the overall world market, there are following segments, each forecasted at a global and regional level.
This report includes data analysis and invaluable insight into how COVID-19 will affect your industry. Access this report today.
To access the data contained in this document please email contactus@visiongain.com
Global Ionic Liquids Market By Application:
• Solvents & catalysts
• Extractions & Separations
• Bio-refineries
• Energy storage
• Others
Global Ionic Liquids Market By Region & Country:
• North America
• U.S.
• Canada
• Mexico
• Europe
• Germany
• France
• UK
• Spain
• Italy
• Netherlands
• Belgium
• Rest of Europe
• Asia Pacific
• China
• India
• Japan
• South Korea
• Vietnam
• Rest of Asia Pacific
• Middle East & Africa
• Saudi Arabia
• Qatar
• Oman
• UAE
• Rest of Middle East & Africa
• South America
• Brazil
• Rest of South America
The report also includes prospects for established firms and those seeking to enter the market– including profiles for over 19 of the major companies involved in the Ionic Liquids Market:
• BASF SE
• Evonik Industries AG
• Merck KGaA
• Solvay
• The Chemours Company
• Proionic GmbH
• KOEI CHEMICAL COMPANY, LIMITED
• Solvionic SA
• CoorsTek Inc.
• Reinste Nanoventure
• Others
Find quantitative and qualitative analyses with independent predictions. Receive information that only our report contains, staying informed with this invaluable business intelligence.
Information found nowhere else
With our newly report title, you are less likely to fall behind in knowledge or miss out on opportunities. See how our work could benefit your research, analyses, and decisions.
Visiongain’s study is for everybody needing commercial analyses for the Ionic Liquids Market and leading companies. You will find data, trends and predictions.
To access the data contained in this document please email contactus@visiongain.com
Buy our report today Ionic Liquids Market Report 2020-2030: Forecasts by Application (Solvents & Catalysts, Extractions & Separations, Bio-refineries, Energy Storage, Others) Plus Detailed Description of Leading Players and Regional & Country Level Analysis. Avoid missing out by staying informed – order our report now.
Visiongain is a trading partner with the US Federal Government
CCR Ref number: KD4R6
Do you have any custom requirements we can help you with? Any need for specific country, geo region, market segment or specific company information? Contact us today, we can discuss your needs and see how we can help: sara.peerun@visiongain.com
1 Report Overview
1.1 Global Ionic Liquids Market Overview
1.2 Why You Should Read This Report
1.3 What the Report Delivers
1.4 Key Questions Answered by This Analytical Report Include:
1.5 Who is This Report For?
1.6 Methodology
1.6.1 Primary Research
1.6.2 Secondary Research
1.6.3 Market Evaluation & Forecasting Methodology
1.7 Frequently Asked Questions (FAQ)
1.8 Associated Visiongain Reports
1.9 About Visiongain
2 Introduction to the Ionic Liquids Market
2.1 Ionic Liquids Market Structure
2.2 Ionic Liquids Market Definition
3 Global Ionic Liquids Market Forecast 2020-2030
3.1 Global Ionic Liquids Market Overview
3.2 COVID Analysis
3.3 Post COVID Analysis
3.4 Macro-Economic Indicators
3.4.1 Growing Environmental Awareness
3.4.2 Replacement of Conventional Solvents by Ionic Liquids
3.4.3 New Emerging Applications of Ionic Liquids
3.5 Value Chain Analysis
3.6 Porter’s Five Forces Analysis
3.7 PESTEL Analysis
3.8 SWOT Analysis
4 Global Ionic Liquids Market Size Forecast 2020-2030 by Application
4.1 Introduction
4.2 COVID Analysis
4.3 Post COVID Analysis
4.4 Solvents & Catalysts
4.4.1 COVID Analysis
4.4.2 Post COVID Analysis
4.5 Extractions & Separations
4.5.1 COVID Analysis
4.5.2 Post COVID Analysis
4.6 Bio-Refineries
4.6.1 COVID Analysis
4.6.2 Post COVID Analysis
4.7 Energy Storage
4.7.1 COVID Analysis
4.7.2 Post COVID Analysis
4.8 Others
4.8.1 COVID Analysis
4.8.2 Post COVID Analysis
5 Regional and Leading National Ionic Liquids Market Forecasts 2020-2030
5.1 Introduction
5.1.1 COVID Analysis
5.1.2 Post COVID Analysis
5.2 North America Ionic Liquids Market Forecast 2020-2030
5.2.1 COVID Analysis
5.2.2 Post COVID Analysis
5.3 US Ionic Liquids Market Forecast 2020-2030
5.4 Canada Ionic Liquids Market Forecast 2020-2030
5.5 Mexico Ionic Liquids Market Forecast 2020-2030
5.6 Europe Ionic Liquids Market Forecast 2020-2030
5.6.1 COVID Analysis
5.6.2 Post COVID Analysis
5.7 Germany Ionic Liquids Market Forecast 2020-2030
5.8 France Ionic Liquids Market Forecast 2020-2030
5.9 UK Ionic Liquids Market Forecast 2020-2030
5.10 Spain Ionic Liquids Market Forecast 2020-2030
5.11 Italy Ionic Liquids Market Forecast 2020-2030
5.12 Netherlands Ionic Liquids Market Forecast 2020-2030
5.13 Belgium Ionic Liquids Market Forecast 2020-2030
5.14 Rest of Europe Ionic Liquids Market Forecast 2020-2030
5.15 Asia Pacific Ionic Liquids Market Forecast 2020-2030
5.15.1 COVID Analysis
5.15.2 Post COVID Analysis
5.16 China Ionic Liquids Market Forecast 2020-2030
5.17 India Ionic Liquids Market Forecast 2020-2030
5.18 Japan Ionic Liquids Market Forecast 2020-2030
5.19 South Korea Ionic Liquids Market Forecast 2020-2030
5.20 Vietnam Ionic Liquids Market Forecast 2020-2030
5.21 Rest of APAC Ionic Liquids Market Forecast 2020-2030
5.22 Middle East & Africa Ionic Liquids Market Forecast 2020-2030
5.22.1 COVID Analysis
5.22.2 Post COVID Analysis
5.23 Saudi Arabia Ionic Liquids Market Forecast 2020-2030
5.24 Qatar Ionic Liquids Market Forecast 2020-2030
5.25 Oman Ionic Liquids Market Forecast 2020-2030
5.26 UAE Ionic Liquids Market Forecast 2020-2030
5.27 Rest of MEA Ionic Liquids Market Forecast 2020-2030
5.28 South America Ionic Liquids Market Forecast 2020-2030
5.28.1 COVID Analysis
5.28.2 Post COVID Analysis
5.29 Brazil Ionic Liquids Market Forecast 2020-2030
5.30 Rest of SA Ionic Liquids Market Forecast 2020-2030
6 Company Profiles
6.1 BASF SE
6.1.1 Company Overview
6.1.2 Product Offerings
6.1.3 Financial Performance
6.1.4 Recent Developments
6.2 Evonik Industries AG
6.2.1 Company Overview
6.2.2 Product Offerings
6.2.3 Financial Performance
6.2.4 Recent Developments
6.3 Merck KGaA
6.3.1 Company Overview
6.3.2 Product Offerings
6.3.3 Financial Performance
6.3.4 Recent Developments
6.4 Iolitec Ionic Liquids Technologies GmbH
6.4.1 Company Overview
6.4.2 Product Offerings
6.5 The Chemours Company
6.5.1 Company Overview
6.5.2 Product Offerings
6.5.3 Financial Performance
6.5.4 Recent Developments
6.6 Proionic GmbH
6.6.1 Company Overview
6.6.2 Product Offerings
6.6.3 Recent Developments
6.7 Solvionic SA
6.7.1 Company Overview
6.7.2 Product Offerings
6.7.3 Recent Developments
6.8 CoorsTek Inc.
6.8.1 Company Overview
6.8.2 Product Offerings
6.8.3 Recent Developments
6.9 Jiangxi Jinkai Chemical Co., Ltd
6.9.1 Company Overview
6.9.2 Product Offerings
6.10 Reinste Nanoventure
6.10.1 Company Overview
6.10.2 Product Offerings
6.10.3 Recent Developments
6.11 Tatva Chintan Pharma Chem Pvt. Ltd.
6.11.1 Company Overview
6.11.2 Product Offerings
6.11.3 Financial Performance
6.12 Scionix Ltd.
6.12.1 Company Overview
6.12.2 Product Offerings
6.13 Strem Chemicals Inc.
6.13.1 Company Overview
6.13.2 Product Offerings
6.13.3 Recent Developments
6.14 Tokyo Chemical Industry Co.
6.14.1 Company Overview
6.14.2 Product Offerings
6.14.3 Recent Developments
6.15 Solvay
6.15.1 Company Overview
6.15.2 Product Offerings
6.15.3 Financial Performance
6.15.4 Recent Developments
6.16 KOEI CHEMICAL COMPANY, LIMITED
6.16.1 Company Overview
6.16.2 Product Offerings
6.16.3 Financial Performance
6.17 Solaronix SA
6.17.1 Company Overview
6.17.2 Product Offerings
6.17.3 Recent Developments
6.18 Santa Cruz Biotechnology, Inc.
6.18.1 Company Overview
6.18.2 Product Offerings- Ionic Liquids
6.19 Wuhu Huaren Science and Technology Co.,Ltd.
6.19.1 Company Overview
6.19.2 Product Offerings-Ionic Liquids
6.20 Company Market Share & Ranking
7 Conclusion
Associated Visiongain Reports
Visiongain Report Sales Order Form
Appendix A: About Visiongain
Appendix B: Visiongain Report Evaluation Form
List of Figures
Figure 1 Global Ionic Liquids Market by Regional Market Share Forecast 2020, 2025, 2030 (%)
Figure 2 US vs Global Ionic Liquids Market CAGR Forecast 2020-2030, 2020-2025, 2025-2030 (CAGR %)
Figure 3 Global Ionic Liquids Market Segmentation Overview
Figure 4 Global Ionic Liquids Market Segmentation Overview
Figure 5 Global Ionic Liquids Market Revenue Forecast 2020-2030 ($ million, AGR%)
Figure 6 Global Ionic Liquids Market Revenue Forecast COVID Analysis 2020-2030 ($ million, AGR%)
Figure 7 Global Ionic Liquids Market Revenue Forecast Post COVID Analysis 2020-2030 ($ million, AGR%)
Figure 8 Value Chain Analysis
Figure 9 Porter’ Five Forces Analysis
Figure 10 PESTEL Analysis
Figure 11 SWOT Analysis
Figure 12 Global Ionic Liquids Market Segmentation by Application
Figure 13 Global Ionic Liquids Revenue Share 2020-2030 by Application ($ million)
Figure 14 Global Ionic Liquids Market by Application Market Share Forecast 2020, 2025, 2030 (%)
Figure 15 Global Ionic Liquids Revenue Share COVID Analysis 2020-2030 by Application ($ million)
Figure 16 Global Ionic Liquids Revenue Share Post COVID Analysis 2020-2030 by Application ($ million)
Figure 17 Solvents & Catalysts Revenue Forecast 2020-2030 ($ million, AGR%)
Figure 18 Solvents & Catalysts Revenue Forecast COVID Analysis 2020-2030 ($ million, AGR%)
Figure 19 Solvents & Catalysts Revenue Forecast Post COVID Analysis 2020-2030 ($ million, AGR%)
Figure 20 Extractions & Separations Revenue Forecast 2020-2030 ($ million, AGR%)
Figure 21 Extractions & Separations Revenue Forecast COVID Analysis 2020-2030 ($ million, AGR%)
Figure 22 Extractions & Separations Revenue Forecast Post COVID Analysis 2020-2030 ($ million, AGR%)
Figure 23 Bio-refineries Revenue Forecast 2020-2030 ($ million, AGR%)
Figure 24 Bio-refineries Revenue Forecast COVID Analysis 2020-2030 ($ million, AGR%)
Figure 25 Bio-refineries Revenue Forecast Post COVID Analysis 2020-2030 ($ million, AGR%)
Figure 26 Energy Storage Revenue Forecast 2020-2030 ($ million, AGR%)
Figure 27 Energy Storage Revenue Forecast COVID Analysis 2020-2030 ($ million, AGR%)
Figure 28 Energy Storage Revenue Forecast Post COVID Analysis 2020-2030 ($ million, AGR%)
Figure 29 Others Revenue Forecast 2020-2030 ($ million, AGR%)
Figure 30 Others Revenue Forecast COVID Analysis 2020-2030 ($ million, AGR%)
Figure 31 Others Revenue Forecast Post COVID Analysis 2020-2030 ($ million, AGR%)
Figure 32 Global Ionic Liquids Market Segmentation by Region
Figure 33 Global Ionic Liquids Market by Region, 2020-2030 ($ million)
Figure 34 Global Ionic Liquids Market by Regional Market Share Forecast 2020, 2025, 2030 (%)
Figure 35 Global Ionic Liquids Market by Region, COVID Analysis 2020-2030 ($ million)
Figure 36 Global Ionic Liquids Market by Region, Post COVID Analysis 2020-2030 ($ million)
Figure 37 North America Ionic Liquids Market Forecast by Country, 2020, % Share
Figure 38 North America Ionic Liquids Revenue Forecast 2020-2030 ($ million, AGR%)
Figure 39 North America Ionic Liquids Revenue Forecast COVID Analysis 2020-2030 ($ million, AGR%)
Figure 40 North America Ionic Liquids Revenue Forecast Post COVID Analysis 2020-2030 ($ million, AGR%)
Figure 41 US Ionic Liquids Revenue Forecast, By Application, 2020-2030 ($ million)
Figure 42 Canada Ionic Liquids Revenue Forecast, By Application, 2020-2030 ($ million)
Figure 43 Mexico Ionic Liquids Revenue Forecast, By Application, 2020-2030 ($ million)
Figure 44 Europe Ionic Liquids Market Forecast by Country, 2020, % Share
Figure 45 Europe Ionic Liquids Revenue Forecast 2020-2030 ($ million, AGR%)
Figure 46 Europe Ionic Liquids Revenue Forecast COVID Analysis 2020-2030 ($ million, AGR%)
Figure 47 Europe Ionic Liquids Revenue Forecast Post COVID Analysis 2020-2030 ($ million, AGR%)
Figure 48 Germany Ionic Liquids Revenue Forecast, By Application, 2020-2030 ($ million)
Figure 49 France Ionic Liquids Revenue Forecast, By Application, 2020-2030 ($ million)
Figure 50 UK Ionic Liquids Revenue Forecast, By Application, 2020-2030 ($ million)
Figure 51 Spain Ionic Liquids Revenue Forecast, By Application, 2020-2030 ($ million)
Figure 52 Italy Ionic Liquids Revenue Forecast, By Application, 2020-2030 ($ million)
Figure 53 Netherlands Ionic Liquids Revenue Forecast, By Application, 2020-2030 ($ million)
Figure 54 Belgium Ionic Liquids Revenue Forecast, By Application, 2020-2030 ($ million)
Figure 55 Rest of Europe Ionic Liquids Revenue Forecast, By Application, 2020-2030 ($ million)
Figure 56 Asia Pacific Ionic Liquids Market Forecast by Country, 2020, % Share
Figure 57 Asia Pacific Ionic Liquids Revenue Forecast 2020-2030 ($ million, AGR%)
Figure 58 Asia Pacific Ionic Liquids Revenue Forecast COVID Analysis 2020-2030 ($ million, AGR%)
Figure 59 Asia Pacific Ionic Liquids Revenue Forecast Post COVID Analysis 2020-2030 ($ million, AGR%)
Figure 60 China Ionic Liquids Revenue Forecast, By Application, 2020-2030 ($ million)
Figure 61 India Ionic Liquids Revenue Forecast, By Application, 2020-2030 ($ million)
Figure 62 Japan Ionic Liquids Revenue Forecast, By Application, 2020-2030 ($ million)
Figure 63 South Korea Ionic Liquids Revenue Forecast, By Application, 2020-2030 ($ million)
Figure 64 Vietnam Ionic Liquids Revenue Forecast, By Application, 2020-2030 ($ million)
Figure 65 Rest of APAC Ionic Liquids Revenue Forecast, By Application, 2020-2030 ($ million)
Figure 66 Middle East & Africa Ionic Liquids Market Forecast by Country, 2020, % Share
Figure 67 Middle East & Africa Ionic Liquids Revenue Forecast 2020-2030 ($ million, AGR%)
Figure 68 Middle East & Africa Ionic Liquids Revenue Forecast COVID Analysis 2020-2030 ($ million, AGR%)
Figure 69 Middle East & Africa Ionic Liquids Revenue Forecast Post COVID Analysis 2020-2030 ($ million, AGR%)
Figure 70 Saudi Arabia Ionic Liquids Revenue Forecast, By Application, 2020-2030 ($ million)
Figure 71 Qatar Ionic Liquids Revenue Forecast, By Application, 2020-2030 ($ million)
Figure 72 Oman Ionic Liquids Revenue Forecast, By Application, 2020-2030 ($ million)
Figure 73 UAE Ionic Liquids Revenue Forecast, By Application, 2020-2030 ($ million)
Figure 74 Rest of MEA Ionic Liquids Revenue Forecast, By Application, 2020-2030 ($ million)
Figure 75 South America Ionic Liquids Market Forecast by Country, 2020, % Share
Figure 76 South America Ionic Liquids Revenue Forecast 2020-2030 ($ million, AGR%)
Figure 77 South America Ionic Liquids Revenue Forecast COVID Analysis 2020-2030 ($ million, AGR%)
Figure 78 South America Ionic Liquids Revenue Forecast Post COVID Analysis 2020-2030 ($ million, AGR%)
Figure 79 Brazil Ionic Liquids Revenue Forecast, By Application, 2020-2030 ($ million)
Figure 80 Rest of SA Ionic Liquids Revenue Forecast, By Application, 2020-2030 ($ million)
Figure 81 BASF Revenue, By Region, 2018 (%age)
Figure 82 BASF Revenue, By Segment, 2018 (%age)
Figure 83 Evonik Industries AG Revenue, By Segment, 2018 (%age)
Figure 84 Evonik Industries AG Revenue, By Region, 2018 (%age)
Figure 85 Merck KGaA Revenue, By Region, 2018 (%age)
Figure 86 Merck KGaA Revenue, By Segment, 2018 (%age)
Figure 87 The Chemours Company Revenue, By Region, 2018 (%age)
Figure 88 The Chemours Company Revenue, By Segment, 2018 (%age)
Figure 89 Solvay Revenue, By Region, 2018 (%age)
Figure 90 Solvay Revenue, By Segment, 2018 (%age)
Figure 91 KOEI CHEMICAL COMPANY, LIMITED Revenue, By Region, 2018 (%age)
Figure 92 KOEI CHEMICAL COMPANY, LIMITED Revenue, By Segment, 2018 (%age)
List of Tables
Table 1 Global Ionic Liquids Market by Regional Market Forecast 2020-2030 ($ million, AGR %)
Table 2 Global Ionic Liquids Market Forecast, By Region & Countries, 2020-2030 ($ million)
Table 3 Global Ionic Liquids Market Revenue Forecast 2020-2030 ($ million, AGR %, CAGR%)
Table 4 Global Ionic Liquids Market Revenue Forecast COVID Analysis 2020-2030 ($ million, AGR %, CAGR%)
Table 5 Global Ionic Liquids Market Revenue Forecast Post COVID Analysis 2020-2030 ($ million, AGR %, CAGR%)
Table 6 Global Ionic Liquids Revenue Forecast 2020-2030 by Application ($ million, AGR%)
Table 7 Global Ionic Liquids Revenue Forecast COVID Analysis 2020-2030 by Application ($ million, AGR%)
Table 8 Global Ionic Liquids Revenue Forecast Post COVID Analysis 2020-2030 by Application ($ million, AGR%)
Table 9 Solvents & Catalysts Revenue Forecast 2020-2030 ($ million, AGR%, CAGR%)
Table 10 Solvents & Catalysts Revenue Forecast COVID Analysis 2020-2030 ($ million, AGR%, CAGR%)
Table 11 Solvents & Catalysts Revenue Forecast Post COVID Analysis 2020-2030 ($ million, AGR%, CAGR%)
Table 12 Extractions & Separations Revenue Forecast 2020-2030 ($ million, AGR%, CAGR%)
Table 13 Extractions & Separations Revenue Forecast COVID Analysis 2020-2030 ($ million, AGR%, CAGR%)
Table 14 Extractions & Separations Revenue Forecast Post COVID Analysis 2020-2030 ($ million, AGR%, CAGR%)
Table 15 Bio-refineries Revenue Forecast 2020-2030 ($ million, AGR%, CAGR%)
Table 16 Bio-refineries Revenue Forecast COVID Analysis 2020-2030 ($ million, AGR%, CAGR%)
Table 17 Bio-refineries Revenue Forecast Post COVID Analysis 2020-2030 ($ million, AGR%, CAGR%)
Table 18 Energy storage Revenue Forecast 2020-2030 ($ million, AGR%, CAGR%)
Table 19 Energy storage Revenue Forecast COVID Analysis 2020-2030 ($ million, AGR%, CAGR%)
Table 20 Energy storage Revenue Forecast Post COVID Analysis 2020-2030 ($ million, AGR%, CAGR%)
Table 21 Others Revenue Forecast 2020-2030 ($ million, AGR%, CAGR%)
Table 22 Others Revenue Forecast COVID Analysis 2020-2030 ($ million, AGR%, CAGR%)
Table 23 Others Revenue Forecast Post COVID Analysis 2020-2030 ($ million, AGR%, CAGR%)
Table 24 Global Ionic Liquids Market Forecast By Country, 2020-2030 ($ million, AGR %)
Table 25 North America Ionic Liquids Market Forecast by Country, 2020-2030 ($ million, AGR %, CAGR% 2020, 2025, 2030)
Table 26 North America Revenue Forecast 2020-2030 ($ million, AGR%, CAGR%)
Table 27 North America Ionic Liquids Market Forecast by Application, 2020-2030, AGR%
Table 28 North America Ionic Liquids Market Forecast by Application, CAGR% 2020-2030
Table 29 North America Revenue Forecast COVID Analysis 2020-2030 ($ million, AGR%, CAGR%)
Table 30 North America Revenue Forecast Post COVID Analysis 2020-2030 ($ million, AGR%, CAGR%)
Table 31 US Revenue Forecast 2020-2030 ($ million, AGR%, CAGR%)
Table 32 US Ionic Liquids Market Forecast by Application, 2020-2030, AGR%
Table 33 US Ionic Liquids Market Forecast by Application, CAGR% 2020-2030
Table 34 Canada Revenue Forecast 2020-2030 ($ million, AGR%, CAGR%)
Table 35 Canada Ionic Liquids Market Forecast by Application, 2020-2030, AGR%
Table 36 Canada Ionic Liquids Market Forecast by Application, CAGR% 2020-2030
Table 37 Mexico Revenue Forecast 2020-2030 ($ million, AGR%, CAGR%)
Table 38 Mexico Ionic Liquids Market Forecast by Application, 2020-2030, AGR%
Table 39 Mexico Ionic Liquids Market Forecast by Application, CAGR% 2020-2030
Table 40 Europe Ionic Liquids Market Forecast by Country, 2020-2030 ($ million, AGR %, CAGR% 2020, 2025, 2030)
Table 41 Europe Revenue Forecast 2020-2030 ($ million, AGR%, CAGR%)
Table 42 Europe Ionic Liquids Market Forecast by Application, 2020-2030, AGR%
Table 43 Europe Ionic Liquids Market Forecast by Application, CAGR% 2020-2030
Table 44 Europe Revenue Forecast COVID Analysis 2020-2030 ($ million, AGR%, CAGR%)
Table 45 Europe Revenue Forecast Post COVID Analysis 2020-2030 ($ million, AGR%, CAGR%)
Table 46 Germany Revenue Forecast 2020-2030 ($ million, AGR%, CAGR%)
Table 47 Germany Ionic Liquids Market Forecast by Application, 2020-2030, AGR%
Table 48 Germany Ionic Liquids Market Forecast by Application, CAGR% 2020-2030
Table 49 France Revenue Forecast 2020-2030 ($ million, AGR%, CAGR%)
Table 50 France Ionic Liquids Market Forecast by Application, 2020-2030, AGR%
Table 51 France Ionic Liquids Market Forecast by Application, CAGR% 2020-2030
Table 52 UK Revenue Forecast 2020-2030 ($ million, AGR%, CAGR%)
Table 53 UK Ionic Liquids Market Forecast by Application, 2020-2030, AGR%
Table 54 UK Ionic Liquids Market Forecast by Application, CAGR% 2020-2030
Table 55 Spain Revenue Forecast 2020-2030 ($ million, AGR%, CAGR%)
Table 56 Spain Ionic Liquids Market Forecast by Application, 2020-2030, AGR%
Table 57 Spain Ionic Liquids Market Forecast by Application, CAGR% 2020-2030
Table 58 Italy Revenue Forecast 2020-2030 ($ million, AGR%, CAGR%)
Table 59 Italy Ionic Liquids Market Forecast by Application, 2020-2030, AGR%
Table 60 Italy Ionic Liquids Market Forecast by Application, CAGR% 2020-2030
Table 61 Netherlands Revenue Forecast 2020-2030 ($ million, AGR%, CAGR%)
Table 62 Netherlands Ionic Liquids Market Forecast by Application, 2020-2030, AGR%
Table 63 Netherlands Ionic Liquids Market Forecast by Application, CAGR% 2020-2030
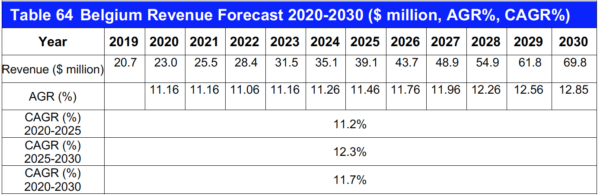
Table 64 Belgium Revenue Forecast 2020-2030 ($ million, AGR%, CAGR%)
Table 65 Belgium Ionic Liquids Market Forecast by Application, 2020-2030, AGR%
Table 66 Belgium Ionic Liquids Market Forecast by Application, CAGR% 2020-2030
Table 67 Rest of Europe Revenue Forecast 2020-2030 ($ million, AGR%, CAGR%)
Table 68 Rest of Europe Ionic Liquids Market Forecast by Application, 2020-2030, AGR%
Table 69 Rest of Europe Ionic Liquids Market Forecast by Application, CAGR% 2020-2030
Table 70 Asia Pacific Ionic Liquids Market Forecast by Country, 2020-2030 ($ million, AGR %, CAGR% 2020, 2025, 2030)
Table 71 Asia Pacific Revenue Forecast 2020-2030 ($ million, AGR%, CAGR%)
Table 72 Asia Pacific Ionic Liquids Market Forecast by Application, 2020-2030, AGR%
Table 73 Asia Pacific Ionic Liquids Market Forecast by Application, CAGR% 2020-2030
Table 74 Asia Pacific Revenue Forecast COVID Analysis 2020-2030 ($ million, AGR%, CAGR%)
Table 75 Asia Pacific Revenue Forecast Post COVID Analysis 2020-2030 ($ million, AGR%, CAGR%)
Table 76 China Revenue Forecast 2020-2030 ($ million, AGR%, CAGR%)
Table 77 China Ionic Liquids Market Forecast by Application, 2020-2030, AGR%
Table 78 China Ionic Liquids Market Forecast by Application, CAGR% 2020-2030
Table 79 India Revenue Forecast 2020-2030 ($ million, AGR%, CAGR%)
Table 80 India Ionic Liquids Market Forecast by Application, 2020-2030, AGR%
Table 81 India Ionic Liquids Market Forecast by Application, CAGR% 2020-2030
Table 82 Japan Revenue Forecast 2020-2030 ($ million, AGR%, CAGR%)
Table 83 Japan Ionic Liquids Market Forecast by Application, 2020-2030, AGR%
Table 84 Japan Ionic Liquids Market Forecast by Application, CAGR% 2020-2030
Table 85 South Korea Revenue Forecast 2020-2030 ($ million, AGR%, CAGR%)
Table 86 South Korea Ionic Liquids Market Forecast by Application, 2020-2030, AGR%
Table 87 South Korea Ionic Liquids Market Forecast by Application, CAGR% 2020-2030
Table 88 Vietnam Revenue Forecast 2020-2030 ($ million, AGR%, CAGR%)
Table 89 Vietnam Ionic Liquids Market Forecast by Application, 2020-2030, AGR%
Table 90 Vietnam Ionic Liquids Market Forecast by Application, CAGR% 2020-2030
Table 91 Rest of APAC Revenue Forecast 2020-2030 ($ million, AGR%, CAGR%)
Table 92 Rest of APAC Ionic Liquids Market Forecast by Application, 2020-2030, AGR%
Table 93 Rest of APAC Ionic Liquids Market Forecast by Application, CAGR% 2020-2030
Table 94 Middle East & Africa Ionic Liquids Market Forecast by Country, 2020-2030 ($ million, AGR %, CAGR% 2020, 2025, 2030)
Table 95 Middle East & Africa Revenue Forecast 2020-2030 ($ million, AGR%, CAGR%)
Table 96 Middle East & Africa Ionic Liquids Market Forecast by Application, 2020-2030, AGR%
Table 97 Middle East & Africa Ionic Liquids Market Forecast by Application, CAGR% 2020-2030
Table 98 Middle East & Africa Revenue Forecast COVID Analysis 2020-2030 ($ million, AGR%, CAGR%)
Table 99 Middle East & Africa Revenue Forecast Post COVID Analysis 2020-2030 ($ million, AGR%, CAGR%)
Table 100 Saudi Arabia Revenue Forecast 2020-2030 ($ million, AGR%, CAGR%)
Table 101 Saudi Arabia Ionic Liquids Market Forecast by Application, 2020-2030, AGR%
Table 102 Saudi Arabia Ionic Liquids Market Forecast by Application, CAGR% 2020-2030
Table 103 Qatar Revenue Forecast 2020-2030 ($ million, AGR%, CAGR%)
Table 104 Qatar Ionic Liquids Market Forecast by Application, 2020-2030, AGR%
Table 105 Qatar Ionic Liquids Market Forecast by Application, CAGR% 2020-2030
Table 106 Oman Revenue Forecast 2020-2030 ($ million, AGR%, CAGR%)
Table 107 Oman Ionic Liquids Market Forecast by Application, 2020-2030, AGR%
Table 108 Oman Ionic Liquids Market Forecast by Application, CAGR% 2020-2030
Table 109 UAE Revenue Forecast 2020-2030 ($ million, AGR%, CAGR%)
Table 110 UAE Ionic Liquids Market Forecast by Application, 2020-2030, AGR%
Table 111 UAE Ionic Liquids Market Forecast by Application, CAGR% 2020-2030
Table 112 Rest of MEA Revenue Forecast 2020-2030 ($ million, AGR%, CAGR%)
Table 113 Rest of MEA Ionic Liquids Market Forecast by Application, 2020-2030, AGR%
Table 114 Rest of MEA Ionic Liquids Market Forecast by Application, CAGR% 2020-2030
Table 115 South America Ionic Liquids Market Forecast by Country, 2020-2030 ($ million, AGR %, CAGR% 2020, 2025, 2030)
Table 116 South America Revenue Forecast 2020-2030 ($ million, AGR%, CAGR%)
Table 117 South America Ionic Liquids Market Forecast by Application, 2020-2030, AGR%
Table 118 South America Ionic Liquids Market Forecast by Application, CAGR% 2020-2030
Table 119 South America Revenue Forecast COVID Analysis 2020-2030 ($ million, AGR%, CAGR%)
Table 120 South America Revenue Forecast Post COVID Analysis 2020-2030 ($ million, AGR%, CAGR%)
Table 121 Brazil Revenue Forecast 2020-2030 ($ million, AGR%, CAGR%)
Table 122 Brazil Ionic Liquids Market Forecast by Application, 2020-2030, AGR%
Table 123 Brazil Ionic Liquids Market Forecast by Application, CAGR% 2020-2030
Table 124 Rest of SA Revenue Forecast 2020-2030 ($ million, AGR%, CAGR%)
Table 125 Rest of SA Ionic Liquids Market Forecast by Application, 2020-2030, AGR%
Table 126 Rest of SA Ionic Liquids Market Forecast by Application, CAGR% 2020-2030
Table 127 BASF Portfolio
Table 128 BASF Product Portfolio
Table 129 BASF Financial Performance (2016-2018, $ million)
Table 130 Evonik Industries AG Portfolio
Table 131 Evonik Industries AG Product Portfolio
Table 132 Evonik Industries AG Financial Performance (2016-2018, $ million)
Table 133 Merck KGaA Portfolio
Table 134 Merck KGaA Product Portfolio
Table 135 Merck KGaA Financial Performance (2016-2018, $ million)
Table 136 Iolitec Ionic Liquids Technologies GmbH Portfolio
Table 137 Iolitec Ionic Liquids Technologies GmbH Product Portfolio
Table 138 The Chemours Company Portfolio
Table 139 The Chemours Company Product Portfolio
Table 140 The Chemours Company Financial Performance (2016-2018, $ million)
Table 141 Proionic GmbH Portfolio
Table 142 Proionic GmbH Product Portfolio
Table 143 Proionic GmbH Product Portfolio
Table 144 Solvionic SA Portfolio
Table 145 Solvionic SA Product Portfolio
Table 146 CoorsTek Inc. Portfolio
Table 147 CoorsTek Inc. Product Portfolio
Table 148 Jiangxi Jinkai Chemical Co., Ltd Portfolio
Table 149 Jiangxi Jinkai Chemical Co., Ltd Product Portfolio
Table 150 Reinste Nanoventure Portfolio
Table 151 Reinste Nanoventure Product Portfolio
Table 152 Tatva Chintan Pharma Chem Pvt. Ltd. Portfolio
Table 153 Tatva Chintan Pharma Chem Pvt. Ltd. Product Portfolio
Table 154 Tatva Chintan Pharma Chem Pvt. Ltd. Financial Performance (2018, $ million)
Table 155 Scionix Ltd. Portfolio
Table 156 Scionix Ltd. Product Portfolio
Table 157 Strem Chemicals, Inc. Portfolio
Table 158 Strem Chemicals, Inc. Product Portfolio
Table 159 Tokyo Chemical Industry Co. Portfolio
Table 160 Tokyo Chemical Industry Co. Product Portfolio
Table 161 Solvay Portfolio
Table 162 Solvay Product Portfolio
Table 163 Solvay Financial Performance (2016-2018, $ million)
Table 164 KOEI CHEMICAL COMPANY, LIMITED Portfolio
Table 165 KOEI CHEMICAL COMPANY, LIMITED Product Portfolio
Table 166 KOEI CHEMICAL COMPANY, LIMITED Financial Performance (2016-2018, $ million)
Table 167 Solaronix SA Portfolio
Table 168 Solaronix SA Product Portfolio
Table 169 Santa Cruz Biotechnology, Inc. Portfolio
Table 170 Santa Cruz Biotechnology, Inc. Product Portfolio
Table 171 Wuhu Huaren Science and Technology Co.,Ltd. Portfolio
Table 172 Wuhu Huaren Science and Technology Co.,Ltd. Product Portfolio
Table 173 Company Market Share & Ranking