Industries > Energy > Geothermal Power Market Forecast 2017-2027

Geothermal Power Market Forecast 2017-2027
Capex, Opex & Capacity Forecasts for Dry Steam, Flash Steam, Binary Cycle and Flash-Binary Technologies Plus Regional Forecast
This latest report by business intelligence provider Visiongain assesses that Geothermal power market trends will reach $7.71bn in 2017. This report will be of value to anyone who wants to better understand the sector and its dynamics. It will be useful for stakeholders already involved in the geothermal power sector, or for those wishing to understand and appreciate the trajectory and state-of-play of a sector of growing importance to the global energy industry. It is therefore critical that you have your timescales correct and your forecasting plans ready. This report will ensure that you do. Visiongain’s report will ensure that you keep informed and ahead of your competitors. Gain that competitive advantage.
The Geothermal Power Forecast 2017-2027 responds to your need for definitive market data:
Read on to discover how you can exploit the future business opportunities emerging in this sector. Visiongain’s new study tells you and tells you NOW.
In this brand new report, you find 200 in-Depth tables, charts and graphs all unavailable elsewhere.
The 282 page report provides clear detailed insight into the global geothermal power market. Discover the key drivers and challenges affecting the market.
By ordering and reading our brand new report today you stay better informed and ready to act.
Report Scope
The report delivers considerable added value by revealing:
• 200 tables, charts and graphs analysing and revealing the growth prospects and outlook for the geothermal power market.
• Geothermal power market forecasts and analysis from 2017-2027.
• The report also offers opex, capex and capacity forecasts from 2017 to 2027 for 5 geothermal power plant types:
• Dry steam
• Flash steam
• Flash-binary
• Binary cycle
• Other technologies
• The report provides opex, capex and capacity forecasts from 2017 to 2027, plus analysis, for 10 national markets and the rest of the world, providing unique insight into geothermal power industry developments:
• The USA
• Philippines
• Indonesia
• Italy
• Mexico
• New Zealand
• Iceland
• Kenya
• Japan
• Turkey
• Rest of the World
• Company profiles for the leading 12 geothermal power companies:
• Mitsubishi Heavy Industries (MHI)
• Toshiba
• Ansaldo
• Fuji
• General Electric (GE)
• Tas Energy
• Ormat
• Terra-Gen
• Turboden
• Exergy
• US Geothermal
• Calpine Corporation
• Conclusions and recommendations which will aid decision-making
How will you benefit from this report?
• Keep your knowledge base up to speed. Don’t get left behind
• Reinforce your strategic decision-making with definitive and reliable market data
• Learn how to exploit new technological trends
• Realise your company’s full potential within the market
• Understand the competitive landscape and identify potential new business opportunities & partnerships
Who should read this report?
• Anyone within the geothermal power value chain
• Multi-client survey companies
• Energy companies
• Fund managers for energy practices at banks
• Energy practice legal professionals
• Seismic vessel constructors
• Geothermal equipment manufacturers
• Engineering companies
• Geologists
• Business development managers
• Marketing managers
• Technologists
• Suppliers
• Investors
• Banks
• Government agencies
• Contractors
Visiongain’s study is intended for anyone requiring commercial analyses for the Geothermal Power market and leading companies. You find data, trends and predictions.
Buy our report today the Geothermal Power Market Analysis: Capex, Opex & Capacity Forecasts for Dry Steam, Flash Steam, Binary Cycle and Flash-Binary Technologies Plus Regional Forecast. Avoid missing out by staying informed – get our report now.
Visiongain is a trading partner with the US Federal Government
CCR Ref number: KD4R6
1. Report Overview
1.1 Global Geothermal Power Market Overview
1.2 Market Definition
1.3 Why You Should Read This Report
1.4 How This Report Delivers
1.5 Key Questions Answered by This Analytical Report Include:
1.6 Who is This Report For?
1.7 Methodology
1.7.1 Primary Research
1.7.2 Secondary Research
1.7.3 Market Evaluation & Forecasting Methodology
1.8 Frequently Asked Questions (FAQ)
1.9 Associated Visiongain Reports
1.10 About Visiongain
2. Introduction to the Global Geothermal Power Market
2.1 Global Geothermal Power Market Structure
2.2 History of Geothermal Energy
2.3 Geothermal Power Plant Technologies
2.3.1 Mainstream Geothermal Power Plant Technologies
2.3.1.1 Dry Steam Power Plants
2.3.1.2 Flash Steam Power Plants
2.3.1.3 Binary Cycle Power Plants
2.3.1.4 Flash-Binary Power Plants
2.3.2 Other Technologies
2.3.2.1 Enhanced Geothermal Systems (EGS)
2.3.2.2 Co-Production
2.3.2.3 Hybrid Generation
2.4 Geothermal Power Plant Development
2.5 Historical and Current Geothermal Power Usage
3. Global Geothermal Power Market 2017-2027
3.1 Global Geothermal Power Market Forecast 2017-2027
3.1.1 Global Geothermal Power CAPEX & OPEX Forecast 2017-2027
3.1.2 Global Geothermal Power Capacity Forecast 2017-2027
3.2 Geothermal Power Market Dynamics
3.3 Environmental Factors and the Geothermal Market
3.3.1 Air Pollution
3.3.2 On-Site Chemicals
3.3.3 Land Impacts
3.3.4 Water Impacts
3.3.5 Noise Impacts
3.3.6 Environmental Assessment and Permitting
3.4 Geographical Limitations on Geothermal Capacity
3.5 List of Existing Geothermal Power Plants
4. Technology Geothermal Power Market Forecasts 2017-2027
4.1 Forecast of the Technology Geothermal Power Market 2017-2027
4.2 Analysis of Historical Geothermal Production by Technology
4.3 Binary Cycle Technology
4.3.1 Binary Cycle Geothermal Power CAPEX & OPEX Forecast 2017-2027
4.4 Flash-Binary Technology
4.4.1 Flash-Binary Geothermal Power CAPEX & OPEX Forecast 2017-2027
4.5 Flash Steam Technology
4.5.1 Flash Steam Geothermal Power CAPEX & OPEX Forecast 2017-2027
4.6 Dry Steam Technology
4.6.1 Dry Steam Geothermal Power CAPEX & OPEX Forecast 2017-2027
4.7 Other Technologies
4.7.1 Other Technologies Geothermal Power OPEX & CAPEX Forecast 2017-2027
5. National Geothermal Power Market Forecasts 2017-2027
5.1 The US
5.1.1 Analysis of Historical US Geothermal Power Production
5.1.2 US Geothermal Power CAPEX & OPEX Forecast 2017-2027
5.1.3 US Geothermal Power Capacity Forecast 2017-2027
5.2 The Philippines
5.2.1 Analysis of Historical Philippines Geothermal Power Production
5.2.2 Philippines Geothermal Power CAPEX & OPEX Forecast 2017-2027
5.2.3 Philippines Geothermal Power Capacity Forecast 2017-2027
5.2.4 List of Announced Philippines Geothermal Developments
5.3 Indonesia
5.3.1 Analysis of Historical Indonesian Geothermal Power Production
5.3.2 Indonesian Geothermal Power CAPEX & OPEX Forecast 2017-2017
5.3.4 List of Announced Indonesian Geothermal Developments
5.4 Italy
5.4.1 Analysis of Historical Italian Geothermal Power Production
5.4.2 Italian Geothermal Power CAPEX & OPEX Forecast 2017-2027
5.4.3 Italian Geothermal Power Capacity Forecast 2017-2027
5.5 Mexico
5.5.1 Analysis of Historical Mexican Geothermal Power Production
5.5.2 Mexican Geothermal Power CAPEX & OPEX Forecast 2017-2027
5.5.3 Mexican Geothermal Power Capacity Forecast 2017-2027
5.6 New Zealand
5.6.1 Analysis of Historical New Zealand Geothermal Production
5.6.2 New Zealand Geothermal Power CAPEX & OPEX Forecast 2017-2027
5.6.3 New Zealand Geothermal Power Capacity Forecast 2017-2027
5.6.4 List of Announced New Zealand Geothermal Power Developments
5.7 Iceland
5.7.1 Analysis of Historical Icelandic Geothermal Production
5.7.2 Icelandic Geothermal Power CAPEX & OPEX Forecast 2017-2027
5.7.3 Iceland Geothermal Power Capacity Forecast 2017-2027
5.7.4 List of Announced Iceland Geothermal Power Developments
5.8 Kenya
5.8.1 Analysis of Historical Kenyan Geothermal Power Production
5.8.2 Kenyan Geothermal Power CAPEX & OPEX Forecast 2017-2027
5.8.3 Kenyan Geothermal Power Capacity Forecast 2017-2027
5.9 Japan
5.9.1 Analysis of Historical Japanese Geothermal Power Production
5.9.2 Japanese Geothermal Power CAPEX & OPEX Forecast 2017-2027
5.10 Turkey
5.10.1 Analysis of Historical Turkish Geothermal Production
5.10.2 Turkish Geothermal Power CAPEX & OPEX Forecast 2017-2027
5.10.3 Turkish Geothermal Power Capacity Forecast 2017-2027
5.11 Rest of the World
5.11.1 Analysis of Historical RoW Geothermal Power Production
5.11.2 RoW Geothermal Power CAPEX & OPEX Forecast 2017-2027
5.11.3 RoW Geothermal Power Capacity Forecast 2017-2027
6. PEST Analysis
7. Expert Opinion
7.1 Kalahari GeoEnergy Ltd.
7.1.1 Introduction
7.1.2 The Overall Future of Geothermal Energy
7.1.3 Main Drivers and Challenges of the Geothermal Market
7.1.4 Geothermal Energy in Africa
7.1.5 Geothermal Power Plant Technologies
7.2 AltaRock Energy
7.2.1 Introduction
7.2.2. Growth in the US
7.2.3 Private Investments
7.2.4 Future Outlook for Enhanced Geothermal Systems (EGS)
7.2.5 Land Permissions in the US
7.2.6 Future Outlook for the US Geothermal Power Sector
8. Leading Global Geothermal Power Market
8.1 Mitsubishi Heavy Industries Limited (MHI)
8.1.1 Mitsubishi Heavy Industries Limited Total Company Sales 2011-2015
8.1.2 Mitsubishi Heavy Industries Limited Sales in the Geothermal Power Market 2013-2015
8.2 Toshiba Corporation
8.2.1 Toshiba Corporation Total Company Sales 2011-2015
8.2.2 Toshiba Corporation Sales in the Geothermal Power Market 2013-2015
8.3 Ormat Technologies
8.3.1 Ormat Technologies Total Company Sales 2011-2015
8.4 Fuji Electric Co., Ltd.
8.4.1 Fuji Electric Co., Ltd. Total Company Sales 2011-2015
8.4.2 Fuji Electric Co., Ltd. Sales in the Geothermal Power Market 2012-2015
8.5 Ansaldo Energia
8.5.1 Ansaldo Energia Total Company Sales 2011-2015
8.6 General Electric
8.6.1 General Electric Total Company Sales 2012-2016
8.6.2 General Electric Sales in the Geothermal Power Market 2012-2016
8.7 Tas Energy
8.8 Terra-Gen, LLC
8.9 Turboden S.p.A.
8.10 Exergy S.p.A.
8.11 US Geothermal Inc.
8.12 Calpine Corporation
8.12.1 Calpine Corporation Total Company Sales 2011-2016
9. Conclusions and Recommendations
9.1 Market Outlook
9.2 Key Findings
9.3 Recommendations
10. Glossary
Associated Visiongain Reports
Visiongain Report Sales Order Form
Appendix A
About Visiongain
Appendix B
Visiongain report evaluation form
List of Tables
Table 1.1 Example Global Geothermal Power Market Forecast 2017-2027, CAPEX ($mn), OPEX ($mn), CAPACITY (MW), AGR (%), CAGR (%)
Table 2.1 Layers of the Earth, Corresponding Temperature (°C), Depth (km) and Share in Volume of Earth (%)
Table 2.2 History of Geothermal Energy
Table 2.3 Types and Temperatures (°C) of Geothermal Sources
Table 2.4 Types of Geothermal Power Plants, Basic Methodology, Example, Description
Table 2.5 Phases of Geothermal Projects, Portion of Total Cost (%), Years
Table 3.1 Global Geothermal Power Market Total Spending Forecast 2017-2027, $mn, AGR (%), CAGR 2017-2022, CAGR 2022-2027, CAGR 2017-2027
Table 3.2 Global Geothermal Power Market Capacity Additions Forecast 2017-2027, MW, AGR (%), CAGR 2017-2022, CAGR 2022-2027, CAGR 2017-2027
Table 3.3 Contribution of Top 10 Geothermal Power Producers and Rest of the World to Total Spending ($mn), 2017-2027
Table 3.4 List of Existing Geothermal Power Plants 1911-2015
Table 4.1 Contribution of Geothermal Power Technologies to Total Spending ($mn), 2017-2027
Table 4.2 Binary Cycle Geothermal Power Market Total Spending Forecast 2017-2027, $mn, AGR (%), CAGR 2017-2022, CAGR 2022-2027, CAGR 2017-2027
Table 4.3 Flash-binary Geothermal Power Market Total Spending Forecast 2017-2027, $mn, AGR (%), CAGR 2017-2022, CAGR 2022-2027, CAGR 2017-2027
Table 4.4 Flash Steam Geothermal Power Market Total Spending Forecast 2017-2027, $mn, AGR (%), CAGR 2017-2022, CAGR 2022-2027, CAGR 2017-2027
Table 4.5 Dry Steam Geothermal Power Market Total Spending Forecast 2017-2027, $mn, AGR (%), CAGR 2017-2022, CAGR 2022-2027, CAGR 2017-2027
Table 4.6 Other Geothermal Power Market Total Spending Forecast 2017-2027, $mn, AGR (%), CAGR 2017-2022, CAGR 2022-2027, CAGR 2017-2027
Table 5.1 US Geothermal Power Market Total Spending Forecast 2017-2027, $mn, AGR (%), CAGR 2017-2022, CAGR 2022-2027, CAGR 2017-2027
Table 5.2 US Geothermal Power Market Capacity Forecast 2017-2027, MW, AGR (%), CAGR 2017-2022, CAGR 2022-2027, CAGR 2017-2027
Table 5.3 List of Announced US Geothermal Developments
Table 5.4 Philippines Geothermal Power Market Total Spending Forecast 2017-2027, $mn, AGR (%), CAGR 2017-2022, CAGR 2022-2027, CAGR 2017-2027
Table 5.5 Philippines Geothermal Power Market Capacity Forecast 2017-2027, MW, AGR (%), CAGR 2017-2022, CAGR 2022-2027, CAGR 2017-2027
Table 5.6 List of Announced Philippines Geothermal Developments
Table 5.7 Indonesian Geothermal Power Market Total Spending Forecast 2017-2027, $mn, AGR (%), CAGR 2017-2022, CAGR 2022-2027, CAGR 2017-2027
Table 5.8 Indonesian Geothermal Power Market Capacity Forecast 2017-2027, MW, AGR (%), CAGR 2017-2022, CAGR 2022-2027, CAGR 2017-2027
Table 5.9 List of Announced Indonesian Geothermal Developments
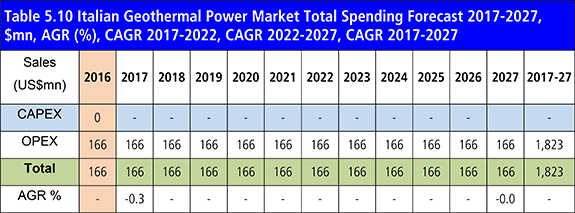
Table 5.10 Italian Geothermal Power Market Total Spending Forecast 2017-2027, $mn, AGR (%), CAGR 2017-2022, CAGR 2022-2027, CAGR 2017-2027
Table 5.11 Italian Geothermal Power Market Capacity Forecast 2017-2027, MW, AGR (%), CAGR 2017-2022, CAGR 2022-2027, CAGR 2017-2027
Table 5.12 List of Announced Italian Geothermal Developments
Table 5.13 Mexican Geothermal Power Market Total Spending Forecast 2017-2027, $mn, AGR (%), CAGR 2017-2022, CAGR 2022-2027, CAGR 2017-2027
Table 5.14 Mexican Geothermal Power Market Capacity Forecast 2017-2027, MW, AGR (%), CAGR 2017-2022, CAGR 2022-2027, CAGR 2017-2027
Table 5.15 List of Announced Mexican Geothermal Developments
Table 5.16 New Zealand Geothermal Power Market Total Spending Forecast 2017-2027, $mn, AGR (%), CAGR 2017-2022, CAGR 2022-2027, CAGR 2017-2027
Table 5.17 New Zealand Geothermal Power Market Capacity Forecast 2017-2027, MW, AGR (%), CAGR 2017-2022, CAGR 2022-2027, CAGR 2017-2027
Table 5.18 List of Announced New Zealand Geothermal Developments
Table 5.19 Iceland Geothermal Power Market Total Spending Forecast 2017-2027, $mn, AGR (%), CAGR 2017-2022, CAGR 2022-2027, CAGR 2017-2027
Table 5.20 Iceland Geothermal Power Market Capacity Forecast 2017-2027, MW, AGR (%), CAGR 2017-2022, CAGR 2022-2027, CAGR 2017-2027
Table 5.21 List of Announced Iceland Geothermal Developments
Table 5.22 Kenyan Geothermal Power Market Total Spending Forecast 2017-2027, $mn, AGR (%), CAGR 2017-2022, CAGR 2022-2027, CAGR 2017-2027
Table 5.23 Kenyan Geothermal Power Market Capacity Forecast 2017-2027, MW, AGR (%), CAGR 2017-2022, CAGR 2022-2027, CAGR 2017-2027
Table 5.24 List of Announced Kenya Geothermal Developments
Table 5.25 Japanese Geothermal Power Market Total Spending Forecast 2017-2027, $mn, AGR (%), CAGR 2017-2022, CAGR 2022-2027, CAGR 2017-2027
Table 5.26 Japanese Geothermal Power Market Capacity Forecast 2017-2027, MW, AGR (%), CAGR 2017-2022, CAGR 2022-2027, CAGR 2017-2027
Table 5.27 List of Announced Japan Geothermal Developments
Table 5.28 Turkish Geothermal Power Market Total Spending Forecast 2017-2027, $mn, AGR (%), CAGR 2017-2022, CAGR 2022-2027, CAGR 2017-2027
Table 5.29 Turkish Geothermal Power Market Capacity Forecast 2017-2027, MW, AGR (%), CAGR 2017-2022, CAGR 2022-2027, CAGR 2017-2027
Table 5.30 List of Announced Turkish Geothermal Developments
Table 5.31 Top 10 Geothermal Power Producers and Rest of the World
Table 5.32 Countries – Projects at Different Stages of Development
Table 5.33 RoW Geothermal Power Market Total Spending Forecast 2017-2027, $mn, AGR (%), CAGR 2017-2022, CAGR 2022-2027, CAGR 2017-2027
Table 5.34 RoW Geothermal Power Market Capacity Forecast 2017-2027, MW, AGR (%), CAGR 2017-2022, CAGR 2022-2027, CAGR 2017-2027
Table 5.35 List of Announced RoW Geothermal Developments
Table 6.1 PEST Analysis of the Global Geothermal Power Market
Table 8.1 Mitsubishi Heavy Industries Limited Profile (CEO, Total Company Sales US$m, Sales From Company Division That Includes Geothermal Power (US$m), Share of Total Company Sales From Company Division That Includes Geothermal Power (%), Net Capital Expenditure US$m, Strongest Business Region, Business Segment in the Market, HQ, Founded, No. of Employees, IR Contact, Ticker, Website)
Table 8.2 Mitsubishi Heavy Industries Limited Total Company Sales 2010-2015 (US$m, AGR %)
Table 8.3 Mitsubishi Heavy Industries Limited Sales in the Geothermal Power Market 2012-2015 (US$m, AGR %)
Table 8.4 Toshiba Corporation Profile 2016 (CEO, Total Company Sales US$m, Sales From Company Division That Includes Geothermal Power (US$m), Share of Total Company Sales From Company Division That Includes Geothermal Power (%), Net Income / Loss US$m, Net Capital Expenditure US$m, Strongest Business Region, Business Segment in the Market, HQ, Founded, No. of Employees, IR Contact, Ticker, Website)
Table 8.5 Toshiba Corporation Total Company Sales 2010-2015 (US$m, AGR %)
Table 8.6 Toshiba Corporation Sales in the Geothermal Power Market 2012-2015 (US$m, AGR %)
Table 8.7 Ormat Technologies 2015 (CEO, Total Company Sales US$m, Net Income / Loss US$m, Net Capital ExpenditureUS$m, Strongest Business Region, Business Segment in the Market, HQ, Founded, No. of Employees, IR Contact, Ticker, Website)
Table 8.8 Ormat Technlogies Total Company Sales 2010-2015 (US$m, AGR %)
Table 8.9 Fuji Electric Co., Ltd. 2016 (CEO, Total Company Sales US$m, Sales From Company Division That Includes Geothermal Power (US$m), Share of Total Company Sales From Company Division That Includes Geothermal Power (%), Net Income / Loss US$m, Net Capital Expenditure US$m, Strongest Business Region, Business Segment in the Market, HQ, Founded, No. of Employees, IR Contact, Ticker, Website)
Table 8.10 Fuji Electric Co., Ltd. Total Company Sales 2010-2015 (US$m, AGR %)
Table 8.11 Fuji Electric Co., Ltd. Sales in the Geothermal Power Market 2011-2015 (US$m, AGR %)
Table 8.12 Ansaldo Energia 2015 (CEO, Total Company Sales US$m, Strongest Business Region, Business Segment in the Market, HQ, Founded, No. of Employees, IR Contact, Website)
Table 8.13 Ansaldo Energia Total Company Sales 2010-2015 (US$m, AGR %)
Table 8.14 General Electric 2016 (CEO, Total Company Sales US$m, Sales From Company Division That Includes Geothermal Power (US$m), Share of Total Company Sales From Company Division That Includes Geothermal Power (%), Net Income / Loss US$m, Net Capital Expenditure US$m, Strongest Business Region, Business Segment in the Market, Submarket Involvement, HQ, Founded, No. of Employees, IR Contact, Ticker, Website)
Table 8.15 General Electric Total Company Sales 2011-2016 (US$m, AGR %)
Table 8.16 General Electric Ltd Sales in the Geothermal Power Market 2011-2016 (US$m, AGR %)
Table 8.17 Tas Energy (HQ, Founded, No. of Employees, IR Contact, Website)
Table 8.18 Terra-Gen, LLC (CEO, Strongest Business Region, Business Segment in the Market, HQ, Founded, No. of Employees, IR Contact, Website)
Table 8.19 Turboden S.p.A. (CEO, HQ, Founded, No. of Employees, IR Contact, Website)
Table 8.20 Exergy S.p.A. (CEO, Total Company Sales US$m, Business Segment in the Market, HQ, Founded, No. of Employees, IR Contact, Website)
Table 8.21 US Geothermal Inc. (CEO, Total Company Sales US$m, Net Income / Loss US$m, Net Capital Expenditure US$m, Strongest Business Region, HQ, Founded, No. of Employees, IR Contact, Ticker, Website)
Table 8.22 US Geothermal Inc. Total Company Sales 2010-2016 (US$m, AGR %)
Table 8.23 Calpine Corporation (CEO, Total Company Sales US$m, Net Income / Loss US$m, Net Capital Expenditure US$m, Strongest Business Region, HQ, Founded, No. of Employees, IR Contact, Ticker, Website)
Table 8.24 Calpine Corporation Total Company Sales 2010-2016 (US$m, AGR %)
Table 9.1 Top 10 Producers and RoW Geothermal Power Markets Forecast, 2017-2027, Capex ($mn), Opex ($mn), Capacity (MW)
Table 9.2 Technology Geothermal Power Markets Forecast, 2017-2027, Capex ($mn), Opex ($mn)
List of Figures
Figure 1.1 Estimated Total Levelised Cost of Electricity by Source ($/MWh)
Figure 1.2 Cost Elements of Capex ($mn/MW) and Opex ($/kWh)
Figure 2.1 Heat Flow Map of the World (MW/m2)
Figure 2.2 Global Geothermal Power Market Segmentation Overview
Figure 2.3 Global Cumulative Installed Geothermal Capacity (MW), AGR, 1958-2015
Figure 2.4 Global Existing Geothermal Capacity & New Capacity (MW), 1958-2015
Figure 2.5 Number of New Geothermal Power Plants, 1958-2015
Figure 2.6 New Geothermal Capacity (MW), 1958-2015
Figure 2.7 Share of Global Geothermal Installed Capacity, %, 2016
Figure 2.8 Number of Existing Geothermal Power Stations by Technology, 2015
Figure 2.9 Installed Capacity by Technology (MW), 2015
Figure 2.10 Share of Technologies in Total Installed Capacity (%), 2016
Figure 3.1 Global Energy Production by Source (Mtoe), 2010-2035
Figure 3.2 Global Energy Production by Source (%), 2010-2035
Figure 3.3 Share of Geothermal Power in Total Renewable Electricity Generation (%), 2015
Figure 3.4 Global Geothermal Power Market Total Spending Forecast 2017-2027, $mn, AGR (%)
Figure 3.5 Global Geothermal Power Market Capacity Additions Forecast 2017-2027, MW, AGR (%)
Figure 3.6 Global Geothermal Power Market Forecast, 2016-2026, Existing Capacity (MW), New Capacity (MW)
Figure 3.7 Installed Capacity of Top 10 Geothermal Power Producers in 2017 and 2027 (MW)
Figure 3.8 Percentage Shares of Top 10 Geothermal Power Producers and Rest of the World to Total Installed Capacity (%), 2016-2026
Figure 3.9 Contribution of The Top 10 Geothermal Power Producers and Rest of the World to Total Spending ($mn), 2017-2027
Figure 3.10 World Population Density Map
Figure 4.1 Share of Geothermal Technologies in Total Global Installed Capacity, 1958-2026, MW
Figure 4.2 Share of Geothermal Technologies in Total Spending, 2017-2027, $mn
Figure 4.3 Contribution of Geothermal Technologies to Total Global Installed Capacity, 1958-2015, MW
Figure 4.4 Binary Cycle Geothermal Power Plants Capacity Additions, 1981-2015, MW
Figure 4.5 Dry Steam Geothermal Power Plants Capacity Additions, 1958-2015, MW
Figure 4.6 Flash Steam Geothermal Power Plants Capacity Additions, 1958-2015, MW
Figure 4.7 Flash-Binary Geothermal Power Plants Capacity Additions, 1975-2015, MW
Figure 4.8 Other Geothermal Power Plants Capacity Additions, 1989-2015, MW
Figure 4.9 Binary Cycle Geothermal Power Market Total Spending Forecast, 2017-2027, $mn, AGR (%)
Figure 4.10 Flash-Binary Geothermal Power Market Total Spending Forecast, 2017-2027, $mn, AGR (%)
Figure 4.11 Flash Steam Geothermal Power Market Total Spending Forecast, 2017-2027, $mn, AGR (%)
Figure 4.12 Dry Steam Geothermal Power Market Total Spending Forecast, 2017-2027, $mn, AGR (%)
Figure 4.13 Other Technologies Geothermal Power Market Total Spending Forecast, 2017-2027, $mn, AGR (%)
Figure 5.1 US Heat Flow Map
Figure 5.2 Historical Total Capacity and AGR in the US, 1971-2015, MW, %
Figure 5.3 Existing Capacity and New Capacity in the US, 1971-2015, MW
Figure 5.4 US Market Share and Other Markets in Total Installed Capacity, 2000-2015, %
Figure 5.5 US Geothermal Power Market Total Spending Forecast, 2017-2027, $mn, AGR (%)
Figure 5.6 US Geothermal Power Market New Capacity Forecast, 2017-2027, MW, AGR (%)
Figure 5.7 US Geothermal Existing Capacity and New Capacity Forecast, 2016-2026, MW
Figure 5.8 Historical Total Capacity and AGR in the Philippines, 1979-2015, MW, %
Figure 5.9 Existing Capacity and New Capacity in the Philippines, 1979-2015, MW
Figure 5.10 Philippines Market Share and Other Markets in Total Installed Capacity, 2000-2015, %
Figure 5.11 Philippines Geothermal Power Market Total Spending Forecast, 2017-2027, $mn, AGR (%)
Figure 5.12 Philippines Geothermal Power Market Capacity Forecast, 2017-2027, MW, AGR (%)
Figure 5.13 Philippines Geothermal Existing Capacity and New Capacity Forecast, 2016-2026, MW
Figure 5.14 Geothermal Resources Map of Indonesia
Figure 5.15 Historical Total Capacity and AGR in Indonesia, 1983-2015, MW, %
Figure 5.16 Existing Capacity and New Capacity in Indonesia, 1983-2015, MW
Figure 5.17 Indonesian Market Share and Other Markets in Total Installed Capacity, 2000-2015, %
Figure 5.18 Indonesian Geothermal Power Market Total Spending Forecast, 2017-2027, $mn, AGR (%)
Figure 5.19 Indonesian Geothermal Power Market Capacity Forecast, 2017-2027, MW, AGR (%)
Figure 5.20 Indonesian Geothermal Existing Capacity and New Capacity Forecast, 2016-2026, MW
Figure 5.21 Geothermal Resources Map of Italy
Figure 5.22 Historical Total Capacity and AGR in Italy, 1966-2015, MW, %
Figure 5.23 Existing Capacity and New Capacity in Italy, 1966-2015, MW
Figure 5.24 Italian Market Share and Other Markets in Total Installed Capacity, 2000-2015, %
Figure 5.25 Italian Geothermal Power Market Total Spending Forecast, 2017-2027, $mn
Figure 5.26 Italian Geothermal Power Market Capacity Forecast, 2017-2027, MW
Figure 5.27 Italian Geothermal Existing Capacity and New Capacity Forecast, 2016-2026, MW
Figure 5.28 Geothermal Resources Map of Mexico
Figure 5.29 Historical Total Capacity and AGR in Mexico, 1973-2015, MW, %
Figure 5.30 Existing Capacity and New Capacity in Mexico, 1973-2015, MW
Figure 5.31 Mexican Market Share and Other Markets in Total Installed Capacity, 2000-2015, %
Figure 5.32 Mexican Geothermal Power Market Total Spending Forecast, 2017-2027, $mn, AGR (%)
Figure 5.33 Mexican Geothermal Power Market Capacity Forecast, 2017-2027, MW, AGR (%)
Figure 5.34 Mexican Geothermal Existing Capacity and New Capacity Forecast, 2016-2026, MW
Figure 5.35 Geothermal Resources Map of New Zealand
Figure 5.36 Historical Total Capacity and AGR in New Zealand, 1966-2015, MW, %
Figure 5.37 Existing Capacity and New Capacity in New Zealand, 1966-2015, MW
Figure 5.38 New Zealand Market Share and Other Markets in Total Installed Capacity, 2000-2015, %
Figure 5.39 New Zealand Geothermal Power Market Total Spending Forecast, 2017-2027, $mn, AGR (%)
Figure 5.40 New Zealand Geothermal Power Market Capacity Forecast, 2017-2027, MW, AGR (%)
Figure 5.41 New Zealand Geothermal Existing Capacity and New Capacity Forecast, 2016-2026, MW
Figure 5.42 Geological Resources Map of Iceland
Figure 5.43 Historical Total Capacity and AGR in Iceland, 1969-2015, MW, %
Figure 5.44 Existing Capacity and New Capacity in Iceland, 1969-2015, MW
Figure 5.45 Iceland Market Share and Other Markets in Total Installed Capacity, 2000-2015, %
Figure 5.46 Iceland Geothermal Power Market Total Spending Forecast, 2017-2027, $mn, AGR (%)
Figure 5.47 Iceland Geothermal New Capacity Forecast, 2017-2027, MW
Figure 5.48 Iceland Geothermal Existing Capacity and New Capacity Forecast, 2016-2026, MW
Figure 5.49 Geothermal Resources Map of Kenya
Figure 5.50 Historical Total Capacity and AGR in Kenya, 1981-2015, MW, %
Figure 5.51 Existing Capacity and New Capacity in Kenya, 1981-2015, MW
Figure 5.52 Kenya Market Share and Other Markets in Total Installed Capacity, 2000-2015, %
Figure 5.53 Kenyan Geothermal Power Market Total Spending Forecast, 2017-2027, $mn, AGR (%)
Figure 5.54 Kenyan Geothermal Power Market Capacity Forecast, 2017-2027, $mn, AGR (%)
Figure 5.55 Kenyan Geothermal Existing Capacity and New Capacity Forecast, 2016-2026, MW
Figure 5.56 Geothermal Resources Map of Japan
Figure 5.57 Historical Total Capacity and AGR in Japan, 1966-2015, MW, %
Figure 5.58 Existing Capacity and New Capacity in Japan, 1966-2015, MW
Figure 5.59 Japanese Market Share and Other Markets in Total Installed Capacity, 2000-2015, %
Figure 5.60 Japanese Geothermal Power Market Total Spending Forecast, 2017-2027, $mn, AGR (%)
Figure 5.61 Japanese Geothermal Power Market Capacity Forecast, 2017-2027, $mn, AGR (%)
Figure 5.62 Japanese Geothermal Existing Capacity and New Capacity Forecast, 2016-2026, MW
Figure 5.63 Geothermal Resources Map of Turkey
Figure 5.64 Historical Total Capacity and AGR in Turkey, 1984-2015, MW, %
Figure 5.65 Existing Capacity and New Capacity in Turkey, 1984-2015, MW
Figure 5.66 Turkish Market Share and Other Markets in Total Installed Capacity, 2000-2015, %
Figure 5.67 Turkish Geothermal Power Market Total Spending Forecast, 2017-2027, $mn, AGR (%)
Figure 5.68 Turkish Geothermal Power Market Capacity Forecast, 2017-2027, $mn, AGR (%)
Figure 5.69 Turkish Geothermal Existing Capacity and New Capacity Forecast, 2016-2026, MW
Figure 5.70 Historical Total Capacity and AGR in RoW, 1966-2015, MW, %
Figure 5.71 Existing Capacity and New Capacity in RoW, 1966-2015, MW
Figure 5.72 RoW Market Share and Other Markets in Total Installed Capacity, 2000-2015, %
Figure 5.73 RoW Geothermal Power Market Total Spending Forecast, 2017-2027, $mn, AGR (%)
Figure 5.74 RoW Geothermal New Capacity Forecast, 2017-2027, MW
Figure 5.75 RoW Geothermal Existing Capacity and New Capacity Forecast, 2016-2026, MW
Figure 8.1 Mitsubishi Heavy Industries Limited Total Company Sales 2011-2015 (US$m, AGR %)
Figure 8.2 Mitsubishi Heavy Industries Limited Sales in the Geothermal Power Market 2013-2015 (US$m, AGR %)
Figure 8.3 Toshiba Corporation Total Company Sales 2011-2015 (US$m, AGR %)
Figure 8.4 Toshiba Corporation Sales in the Geothermal Power Market 2013-2015 (US$m, AGR %)
Figure 8.5 Ormat Technologies Total Company Sales 2011-2015 (US$m, AGR %)
Figure 8.6 Fuji Electric Co., Ltd. Total Company Sales 2011-2015 (US$m, AGR %)
Figure 8.7 Fuji Electric Co., Ltd. Sales in the Geothermal Power Market 2012-2015 (US$m, AGR %)
Figure 8.8 Ansaldo Energia Total Company Sales 2011-2015 (US$m, AGR %)
Figure 8.9 General Electric Total Company Sales 2012-2016 (US$m, AGR %)
Figure 8.10 General Electric Sales in the Geothermal Power Market 2012-2016 (US$m, AGR %)
Figure 8.11 US Geothermal Inc. Company Sales 2011-2016 (US$m, AGR %)
Figure 8.12 Calpine Corporation Company Sales 2011-2016 (US$m, AGR %)
AAE Systems
Aboitiz Power
Africa Geothermal
AGEOP
Agua Caliente, LLC
AI Farma
Akita Geothermal Energy Co
Alres A.S.
Alstom
Altarock Energy
Alternative Earth Resources, Inc.
Alterra Power
Amedee Geothermal Venture
Andean Geothermic Energy S.A.C
Ansaldo Energia
AP Renewables Inc (Subisidary Aboitiz Power Corp)
Basic Energy Corp.
Beowawe Power LLC
Bflat
Bleninser
BM Enerji
Borealis Geo Power
Bottle Rock Power PLC
BPPT
Burc Group
CalEnergy
Calpine
CDC Infrastructure
Celikler A.S.
Centram Geothermal ADAGE Ventures Inc.
CFG Services;
Chena Hot Springs
Chevron Energy
Chevron Geothermal India
Chevron Geothermal Philippines Holdings
Chuo Electric Power Co
Clean Rock Renewable Energy
Clean Source Energy
Compania Federal de Electricidad
Constellation
Constellation Energy
Contact Energy
Coso Operating Co.
Cyrq Energy
Dakotta Territory
Daldrup & Sohne AG
Davenport Newberry Holdings
Deep Earth Energy Production Corp
Dewhurst group
Dizamatra Powerindo
Drilling Corp.
East Japan Railway Co.,
Eco Energy
Edit Co.
Efla Engineering
EGE Energy
Electerre de France
ElectraTherm, Inc.
Electric Power Development Co
Electric Power Tibet
Emerging Markets Energy Pte Ltd
Empresa de Generacion de Energia Electrica del INDE
Empresa Nicaraguense de Electricidad (ENEL)
Empresa Transmisora de El Salvador (ETESAL)
ENDA Enerji
Enel
Energia Andina
Energy Corp Emerging Power Resource Holdings
Energy Development Corp.
EnergySource
Enex
Entiv Organic Energy
Erdem
Ergon Energy
Esu-Esu consultant
Ethiopian Electric Power Corporation
EU-FIRE & Manvit
Experimental-Industrial Verkhne-Mutnovskaya GeoPP
Filtech Energy
First Nation
Fonroche
Fuji Electric
Gafo Energy NZ,
GDF Suez (Engie)
General Electric
Geo Dipa Energy
Geodipa
Geodynamics
Geo-Energy Co.
GeoGlobal
Geonext Corporation
GeoSyndicate
Geoterceira, S.A
Geotermia Andina
Geotérmica para el Desarollo S.A.P.I de C.V.
Geotermica Quellaapacheta Peru S.A.C (GQP)
Geothermal Electric Limited
Geothermal Engineering
Geothermal Engineering Co.
Geothermal LLC
Geothermal Power
Geothermeon
Geothermie Bouilante
Geothermie SAS
Giri Indah Sejahtera
Global Geothermal Limited
Gradient Resources
Green Energy
Green Rock Energy
Greenco
GreenEco
GreenFire Energy
GT Energy
Gural Porselen
Guris Holdings
Gurmat A.S.
Habert Power
Harasho
Hera
Hirosaki City, Aomori
HL Power Company
Hokkaido Electric Power Co.
Home Stretch Geothermal
Hot Rock Limited
Hourei Co.
Hudson Ranch Energy Services
Iceland Drilling company
Idemitsu Kosan
Idemitsu Oita Geothermal
Infinergeo SpA
INPEX
Internaitonal
Isagen
Ishimatsu no-en
ITOCHU Copr. JV,
Izmir Jeotermal AS
Jamaica
JAPEX
Jeomar
JX Nippon Oil and Gas Exploration
Kalaharhi Geo Energy Limited
Karadeniz Holding
Kawasaki Heavy Industries
Kayi
KenGen
KITECH
Kodali Inc.
Kokushokankokai
Kujyu Kanko Hotel
Kyushu Electric Power
Kyushu Electric Power
Kyushu Electric Power Corp
Lihir Gold
Limak
LL Geothermal Inc
Lt. Scandinavia Corporation
Magma Energy (US) Corp
Maibarara Geothermal
Maren Enerji
Marubeni Co.
Medco Power
Menderes A.S.
Menderes Geothermal
Merve Group
Mexxus RG,
Mighty River Power
Minami Aso Villege Gov
Minera Escondidd
Mitsubishi Heavy Industries
Moberg Finance
MOECO
Mt Princeton Geothermal LLC
Nevis Renewable Energy
New World Energy
NGE Group
Nitetsu Kagoshima Geothermal Co/Kyushu Electric Power Co
Northern California Power Agency
NPO Nanto Genki
NPO REDS Syonan
Obayashi Corp
Ohyama Kanko Kaihatsu
Oita Venture Capital Co.
Okushiri Town, Hokkaido
ONGC
Optima Nusantara Energi
Origin Energy Chili
Orix Co.
Orkuveita Reykjavikur
Ormat
Orpower Twenty Two
Oserian Development Company
Pacific Geo Energy
PacificCorp
Pagosa Verde
PAN Papirna Industrija
Pawakom International Ltd.
Pertamina Geothermal Energy
Petratherm
Petroleum Corporation of Jamaica
Piling Engineering
PLN
PLTP
PPC Renewables
PT Medco Power Indonesia
Qualibou Energy
Quantam Power
Quantec Geoscience
Radius Gold Inc.
Ram Power
Ramsey
Rarik Turkison
Raser Technologies
Raya Group
Renewables
Resevior Capital Corp
Resources Corp
Resources Corp.
RESPEC Consulting & Services
Reykjavik Emera Inc
Rican Electricity
Sabang
Sanbeam
Saray Holding
SC Geoterm
Sejahtera Alam Energy
Simbol Material
Sintesa Banten Geothermal
SOGEO S.A.
Sol-E Suissel
Sorkik Merapi Geothermal
Sosian Energy
Soyak-Mis Enerji
Spring Energy
Star Energy Ltd
Suginoi Hotel
Summa Kumagai
Supreme Energy
Surprise Valley Electric Corp.
Syntesa Banten Geothermal (SBG)
Taiwan Bureau of
Takafuji Co.
Tanzania (GPT)
Tas Energy
Tawau Green Energy
Technologies, Inc.
Teknosatrial Energy/Layman
Terra-Gen Operating Co.
Timtas
Tohoku Electric Power
Tohoku Electric Power Co. Group
Tokyo Electric Power
Top Energy
Toshiba
Toya spa corp
Transmark Chile
Transmark Renewables
Transmark Turkey
Tsuchiyu onsen energy Co.
Tsujita Group
Tsurugakankokaiha tsu and Hokuden Sogo Sekkei Co.
Tuaropaki Power Company
Turcas BM Kuyucak Jeotermal Elektrik
U.S. Geothermal Inc.
Urayasudensetsu
Uretim
VITO
Wahana Sambadhasakti
Waita Geothermal Power Plant
Wasabi
Water
West Indies Power
Wijaya Karya Jabar Power
Yislan Group
Zaldivar Mining Company
Zorlu Enerji
List of Other Organisations Mentioned
African Union Commission (AUC)
Armenian Ministry of Energy and Natural Resources
BRGM (French overseas development)
Costa Rica Electricity Institute (ICE)
Costa Rica Geothermal Resources Service
Électricité de France Développement Environnement
European EGS Interest Group
Instituto Costaricense de Electricidad
International Geothermal Association
Korea Institute of Geosciences and Mineral Resources
Mexican Federal Electricity Commission (CFE)
Ministry of Natural Resources of Russia
Oregon Institute of Technology
Renewable Energy Organisation of Iran
The Research Council of Norway
US Department of Energy
UK Department for Energy & Climate Change, Cheshire East Council
United Nations
University of North Dakota
Wadia Institute of Himalayan Geology
World Bank
Download sample pages
Complete the form below to download your free sample pages for Geothermal Power Market Forecast 2017-2027Download sample pages
Complete the form below to download your free sample pages for Geothermal Power Market Forecast 2017-2027Do you have any custom requirements we can help you with?
Any specific country, geo region, market segment or specific company information?
Email us today, we can discuss your needs and see how we can help: jamie.roberts@visiongain.com
Would you like a free report overview of the report of your choice?
If so, please drop an email to Jamie Roberts stating your chosen report title to jamie.roberts@visiongain.com
Visiongain energy reports are compiled using a broad and rich mixture of both primary and secondary information to produce an overall industry outlook. In order to provide our clients with the best product possible product, we do not rely on any one single source of information. Visiongain analysts reach out to market-leading vendors and industry experts where possible but also review a wealth of financial data and product information from a vast range of sources. To find out more about our reports methodology, please email jamie.roberts@visiongain.com
Would you like to get the latest Visiongain energy reports catalogue?
What are the dynamic growth sectors? where are the regional business opportunities?
Which technologies will prevail and who are the leading companies succeeding in these sectors and why?
If you want definitive answers to business critical questions, discover Visiongain’s full range of business intelligence reports.
If so, please email Jamie Roberts on jamie.roberts@visiongain.com or call her today on +44 207 336 6100
“The Visiongain report was extremely insightful and helped us construct our basic go-to market strategy for our solution.”
H.
“F.B has used Visiongain to prepare two separate market studies on the ceramic proppants market over the last 12 months. These reports have been professionally researched and written and have assisted FBX greatly in developing its business strategy and investment plans.”
F.B
“We just received your very interesting report on the Energy Storage Technologies (EST) Market and this is a very impressive and useful document on that subject.”
I.E.N
“Visiongain does an outstanding job on putting the reports together and provides valuable insight at the right informative level for our needs. The EOR Visiongain report provided confirmation and market outlook data for EOR in MENA with the leading countries being Oman, Kuwait and eventually Saudi Arabia.”
E.S
“Visiongain produced a comprehensive, well-structured GTL Market report striking a good balance between scope and detail, global and local perspective, large and small industry segments. It is an informative forecast, useful for practitioners as a trusted and upto-date reference.”
Y.N Ltd
Association of Dutch Suppliers in the Oil & Gas Industry
Society of Naval Architects & Marine Engineers
Association of Diving Contractors
Association of Diving Contractors International
Associazione Imprese Subacquee Italiane
Australian Petroleum Production & Exploration Association
Brazilian Association of Offshore Support Companies
Brazilian Petroleum Institute
Canadian Energy Pipeline
Diving Medical Advisory Committee
European Diving Technology Committee
French Oil and Gas Industry Council
IMarEST – Institute of Marine Engineering, Science & Technology
International Association of Drilling Contractors
International Association of Geophysical Contractors
International Association of Oil & Gas Producers
International Chamber of Shipping
International Shipping Federation
International Marine Contractors Association
International Tanker Owners Pollution Federation
Leading Oil & Gas Industry Competitiveness
Maritime Energy Association
National Ocean Industries Association
Netherlands Oil and Gas Exploration and Production Association
NOF Energy
Norsk olje og gass Norwegian Oil and Gas Association
Offshore Contractors’ Association
Offshore Mechanical Handling Equipment Committee
Oil & Gas UK
Oil Companies International Marine Forum
Ontario Petroleum Institute
Organisation of the Petroleum Exporting Countries
Regional Association of Oil and Natural Gas Companies in Latin America and the Caribbean
Society for Underwater Technology
Society of Maritime Industries
Society of Petroleum Engineers
Society of Petroleum Enginners – Calgary
Step Change in Safety
Subsea UK
The East of England Energy Group
UK Petroleum Industry Association
All the events postponed due to COVID-19.
Don’t Miss Out!
Latest Energy news
Energy as a Service (EaaS) Market
The global Energy as a Service (EaaS) market is projected to grow at a CAGR of 12.6% by 2034
25 July 2024
Synthetic Fuels Market
The global Synthetic Fuels market is projected to grow at a CAGR of 23% by 2034
18 July 2024
Power-to-X (P2X) Market
The global Power-to-X (P2X) market is projected to grow at a CAGR of 10.6% by 2034
09 July 2024
Airborne Wind Energy Market
The global Airborne Wind Energy market is projected to grow at a CAGR of 9.7% by 2034
05 June 2024


