The latest report from business intelligence provider Visiongain offers comprehensive analysis of the global gas insulated substation market. Visiongain assesses that this market will generate revenues of $23.08bn in 2017.
How this report will benefit you
Read on to discover how you can exploit the future business opportunities emerging in the GIS sector. Visiongain’s new study tells you and tells you NOW.
In this brand new report you find 194 in-Depth tables, charts and graphs all unavailable elsewhere.
The 185 page report provides clear detailed insight into the global Gas Insulated Substation market. Discover the key drivers and challenges affecting the market.
By ordering and reading our brand new report today you stay better informed and ready to act.
Report Scope
The report delivers considerable added value by revealing:
• How is the Gas Insulated Substation market evolving?
– See detailed tables of 46 individual Gas Insulated Substation contracts & projects around the world.
• What is driving and restraining Gas Insulated Substation market dynamics?
• How will each Gas Insulated Substation submarket segment grow over the forecast period and how much sales will these submarkets account for in 2027?
– Gas Insulated Substation – Medium Voltage (<72.5 kV)
– Gas Insulated Substation – High Voltage (> 72.5 kV)
• Which individual technologies will prevail and how will these shifts be responded to?
• How will political and regulatory factors influence regional Gas Insulated Substation markets and submarkets?
• Will leading national Gas Insulated Substation market broadly follow macroeconomic dynamics, or will individual country sectors outperform the rest of the economy?
– North America Gas Insulated Substation Market Forecast 2017-2027
– US Gas Insulated Substation Market Forecast 2017-2027
– Canadian Gas Insulated Substation Market Forecast 2017-2027
– European Gas Insulated Substation Market Forecast 2017-2027
– Russia Gas Insulated Substation Market Forecast 2017-2027
– Germany Gas Insulated Substation Market Forecast 2017-2027
– UK Gas Insulated Substation Market Forecast 2017-2027
– Rest of Europe Gas Insulated Substation Market Forecast 2017-2027
– Asia Pacific Gas Insulated Substation Market Forecast 2017-2027
– China Gas Insulated Substation Market Forecast 2017-2027
– India Gas Insulated Substation Market Forecast 2017-2027
– Japan Gas Insulated Substation Market Forecast 2017-2027
– Rest of Asia Pacific Gas Insulated Substation Market Forecast 2017-2027
– Rest of World Gas Insulated Substation Market Forecast 2017-2027
– Saudi Arabia Gas Insulated Substation Market Forecast 2017-2027
– Brazil Gas Insulated Substation Market Forecast 2017-2027
– South Africa Gas Insulated Substation Market Forecast 2017-2027
• Who are the leading players and what are their prospects over the forecast period?
– ABB Ltd.
– Areva SA
– Crompton Greaves Limited
– Eaton Corporation Plc
– Fuji Electric Co.Ltd
– General Electric Company
– Hitachi.Ltd
– Mitsubishi Electric Corporation
– Schneider Electric SE
– Siemens AG
– Toshiba Corporation
• How will the sector evolve as alliances form during the period between 2017 and 2027?
• SWOT analysis of the major factors impacting the market
• Conclusions and recommendations which will aid decision-making
Who should read this report?
• Anyone within the Gas Insulated Substation value chain
• Gas insulated substation companies
• Gas insulated substation devices manufacturers
• Gas insulated substation technology providers
• Transmission & Distribution (T&D) companies
• Utilities companies
• Power companies
• Heads of strategic development
• Market analysts
• Procurement staff
• Consultants
• Business development managers
• Marketing managers
• Technologists
• Suppliers
• Investors
• Banks
• Government departments & agencies
• Contractors
Visiongain’s study is intended for anyone requiring commercial analyses for the nuclear waste market and leading companies. You find data, trends and predictions.
Buy our report today Gas Insulated Substation (GIS) Market Outlook 2017-2027: Revenue Forecasts ($bn) by Voltage Range (Medium (≤ 72.5 KV) and High (> 72.5 KV) voltage), Regional and National Level Analysis; North America (U.S, Canada), Europe (Germany, U.K, Russia), Asia-Pacific (China, India, Japan) and the Rest of the World (Saudi Arabia, Brazil, South Africa). Avoid missing out by staying informed – get our report now.
Visiongain is a trading partner with the US Federal Government
CCR Ref number: KD4R6
1. Report Overview
1.1 Global Gas Insulated Substation Market Overview
1.2 Why You Should Read This Report
1.3 How This Report Delivers
1.4 Key Questions Answered by This Analytical Report Include:
1.5 Who is This Report For?
1.6 Methodology
1.6.1 Primary Research
1.6.2 Secondary Research
1.6.3 Market Evaluation & Forecasting Methodology
1.7 Frequently Asked Questions (FAQ)
1.8 Associated Visiongain Reports
1.9 About Visiongain
2. Introduction to the Gas Insulated Substation Market
2.1 Gas Insulated Substation Market Structure
2.2 Gas Insulated Substation Market Definition
2.3 Brief History of Gas Insulated Substation
2.4 Gas Insulated Substation Submarkets Definition
2.4.1 Gas Insulated Substation – Medium Voltage (<72.5 kV) Submarket Definition
2.4.2 Gas Insulated Substation – High Voltage (> 72.5 kV) Submarket Definition
3. Global Gas Insulated Substation Market 2017-2027
3.1 Global Gas Insulated Substation Market Forecast 2017-2027
3.2 Gas Insulated Substation Market Drivers & Restraints 2017
3.2.1 Drivers in the Gas Insulated Substation Market
3.2.1.1 Minimal Space Requirement
3.2.1.2 Protection Against Pollution And Safety Under Faulty Conditions
3.2.1.3 Economical Mobility of the Substation
3.2.1.4 Easy Installation and Commissioning and Low Operating Costs
3.2.1.5 Dielectric Strength of SF6
3.2.2 Restraints in the Gas Insulated Substation Market
3.2.2.1 High Initial Investment
3.2.2.2 Procurement and Supply of SF6 is Difficult
3.2.2.3 Regular Cleanliness to Avoid the System Breakdown
3.2.2.4 High Level Monitoring as Gas Leakage can be Harmful and Hazardous to Health
4. Global Gas Insulated Substation By Voltage Range Forecast 2017-2027
4.1 Global Gas Insulated Substation Medium Voltage (≤ 72.5 KV) Forecast 2017-2027
4.1.1 Asia-Pacific will Drive the Medium Voltage Gas Insulated Substation Market
4.2 Global Gas Insulated Substation High Voltage (> 72.5 KV) Forecast 2017-2027
4.2.1 Expansion of Transmission and Distribution Network
5. Leading Regional and National Gas Insulated Substation Market Forecast 2017-2027
5.1 Global Gas Insulated Substation Market by Regional Market Share Forecast 2017-2027
5.2 North America Gas Insulated Substation Market Forecast 2017-2027
5.2.1 The US Gas Insulated Substation Market Forecast 2017-2027
5.2.1.1 The US Gas Insulated Substation Market Overview 2017-2027
5.2.1.2 The US Gas Insulated Substation Market - Current Projects 2017-2027
5.2.1.3 Drivers and Restraints in the US Gas Insulated Substation Market
5.2.2 Canada Gas Insulated Substation Market Forecast 2017-2027
5.2.2.1 Canada Gas Insulated Substation Market Overview 2017-2027
5.2.2.2 Canada Gas Insulated Substation Market - Current Projects 2017-2027
5.2.2.3 Drivers and Restraints in the Canada Gas Insulated Substation Market
5.3 Europe Gas Insulated Substation Market Forecast 2017-2027
5.3.1 Russia Gas Insulated Substation Market Forecast 2017-2027
5.3.1.1 Russia Gas Insulated Substation Market Overview 2017-2027
5.3.1.2 Russia Gas Insulated Substation Market - Current Projects 2017-2027
5.3.1.3 Drivers and Restraints in Russia Gas Insulated Substation Market
5.3.2 Germany Gas Insulated Substation Market Forecast 2017-2027
5.3.2.1 Germany Gas Insulated Substation Market Overview 2017-2027
5.3.2.2 Germany Gas Insulated Substation Market - Current Projects 2017-2027
5.3.2.3 Drivers and Restraints in Germany Gas Insulated Substation Market
5.3.3 The UK Gas Insulated Substation Market Forecast 2017-2027
5.3.3.1 The UK Gas Insulated Substation Market Overview 2017-2027
5.3.3.2 The UK Gas Insulated Substation Market - Current Projects 2017-2027
5.3.3.3 Drivers and Restraints in UK Gas Insulated Substation Market
5.3.4 Rest of Europe Gas Insulated Substation Market Forecast 2017-2027
5.3.4.1 Rest of Europe Gas Insulated Substation Market Overview 2017-2027
5.3.4.2 Drivers and Restraints in Rest of Europe Gas Insulated Substation Market
5.4 Asia Pacific Gas Insulated Substation Market Forecast 2017-2027
5.4.1 China Gas Insulated Substation Market Forecast 2017-2027
5.4.1.1 China Gas Insulated Substation Market Overview 2017-2027
5.4.1.2 China Gas Insulated Substation Market - Current Projects 2017-2027
5.4.1.3 Drivers and Restraints in China Gas Insulated Substation Market
5.4.2 India Gas Insulated Substation Market Forecast 2017-2027
5.4.2.1 India Gas Insulated Substation Market Overview 2017-2027
5.4.2.2 India Gas Insulated Substation Market - Current Projects 2017-2027
5.4.2.3 Drivers and Restraints in the Indian Gas Insulated Substation Market
5.4.3 Japan Gas Insulated Substation Market Forecast 2017-2027
5.4.3.1 The Japanese Gas Insulated Substation Market Overview 2017-2027
5.4.3.2 The Japanese Gas Insulated Substation Market – Current Projects 2017-2027
5.4.3.3 Drivers and Restraints in the Japanese Gas Insulated Substation Market
5.4.4 Rest of Asia Pacific Gas Insulated Substation Market Forecast 2017-2027
5.4.4.1 Rest of Asia Pacific Gas Insulated Substation Market Overview 2017-2027
5.4.4.2 Drivers and Restraints in the Rest of Asia Pacific Gas Insulated Substation Market
5.5 Rest of World Gas Insulated Substation Market Forecast 2017-2027
5.5.1 Saudi Arabia Gas Insulated Substation Market Forecast 2017-2027
5.5.1.1 Saudi Arabia Gas Insulated Substation Market Overview 2017-2027
5.5.1.2 Saudi Arabia Gas Insulated Substation Market - Current Projects 2017-2027
5.5.1.3 Drivers and Restraints in Saudi Arabia Gas Insulated Substation Market
5.5.2 Brazil Gas Insulated Substation Market Forecast 2017-2027
5.5.2.1 Brazil Gas Insulated Substation Market Overview 2017-2027
5.5.2.2 Brazil Gas Insulated Substation Market - Current Projects 2017-2027
5.5.2.3 Drivers and Restraints in Brazil Gas Insulated Substation Market
5.5.3 South Africa Gas Insulated Substation Market Forecast 2017-2027
5.5.3.1 South Africa Gas Insulated Substation Market Overview 2017-2027
5.5.3.2 South Africa Gas Insulated Substation Market - Current Projects 2017-2027
5.5.3.3 Drivers and Restraints in South Africa Gas Insulated Substation Market
5.5.4 Other Countries in RoW Gas Insulated Substation Market Forecast 2017-2027
5.5.4.1 Other Countries in RoW Gas Insulated Substation Market Overview 2017-2027
5.5.4.2 Drivers and Restraints in Other Countries in RoW Gas Insulated Substation Market
6. SWOT Analysis of the Gas Insulated Substation Market 2017-2027
6.1 Strengths
6.2 Weaknesses
6.3 Opportunities
6.4 Threats
7. The Leading Companies in the Gas Insulated Substation Market
7.1 Areva SA
7.1 Leading 10 Gas Insulated Substation Company Sales Share Analysis 2016
7.1.1 Toshiba Corporation
7.1.1.1 Toshiba Corporation Gas Insulated Substation Selected Recent Contracts / Projects / Programmes 2016
7.1.1.2 Toshiba Corporation Total Company Sales 2011-2015
7.1.1.3 Toshiba Corporation Sales in the Gas Insulated Substation Market 2013-2015
7.1.2 Siemens AG
7.1.2.1 Siemens AG Gas Insulated Substation Selected Recent Contracts / Projects / Programmes 2015-2016
7.1.2.2 Siemens AG Total Company Sales 2011-2015
7.1.2.3 Siemens AG Sales in the Gas Insulated Substation Market 2013-2015
7.1.3 Mitsubishi Electric Corporation
7.1.3.1 Mitsubishi Electric Corporation Gas Insulated Susbtation Selected Recent Contracts / Projects / Programmes 2015
7.1.3.2 Mitsubishi Electric Corporation Total Company Sales 2011-2015
7.1.3.3 Mitsubishi Electric Corporation Sales in the Gas Insulated Substation Market 2011-2015
7.1.4 General Electric Company
7.1.4.1 General Electric Company Gas Insulated Substation Selected Recent Contracts / Projects / Programmes 2016
7.1.4.2 General Electric CompanyTotal Company Sales 2011-2015
7.1.4.3 General Electric Company Sales in the Gas Insulated Substation Market 2011-2015
7.1.5 Eaton Corporation Plc
7.1.5.1 Eaton Corporation Plc Gas Insulated Substation Selected Recent Contracts / Projects / Programmes 2016
7.1.5.2 Eaton Corporation Plc Total Company Sales 2011-2015
7.1.5.3 Eaton Corporation Plc Sales in the Gas Insulated Substation Market 2011-2015
7.1.6 ABB Ltd.
7.1.6.1 ABB Ltd. Gas Insulated Substation Selected Recent Contracts / Projects / Programmes 2015-2016
7.1.6.2 ABB Ltd Total Company Sales 2011-2015
7.1.6.3 ABB Ltd Sales in the Gas Insulated Substation Market 2011-2015
7.1.7 Schneider Electric SE
7.1.7.1 Schneider Electric SE Total Company Sales 2011-2015
7.1.7.2 Schneider Electric SE Sales in the Gas Insulated Substation Market 2012-2015
7.1.8 Fuji Electric Co.Ltd
7.1.8.1 Fuji Electric Co. Ltd Total Company Sales 2011-2015
7.1.8.2 Fuji Electric Co. Ltd Sales in the Gas Insulated Substation Market 2013-2015
7.1.9 Hitachi.Ltd
7.1.9.1 Hitachi. Ltd Total Company Sales 2011-2015
7.1.9.2 Hitachi. Ltd Sales in the Gas Insulated Substation Market 2014-2015
7.1.10 Crompton Greaves Limited
7.2 Other Companies Involved in the Gas Insulated Substation Market 2016
8. Conclusions and Recommendations
8.1 Key Findings
8.2 Recommendations
9. Glossary
List of Tables
Table 1.1 Gas Insulated Substation Market by Regional Market Forecast 2017-2027 (US$bn, AGR %, Cumulative)
Table 1.2 Gas Insulated Substation Market Forecast by Voltage Range 2017-2027 (US$bn, AGR %, Cumulative)
Table 3.1 Global Gas Insulated Substation Market Forecast 2017-2027 (US$bn, AGR %, CAGR %, Cumulative)
Table 3.2 Gas Insulated Substation Market Drivers & Restraints
Table 4.1 Global Gas Insulated Substation By Voltage Range Forecast 2017-2027 (US $bn, AGR %, Cumulative)
Table 4.2 Global Gas Insulated Substation By Voltage Range by Region Market Forecast 2017-2027 (US$bn, Cumulative, Global AGR %)
Table 4.3 Global Gas Insulated Substation By Voltage Range CAGR Forecast 2017-2022, 2022-2027, 2017-2027 (CAGR %)
Table 4.4 Global Gas Insulated Substation Medium Voltage (≤ 72.5 KV) Submarket by Region Market Forecast 2017-2027 (US$bn, AGR %, CAGR %, Cumulative)
Table 4.5 Global Gas Insulated Substation Market by Medium Voltage (≤ 72.5 KV) Regional Market CAGR Forecast 2017-2022, 2022-2027, 2017-2027 (CAGR %)
Table 4.6 Global Gas Insulated Substation High Voltage (> 72.5 KV) Submarket by Region Market Forecast 2017-2027 (US$bn, AGR %, CAGR %, Cumulative)
Table 4.7 Global Gas Insulated Substation Market by High Voltage (> 72.5 KV) Regional Market CAGR Forecast 2017-2022, 2022-2027, 2017-2027 (CAGR %)
Table 5.1 Leading Regional Gas Insulated Substation Market by Voltage Range Forecast 2017-2027 (US$bn, Global AGR %, Cumulative)
Table 5.2 Regional Gas Insulated Substation Market Percentage Change in Market Share 2017-2022, 2022-2027, 2017-2027 (% Change)
Table 5.3 Leading National Gas Insulated Substation Market Forecast 2017-2027 (US$bn, AGR %, CAGR %, Cumulative)
Table 5.4 North America Gas Insulated Substation Market by Voltage Range Forecast 2017-2027 (US$bn, AGR %, CAGR %, Cumulative)
Table 5.5 North America Gas Insulated Substation Market Major Contracts & Programmes 2003-2018 (Project Name, Location, Companies, Capacity (kV), Operation Year)
Table 5.6 U.S. Gas Insulated Substation Market by Voltage Range Forecast 2017-2027 (US$bn, AGR %, CAGR %, Cumulative)
Table 5.7 U.S. Gas Insulated Substation Projects, Project Name, Location, Companies, Capacity (kV), Operation Date
Table 5.8 Drivers and Restraints in the US Gas Insulated Substation Market
Table 5.9 Canada Gas Insulated Substation Market by Voltage Range Forecast 2017-2027 (US$bn, AGR %, CAGR %, Cumulative)
Table 5.10 Canada Gas Insulated Substation Projects, Project Name, Location, Companies, Capacity (kV), Operation Date
Table 5.11 Drivers and Restraints in the Canada Gas Insulated Substation Market
Table 5.12 Europe Gas Insulated Substation Market by Voltage Range Forecast 2017-2027 (US$bn, AGR %, CAGR %, Cumulative)
Table 5.13 Europe Gas Insulated Substation Market Major Contracts & Programmes 2012-2018 (Project Name, Location, Companies, Capacity (kV), Operation Year)
Table 5.14 Russia Gas Insulated Substation Market by Voltage Range Forecast 2017-2027 (US$bn, AGR %, CAGR %, Cumulative)
Table 5.15 Russia Gas Insulated Substation Projects, Project Name, Location, Companies, Capacity (kV), Operation Date
Table 5.16 Drivers and Restraints in Russia Gas Insulated Substation Market
Table 5.17 Germany Gas Insulated Substation Market by Voltage Range Forecast 2017-2027 (US$bn, AGR %, CAGR %, Cumulative)
Table 5.18 Germany Gas Insulated Substation Projects, Project Name, Location, Companies, Capacity (kV), Operation Date
Table 5.19 Drivers and Restraints in Germany Gas Insulated Substation Market
Table 5.20 UK Gas Insulated Substation Market by Voltage Range Forecast 2017-2027 (US$bn, AGR %, CAGR %, Cumulative)
Table 5.21 UK Gas Insulated Substation Projects, Project Name, Location, Companies, Capacity (kV), Operation Date
Table 5.22 Drivers and Restraints in the UK Gas Insulated Substation Market
Table 5.23 Rest of Europe Gas Insulated Substation Market by Voltage Range Forecast 2017-2027 (US$bn, AGR %, CAGR %, Cumulative)
Table 5.24 Drivers and Restraints in Rest of Europe Gas Insulated Substation Market
Table 5.25 Asia Pacific Gas Insulated Substation Market by Voltage Range Forecast 2017-2027 (US$bn, AGR %, CAGR %, Cumulative)
Table 5.26 Asia Pacific Gas Insulated Substation Market Major Contracts & Programmes 2003-2018 (Project Name, Location, Companies, Capacity (kV), Operation Year)
Table 5.27 China Gas Insulated Substation Market by Voltage Range Forecast 2017-2027 (US$bn, AGR %, CAGR %, Cumulative)
Table 5.28 China Gas Insulated Substation Projects, Project Name, Location, Companies, Capacity (kV), Operation Date
Table 5.29 Drivers and Restraints in China Gas Insulated Substation Market
Table 5.30 India Gas Insulated Substation Market by Voltage Range Forecast 2017-2027 (US$bn, AGR %, CAGR %, Cumulative)
Table 5.31 India Gas Insulated Substation Projects, Project Name, Location, Companies, Capacity (kV), Operation Date
Table 5.32 Drivers and Restraints in the Indian Gas Insulated Substation Market
Table 5.33 Japan Gas Insulated Substation Market by Voltage Range Forecast 2017-2027 (US$bn, AGR %, CAGR %, Cumulative)
Table 5.34 Japan Gas Insulated Substation Projects, Project Name, Location, Companies, Capacity (kV), Operation Date
Table 5.35 Drivers and Restraints in the Japanese Gas Insulated Substation Market
Table 5.36 Rest of Asia Pacific Gas Insulated Substation Market by Voltage Range Forecast 2017-2027 (US$bn, AGR %, CAGR %, Cumulative)
Table 5.37 Drivers and Restraints in the Japanese Gas Insulated Substation Market
Table 5.38 Rest of World Gas Insulated Substation Market by Voltage Range Forecast 2017-2027 (US$bn, AGR %, CAGR %, Cumulative)
Table 5.39 Rest of World Gas Insulated Substation Market Major Contracts & Programmes 2003-2018 (Project Name, Location, Companies, Capacity (kV), Operation Year)
Table 5.40 Saudi Arabia Gas Insulated Substation Market by Voltage Range Forecast 2017-2027 (US$bn, AGR %, CAGR %, Cumulative)
Table 5.41 Saudi Arabia Gas Insulated Substation Projects, Project Name, Location, Companies, Capacity (kV), Operation Date
Table 5.42 Drivers and Restraints in Saudi Arabia Gas Insulated Substation Market
Table 5.43 Brazil Gas Insulated Substation Market by Voltage Range Forecast 2017-2027 (US$bn, AGR %, CAGR %, Cumulative)
Table 5.44 Brazil Gas Insulated Substation Projects, Project Name, Location, Companies, Capacity (kV), Operation Date
Table 5.45 Drivers and Restraints in Brazil Gas Insulated Substation Market
Table 5.46 South Africa Gas Insulated Substation Market by Voltage Range Forecast 2017-2027 (US$bn, AGR %, CAGR %, Cumulative)
Table 5.47 South Africa Gas Insulated Substation Projects, Project Name, Location, Companies, Capacity (kV), Operation Date
Table 5.48 Drivers and Restraints in South Africa Gas Insulated Substation Market
Table 5.49 Other Countries in RoW Gas Insulated Substation Market by Voltage Range Forecast 2017-2027 (US$bn, AGR %, CAGR %, Cumulative)
Table 5.50 Drivers and Restraints in Other Countries in RoW Gas Insulated Substation Market
Table 6.1 Global Gas Insulated Substation Market SWOT Analysis2017-2027
Table 7.1 The 10 Leading Gas Insulated Substation Companies Sales Share 2016 (Ranking, Company, FY2014 Total Company Sales US$m, FY2015 Sales in the Market US$m, Share of FY2015 Total Sales from Sales in the Market US$m, Primary Market Specialisation)
Table 7.2 Toshiba Corporation Profile 2015 (CEO, Total Company Sales US$m, Sales in the Relevant Division Producing GIS Technology US$m, Share of Company Sales from Relevant Division Producing GIS Technology %, Net Income / Loss US$m, Net Capital Expenditure US$m, Strongest Business Region, Business Segment in the Market, HQ, Founded, No. of Employees, IR Contact, Ticker, Website)
Table 7.3 Selected Recent Toshiba Corporation Gas Insulated Substation Contracts / Projects / Programmes 2016 (Date, Country, Subcontractor, Value US$m, Product, Details)
Table 7.4 Toshiba Corporation Total Company Sales 2011-2015 (US$m, AGR %)
Table 7.5 Toshiba Corporation Sales in the Division Producing Gas Insulated Substation 2013-2015 (US$m, AGR %)
Table 7.6 Siemens AG Profile 2015 (CEO, Total Company Sales US$m, Sales in the Relevant Division Producing GIS Technology US$m, Share of Company Sales from Relevant Division Producing GIS Technology %, Net Income / Loss US$m, Net Capital Expenditure US$m, Strongest Business Region, Business Segment in the Market, HQ, Founded, No. of Employees, IR Contact, Ticker, Website)
Table 7.7 Selected Recent Siemens AG Gas Insulated Substation Contracts / Projects / Programmes 2015-2016 (Date, Country, Subcontractor, Value US$m, Product, Details)
Table 7.8 Siemens AG Total Company Sales 2011-2015 (US$m, AGR %)
Table 7.9 Siemens AG Sales in the Division Producing Gas Insulated Substation 2013-2015 (US$m, AGR %)
Table 7.10 Mitsubishi Electric Corporation 2015 (CEO, Total Company Sales US$m, Sales in the Relevant Division Producing GIS Technology US$m, Share of Company Sales from Relevant Division Producing GIS Technology %, Net Income / Loss US$m, Net Capital Expenditure US$m, Strongest Business Region, Business Segment in the Market, HQ, Founded, No. of Employees, IR Contact, Ticker, Website)
Table 7.11 Selected Recent Mitsubishi Electric Corporation Gas Insulated Substation Contracts / Projects / Programmes 2015 (Date, Country, Subcontractor, Value US$m, Product, Details)
Table 7.12 Mitsubishi Electric Corporation Total Company Sales 2011-2015 (US$m, AGR %)
Table 7.13 Mitsubishi Electric Corporation Sales in the Division Producing Gas Insulated Substation 2011-2015 (US$m, AGR %)
Table 7.14 General Electric Company 2015 (CEO, Total Company Sales US$m, Sales in the Relevant Division Producing GIS Technology US$m, Share of Company Sales from Relevant Division Producing GIS Technology %, Net Income / Loss US$m, Net Capital Expenditure US$m, Strongest Business Region, Business Segment in the Market, HQ, Founded, No. of Employees, IR Contact, Ticker, Website)
Table 7.15 Selected Recent General Electric Company Gas Insulated Substation Contracts / Projects / Programmes 2016 (Date, Country, Subcontractor, Value US$m, Product, Details)
Table 7.16 General Electric Company Total Company Sales 2011-2015 (US$m, AGR %)
Table 7.17 General Electric Company Sales in the Division Producing Gas Insulated Substation 2011-2015 (US$m, AGR %)
Table 7.18 Eaton Corporation Plc 2015 (CEO, Total Company Sales US$m, Sales in the Relevant Division Producing GIS Technology US$m, Share of Company Sales from Relevant Division Producing GIS Technology %, Net Income / Loss US$m, Net Capital Expenditure US$m, Strongest Business Region, Business Segment in the Market, HQ, Founded, No. of Employees, IR Contact, Ticker, Website)
Table 7.19 Selected Recent Eaton Corporation Plc Gas Insulated Substation Contracts / Projects / Programmes 2016 (Date, Country, Subcontractor, Value US$m, Product, Details)
Table 7.20 Eaton Corporation Plc Total Company Sales 2011-2015 (US$m, AGR %)
Table 7.21 Eaton Corporation Plc Sales in the Division Producing Gas Insulated Substation 2011-2015 (US$m, AGR %)
Table 7.22 ABB Ltd 2015 (CEO, Total Company Sales US$m, Sales in the Relevant Division Producing GIS Technology US$m, Share of Company Sales from Relevant Division Producing GIS Technology %, Net Income / Loss US$m, Net Capital Expenditure US$m, Strongest Business Region, Business Segment in the Market, HQ, Founded, No. of Employees, IR Contact, Ticker, Website)
Table 7.23 Selected Recent ABB Ltd Projects / Programmes 2015-2016 (Date, Country, Subcontractor, Value US$m, Product, Details)
Table 7.24 ABB Ltd Total Company Sales 2011-2015 (US$m, AGR %)
Table 7.25 ABB Ltd Sales in the Division Producing Gas Insulated Substation 2011-2015 (US$m, AGR %)
Table 7.26 Schneider Electric SE (CEO, Total Company Sales US$m, Sales in the Relevant Division Producing GIS Technology US$m, Share of Company Sales from Relevant Division Producing GIS Technology %, Net Income / Loss US$m, Net Capital Expenditure US$m, Strongest Business Region, Business Segment in the Market, HQ, Founded, No. of Employees, IR Contact, Ticker, Website)
Table 7.27 Schneider Electric SE Total Company Sales 2011-2015 (US$m, AGR %)
Table 7.28 Schneider Electric SE Sales in the Division Producing Gas Insulated Substation 2011-2015 (US$m, AGR %)
Table 7.29 Fuji Electric Co. Ltd (CEO, Total Company Sales US$m, Sales in the Relevant Division Producing GIS Technology US$m, Share of Company Sales from Relevant Division Producing GIS Technology %, Net Income / Loss US$m, Net Capital Expenditure US$m, Strongest Business Region, Business Segment in the Market, HQ, Founded, No. of Employees, IR Contact, Ticker, Website)
Table 7.30 Fuji Electric Co. Ltd Total Company Sales 2011-2015 (US$m, AGR %)
Table 7.31 Fuji Electric Co.Ltd SE Sales in the Division Producing Gas Insulated Substation 2012-2015 (US$m, AGR %)
Table 7.32 Hitachi Ltd (CEO, Total Company Sales US$m, Sales in the Relevant Division Producing GIS Technology US$m, Share of Company Sales from Relevant Division Producing GIS Technology %, Net Income / Loss US$m, Net Capital Expenditure US$m, Strongest Business Region, Business Segment in the Market, HQ, Founded, No. of Employees, IR Contact, Ticker, Website)
Table 7.33 Hitachi. Ltd Total Company Sales 2011-2015 (US$m, AGR %)
Table 7.34 Hitachi Ltd SE Sales in the Division Producing Gas Insulated Substation 2013-2015 (US$m, AGR %)
Table 7.35 Crompton Greaves Limited (CEO, Total Company Sales US$m, Sales in the Relevant Division Producing GIS Technology US$m, Share of Company Sales from Relevant Division Producing GIS Technology %, Net Income / Loss US$m, Net Capital Expenditure US$m, Strongest Business Region, Business Segment in the Market, HQ, Founded, No. of Employees, IR Contact, Ticker, Website)
Table 7.36 Selected Recent Crompton Greaves limited Gas Insulated Substation Contracts / Projects / Programmes 2016 (Date, Country, Subcontractor, Value US$m, Product, Details)
Table 7.37 Crompton Greaves Limited Total Company Sales 2011-2015 (US$m, AGR %)
Table 7.38 Crompton Greaves Limited SE Sales in the Division Producing Gas Insulated Substation 2011-2015 (US$m, AGR %)
Table 7.39 Other Companies Involved in the Gas Insulated Substation Market 2016 (Company, Submarket Involvement, Location)
Table 8.1 Global Gas Insulated Substation Market by Region Market Forecast 2017-2027 (US$bn, AGR %, Cumulative)
Table 8.2 Global Gas Insulated Substation By Voltage Range Forecast 2017-2027 (US$bn, AGR %, Cumulative)
List of Figures
Figure 1.1 Gas Insulated Substation Market by Regional Market Share Forecast 2017, 2022, 2027 (% Share)
Figure 2.1 Global Gas Insulated Substation Market Segmentation Overview
Figure 3.1 Global Gas Insulated Substation Market Forecast 2017-2027 (US$bn, AGR %)
Figure 4.1 Global Gas Insulated Substation By Voltage Range AGR Forecast 2017-2027 (AGR %)
Figure 4.2 Global Gas Insulated Substation By Voltage Range Forecast 2017-2027 (US$bn, Global AGR %)
Figure 4.3 Global Gas Insulated Substation By Voltage Range Share Forecast 2017 (% Share)
Figure 4.4 Global Gas Insulated Substation By Voltage Range Share Forecast 2022 (% Share)
Figure 4.5 Global Gas Insulated Substation By Voltage Range Share Forecast 2027 (% Share)
Figure 4.6 Global Gas Insulated Substation Medium Voltage (≤ 72.5 KV) by Region Market AGR Forecast 2017-2027 (AGR %)
Figure 4.7 Global Gas Insulated Substation Medium Voltage (≤ 72.5 KV) by Region Market 2017-2027 (US$bn, Global AGR %)
Figure 4.8 Global Gas Insulated Substation Medium Voltage (≤ 72.5 KV) Market Share by Region Market Forecast 2017 (% Share)
Figure 4.9 Global Gas Insulated Substation Medium Voltage (≤ 72.5 KV) Market Share by Region Market Forecast 2022 (% Share)
Figure 4.10 Global Gas Insulated Substation Medium Voltage (≤ 72.5 KV) Market Share by Region Market Forecast 2027 (% Share)
Figure 4.11 Global Gas Insulated Substation High Voltage (> 72.5 KV) by Region Market AGR Forecast 2017-2027 (AGR %)
Figure 4.12 Global Gas Insulated Substation High Voltage (>72.5 KV) by Region Market 2017-2027 (US$bn, Global AGR %)
Figure 4.13 Global Gas Insulated Substation High Voltage (> 72.5 KV) Market Share by Region Market Forecast 2017 (% Share)
Figure 4.14 Global Gas Insulated Substation High Voltage (> 72.5 KV) Market Share by Region Market Forecast 2022 (% Share)
Figure 4.15 Global Gas Insulated Substation High Voltage (> 72.5 KV) Market Share by Region Market Forecast 2027 (% Share)
Figure 5.1 Global Gas Insulated Substation Market by Region Market Forecast 2017-2027 (US$bn, Global AGR %)
Figure 5.2 Global Gas Insulated Substation Market by Region Market AGR Forecast 2017-2027 (AGR %)
Figure 5.3 Global Gas Insulated Substation Market by Regional Market Share Forecast 2017 (% Share)
Figure 5.4 Global Gas Insulated Substation Market by Regional Market Share Forecast 2022 (% Share)
Figure 5.5 Global Gas Insulated Substation Market by Regional Market Share Forecast 2027 (% Share)
Figure 5.6 Leading National Gas Insulated Substation Market Forecast 2017-2027 (US$bn, AGR%)
Figure 5.7 Leading National Gas Insulated Substation Market Forecast 2017 (%)
Figure 5.8 Leading National Gas Insulated Substation Market Forecast 2022 (%)
Figure 5.9 Leading National Gas Insulated Substation Market Forecast 2027 (%)
Figure 5.10 Leading National Gas Insulated Substation Market Forecast 2017-2027 (US$bn)
Figure 5.11 Leading National Gas Insulated Substation Market Cumulative Total Sales 2017-2027 (US$bn)
Figure 5.12 North America Gas Insulated Substation By Voltage Range AGR Forecast 2017-2027 (AGR %)
Figure 5.13 North America Gas Insulated Substation Market by Voltage Range Forecast 2017-2027 (US$bn, North America Total Market Sales AGR %)
Figure 5.14 North America Gas Insulated Substation Market Share Forecast 2017, 2022, 2027 (% Share)
Figure 5.15 U.S. Gas Insulated Substation Market Forecast 2017-2027 (US$bn, AGR%)
Figure 5.16 U.S. Gas Insulated Substation Market Share Forecast 2017, 2022, 2027 (% Share)
Figure 5.17 Canada Gas Insulated Substation Market Forecast 2017-2027 (US$bn, AGR%)
Figure 5.18 Canada Gas Insulated Substation Market Share Forecast 2017, 2022, 2027 (% Share)
Figure 5.19 Europe Gas Insulated Substation By Voltage Range AGR Forecast 2017-2027 (AGR %)
Figure 5.20 Europe Gas Insulated Substation Market by Voltage Range Forecast 2017-2027 (US$bn, Europe Total Market Sales AGR %)
Figure 5.21 Europe Gas Insulated Substation Market Share Forecast 2017, 2022, 2027 (% Share)
Figure 5.22 Russia Gas Insulated Substation Market Forecast 2017-2027 (US$bn, AGR%)
Figure 5.23 Russia Gas Insulated Substation Market Share Forecast 2017, 2022, 2027 (% Share)
Figure 5.24 Germany Gas Insulated Substation Market Forecast 2017-2027 (US$bn, AGR%)
Figure 5.25 Germany Gas Insulated Substation Market Share Forecast 2017, 2022, 2027 (% Share)
Figure 5.26 UK Gas Insulated Substation Market Forecast 2017-2027 (US$bn, AGR%)
Figure 5.27 UK Gas Insulated Substation Market Share Forecast 2017, 2022, 2027 (% Share)
Figure 5.28 Rest of Europe Gas Insulated Substation Market Forecast 2017-2027 (US$bn, AGR%)
Figure 5.29 Rest of Europe Gas Insulated Substation Market Share Forecast 2017, 2022, 2027 (% Share)
Figure 5.30 Asia Pacific Gas Insulated Substation By Voltage Range AGR Forecast 2017-2027 (AGR %)
Figure 5.31 Asia Pacific Gas Insulated Substation Market by Voltage Range Forecast 2017-2027 (US$bn, Asia Pacific Total Market Sales AGR %)
Figure 5.32 Asia Pacific Gas Insulated Substation Market Share Forecast 2017, 2022, 2027 (% Share)
Figure 5.33 China Gas Insulated Substation Market Forecast 2017-2027 (US$bn, AGR%)
Figure 5.34 China Gas Insulated Substation Market Share Forecast 2017, 2022, 2027 (% Share)
Figure 5.35 India Gas Insulated Substation Market Forecast 2017-2027 (US$bn, AGR%)
Figure 5.36 India Gas Insulated Substation Market Share Forecast 2017, 2022, 2027 (% Share)
Figure 5.37 Japan Gas Insulated Substation Market Forecast 2017-2027 (US$bn, AGR%)
Figure 5.38 Japan Gas Insulated Substation Market Share Forecast 2017, 2022, 2027 (% Share)
Figure 5.39 Rest of Asia Pacific Gas Insulated Substation Market Forecast 2017-2027 (US$bn, AGR%)
Figure 5.40 Rest of Asia Pacific Gas Insulated Substation Market Share Forecast 2017, 2022, 2027 (% Share)
Figure 5.41 Rest of World Gas Insulated Substation By Voltage Range AGR Forecast 2017-2027 (AGR %)
Figure 5.42 Rest of World Gas Insulated Substation Market by Voltage Range Forecast 2017-2027 (US$bn, Rest of World Total Market Sales AGR %)
Figure 5.43 Rest of World Gas Insulated Substation Market Share Forecast 2017, 2022, 2027 (% Share)
Figure 5.44 Saudi Arabia Gas Insulated Substation Market Forecast 2017-2027 (US$bn, AGR%)
Figure 5.45 Saudi Arabia Gas Insulated Substation Market Share Forecast 2017, 2022, 2027 (% Share)
Figure 5.46 Brazil Gas Insulated Substation Market Forecast 2017-2027 (US$bn, AGR%)
Figure 5.47 Brazil Gas Insulated Substation Market Share Forecast 2017, 2022, 2027 (% Share)
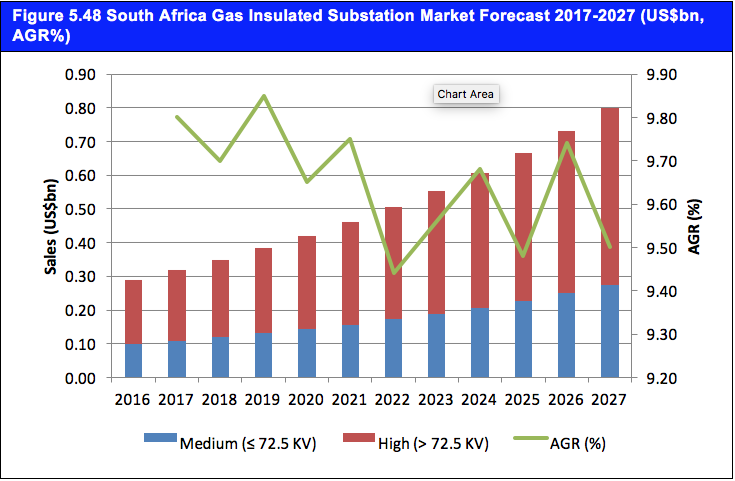
Figure 5.48 South Africa Gas Insulated Substation Market Forecast 2017-2027 (US$bn, AGR%)
Figure 5.49 South Africa Gas Insulated Substation Market Share Forecast 2017, 2022, 2027 (% Share)
Figure 5.50 Other Countries in RoW Gas Insulated Substation Market Forecast 2017-2027 (US$bn, AGR%)
Figure 5.51 Other Countries in RoW Gas Insulated Substation Market Share Forecast 2017, 2022, 2027 (% Share)
Figure 7.1 The Ten Leading Companies Total Revenues 2015 (Total Company Sales US$m)
Figure 7.2 The Ten Leading Companies Ranked by Their Total Company Revenues, (%)
Figure 7.3 Toshiba Corporation Total Company Sales 2011-2015 (US$m, AGR %)
Figure 7.4 Toshiba Corporation Sales in the Gas Insulated Substation Market 2013-2015 (US$m, AGR %)
Figure 7.5 Siemens AG Total Company Sales 2011-2015 (US$m, AGR %)
Figure 7.6 Siemens AG Sales in the Gas Insulated Substation Market 2013-2015 (US$m, AGR %)
Figure 7.7 Mitsubishi Electric Corporation Total Company Sales 2011-2015 (US$m, AGR %)
Figure 7.8 Mitsubishi Electric Corporation Sales in the Gas Insulated Substation Market 2011-2015 (US$m, AGR %)
Figure 7.9 General Electric Company Total Company Sales 2011-2015 (US$m, AGR %)
Figure 7.10 General Electric Company Sales in the Gas Insulated Substation Market 2011-2015 (US$m, AGR %)
Figure 7.11 Eaton Corporation Plc Total Company Sales 2011-2015 (US$m, AGR %)
Figure 7.12 Eaton Corporation Plc Sales in the Gas Insulated Substation Market 2011-2015 (US$m, AGR %)
Figure 7.13 ABB Ltd Total Company Sales 2011-2015 (US$m, AGR %)
Figure 7.14 ABB Ltd Sales in the Gas Insulated Substation Market 2011-2015 (US$m, AGR %)
Figure 7.15 Schneider Electric SE Total Company Sales 2011-2015 (US$m, AGR %)
Figure 7.16 Schneider Electric SE Sales in the Gas Insulated Substation Market 2012-2015 (US$m, AGR %)
Figure 7.17 Fuji Electric Co. Ltd Total Company Sales 2011-2015 (US$m, AGR %)
Figure 7.18 Fuji Electric Co. Ltd Sales in the Gas Insulated Substation Market 2013-2015 (US$m, AGR %)
Figure 7.19 Hitachi Ltd Total Company Sales 2011-2015 (US$m, AGR %)
Figure 7.20 Hitachi Ltd Sales in the Gas Insulated Substation Market 2014-2015 (US$m, AGR %)
Figure 7.21 Crompton Greaves Limited Company Sales 2011-2015 (US$m, AGR %)
Figure 7.22 Crompton Greaves Limited Sales in the Gas Insulated Substation Market 2011-2015 (US$m, AGR %)


