The embedded systems market is flourishing right now. This growth is partially a result of the continued development of technological trends, such as adoption of the Internet of Things and smart devices. Visiongain evaluates that the embedded systems market will be worth $171.04bn in 2017, with major opportunities for incumbent and new entrants to capitalise upon this market expansion.
Market Trends
• Growth opportunities in emerging markets
• Sustained growth in more developed markets
• Rapid adoption of Smart Devices
• New opportunities created as a result of the evolution of IoT
Quantitative Market Analytics
• Global forecasts from 2017-2022
• National and regional forecasts from 2017-2022
• Submarket forecasts from 2017-2022
• Regional markets forecast by submarkets for 2017-2022
• Market share data of the leading 7 companies
Qualitative Analyses
• Drivers/Restraints analysis of the market.
• Porter’s Five Forces analysis of the market
• Value Chain analysis
Competitive landscape analysis
• Intel Corporation
• Texas Instruments Inc.
• Renesas Electronics Corporation
• STMicroelectronics N.V.
• Microchip Technology Incorporated
• Qualcomm Incorporated
• Mentor Graphics Corporation
• Infineon Technologies AG
• Maxim Integrated Products, Inc.
• Cypress Semiconductor Corporation
Visiongain’s study is for everybody needing commercial analyses for the embedded systems market and leading companies. You will find data, trends and predictions within our report, which is over 130 pages, and features over 120 charts.
Get our report today: Embedded Systems Market Forecast 2017-2022: By Type (Embedded Hardware, Embedded Software), by Industry Vertical (Automotive, Telecommunications, Healthcare, Industrial, Consumer Electronics, Military and Aerospace, Others), by Region (North America, Europe, Asia Pacific, Rest of the World), by National Market (Including China, US, UK, India and More), with Leading Companies Discussed. Avoid missing out – get our report now.
Visiongain is a trading partner with the US Federal Government
CCR Ref number: KD4R6
1. Report Overview
1.1 Global Embedded Systems Market Overview
1.2 Why You Should Read This Report
1.3 How This Report Delivers
1.4 Key Questions Answered by This Analytical Report Include:
1.5 Who is This Report For?
1.6 Methodology
1.6.1 Secondary Research
1.6.2 Market Evaluation & Forecasting Methodology
1.7 Frequently Asked Questions (FAQ)
1.8 Associated Visiongain Reports
1.9 About Visiongain
2. Introduction
2.1 Objectives of the Study
2.2 Market Definition
2.2.1 Embedded systems Market at a Glance:
2.2.2 Market Segmentation
2.3 Currency
2.4 Assumptions
3. Research Methodology
3.1 Data Collection
3.2 Secondary Data
3.3 Market Size Estimation
4. Executive Summary
4.1 Global Embedded systems Market Size 2017-2022
4.2 Global Embedded systems Market Size 2017-2022
5. Embedded systems Market Dynamics
5.1 Reference Diagram of Drivers, Restraints, and Opportunities
5.2 Drivers
5.2.1 Rapid Adoption of Smart Devices
5.2.2 Technological Development Across Various Industries
5.2.3 Rising Adoption of Consumer Electronics
5.3 Restraints
5.3.1 Design Limitations in Embedded systems
5.4 Opportunities
5.4.1 Opportunities Created By The Evolution of IoT (Internet of Things) Devices
6. Embedded Systems Industry Analysis
6.1 Value Chain Analysis
6.1.1 Raw Material Suppliers:
6.1.2 Component Manufacturers:
6.1.3 System Integrators:
6.1.4 Distributors:
6.1.5 End-use Industry:
6.2 Porter’s Five Forces Analysis
6.2.1 Bargaining Power of Suppliers
6.2.2 Bargaining Power of Buyers
6.2.3 Threat of New Entrants
6.2.4 Threat from Substitutes
6.2.5 Degree of Competition
7. Premium Insights
7.1 Regional Growth Insight
7.2 Key Investment Pockets, By End-use Vertical
7.3 Market Positions of Top 5 Players
8. Global Embedded Systems Market
8.1 Global Embedded Systems Market, By Type 2017-2022
8.1.1 Introduction
8.1.2 Segment Revenue Forecast 2017-2022
8.1.3 Market Share Forecast
8.1.4 Growth Comparison
8.2 Global Embedded Systems Market, By Industry Vertical 2017-2022
8.2.1 Introduction
8.2.1.1 Automotive:
8.2.1.2 Telecommunication:
8.2.1.3 Healthcare:
8.2.1.4 Industrial:
8.2.1.5 Consumer Electronics:
8.2.1.6 Military and Aerospace:
8.2.1.7 Others (Government, Office Automation, and Retail):
8.2.2 Segment Revenue Forecast 2017-2022
8.2.3 Market Share Forecast
8.2.4 Growth Comparison
9. Global Embedded Systems Market, By Geography 2017-2022
9.1 Introduction
9.2 Segment Revenue Forecast 2017-2022
9.3 Market Share Forecast
9.4 Growth Comparison
10. North America Embedded Systems Market 2017-2022
10.1 North America Embedded Systems Market, By Type 2017-2022
10.1.1 Introduction
10.1.2 Segment Revenue Forecast 2017-2022
10.1.3 Market Share Forecast
10.1.4 Growth Comparison
10.2 North America Embedded Systems Market, By Industry Vertical 2017-2022
10.2.1 Introduction
10.2.2 Segment Revenue Forecast 2017-2022
10.2.3 Market Share Forecast
10.2.4 Growth Comparison
10.3 North America Embedded Systems Market, By Country 2017-2022
10.3.1 Introduction
10.3.2 Segment Revenue Forecast 2017-2022
10.3.3 Market Share Forecast
10.3.4 Growth Comparison
11. Europe Embedded Systems Market 2017-2022
11.1 Europe Embedded Systems Market, By Type 2017-2022
11.1.1 Introduction
11.1.2 Segment Revenue Forecast 2017-2022
11.1.3 Market Share Forecast
11.1.4 Growth Comparison
11.2 Europe Embedded Systems Market, By Industry Vertical 2017-2022
11.2.1 Introduction
11.2.2 Segment Revenue Forecast 2017-2022
11.2.3 Market Share Forecast
11.2.4 Growth Comparison
11.3 Europe Embedded Systems Market, By Country 2017-2022
11.3.1 Introduction
11.3.2 Segment Revenue Forecast 2017-2022
11.3.3 Market Share Forecast
11.3.4 Growth Comparison
12. Asia Pacific (APAC) Embedded Systems Market 2017-2022
12.1 APAC Embedded Systems Market, By Type 2017-2022
12.1.1 Introduction
12.1.2 Segment Revenue Forecast 2017-2022
12.1.3 Market Share Forecast
12.1.4 Growth Comparison
12.2 APAC Embedded Systems Market, By Industry Vertical 2017-2022
12.2.1 Introduction
12.2.2 Segment Revenue Forecast 2017-2022
12.2.3 Market Share Forecast
12.2.4 Growth Comparison
12.3 APAC Embedded Systems Market, By Country 2017-2022
12.3.1 Introduction
12.3.2 Segment Revenue Forecast 2017-2022
12.3.3 Market Share Forecast
12.3.4 Growth Comparison
13. Rest of the World (RoW) Embedded Systems Market 2017-2022
13.1 RoW Embedded Systems Market, By Type 2017-2022
13.1.1 Introduction
13.1.2 Segment Revenue Forecast 2017-2022
13.1.3 Market Share Forecast
13.1.4 Growth Comparison
13.2 RoW Embedded Systems Market, By Industry Vertical 2017-2022
13.2.1 Introduction
13.2.2 Segment Revenue Forecast 2017-2022
13.2.3 Market Share Forecast
13.2.4 Growth Comparison
14. Embedded Systems Competitive Landscape
14.1 Market Share of 7 Leading Companies
14.1.1 Introduction
14.2 Key Winning Strategies
14.2.1 Introduction
14.2.2 Embedded Systems Mergers & Acquisitions
14.2.3 Embedded Systems New Product Developments
14.2.4 Embedded Systems Expansion/Partnership Agreements
15. Company Profiles
15.1 Intel Corporation
15.1.1Revenue, by Geographic Region, 2016 and Revenue & Y-o-Y Growth, 2014-2016
15.1.2 Revenue, by Business Segment, 2016 and Research & Development, 2014-2016
15.1.3 Recent Acquisitions and New Product Launch
15.1.4 Intel Corporation Analysis
15.2 Texas Instruments Inc.
15.2.1 Revenue, by Geographic Region, 2016 and Revenue & Y-o-Y Growth, 2014-2016
15.2.2 Revenue, by Business Segment, 2016 and Research & Development, 2014-2016
15.2.3 Recent Expansion
15.2.4 Texas Instruments Analysis
15.3 Renesas Electronics Corporation
15.3.1 Revenue, by Geographic Region, 2016 and Revenue & Y-o-Y Growth, 2014-2016
15.3.2 Revenue, by Business Segment, 2016 and Research & Development, 2014-2016
15.3.3 Recent Acquisition and New Product Launch
15.3.4 Renesas Corporation Analysis
15.4 STMicroelectronics N.V.
15.4.1 Revenue, by Geographic Region, 2015 and Revenue & Y-o-Y Growth, 2013-2015
15.4.2 Revenue, by Business Segment, 2015 and Research & Development, 2013-2015
15.4.3 Recent Acquisition and New Product Launch
15.4.4 STMicroelectronics N.V. Analysis
15.5 Microchip Technology Incorporated
15.5.1 Revenue, by Geographic Region, 2016 and Revenue & Y-o-Y Growth, 2014-2016
15.5.2 Revenue, by Business Segment, 2016 and Research & Development, 2014-2016
15.5.3 Recent Acquisitions and New Product Launch
15.5.4 Microchip Technology Incorporated Analysis
15.6 Qualcomm Incorporated
15.6.1 Revenue & Y-o-Y Growth, 2014-2016
15.6.2 Revenue, by Business Segment, 2016 and Research & Development, 2014-2016
15.6.3 Recent Strategic Agreement
15.6.4 Qualcomm Incorporated Analysis
15.7 Mentor Graphics Corporation
15.7.1 Revenue, by Geographic Region, 2016 and Revenue & Y-o-Y Growth, 2014-2016
15.7.2 Revenue, by Business Segment, 2016 and Research & Development, 2014-2016
15.7.3 Recent Acquisitions and New Product Launch
15.7.4 Mentor Graphics Analysis
15.8 Infineon Technologies AG
15.8.1 Revenue, by Geographic Region, 2016 and Revenue & Y-o-Y Growth, 2014-2016
15.8.2 Revenue, by Business Segment, 2016 and Research & Development, 2014-2016
15.8.3 Recent Acquisitions and New Product Launch
15.8.4 Infineon Technologies AG Analysis
15.9 Maxim Integrated Products, Inc.
15.9.1 Revenue, by Geographic Region, 2016 and Revenue & Y-o-Y Growth, 2014-2016
15.9.2 Research & Development, 2014-2016
15.9.3 Recent Acquisitions and Strategic Agreement
15.9.4 Maxim Integrated Products, Inc. Analysis
15.10 Cypress Semiconductor Corporation
15.10.1 Revenue, by Geographic Region, 2016 and Revenue & Y-o-Y Growth, 2014-2016
15.10.2 Revenue, by Business Segment, 2016 and Research & Development, 2014-2016
15.10.3 Recent Acquisitions
15.10.4 Cypress Semiconductor Corporation Analysis
15.11 Other Companies in the Market
16. Conclusions and Recommendations
16.1 Regional and National Market Performance
16.2 Recommendations
17. Glossary
Associated Visiongain Reports
Visiongain Report Sales Order Form
Appendix A
About Visiongain
Appendix B
Visiongain report evaluation form
List of Tables
Table 1: EXAMPLE Global Embedded Systems Market Forecast, By Type 2017-2022 (US$ Bn, AGR %, Cumulative)
Table 2: Global Embedded Systems Market Size 2017-2022 (US$ Bn, AGR %, CAGR %)
Table 3: Global Embedded Systems Market Forecast, By Type 2017-2022 (US$Bn, AGR %, Cumulative)
Table 4: Global Embedded Systems Market CAGR Forecast 2017-2019, 2020-2022, 2017-2022 (CAGR %)
Table 5: Global Embedded Systems Market Forecast, By Industry Vertical 2017-2022 (US$ Bn, AGR %, Cumulative)
Table 6: Global Embedded Systems Market CAGR Forecast, By Industry Vertical 2017-2019, 2020-2022, 2017-2022 (CAGR %)
Table 7: Global Embedded Systems Market Forecast, By Geography2017-2022 (US$ Bn, AGR %, CAGR %)
Table 8: Global Embedded Systems Market CAGR Forecast 2017-2019, 2020-2022, 2017-2022 (CAGR %)
Table 9: North America Embedded Systems Market Forecast, By Type 2017-2022 (US$ Bn, AGR %, CAGR %)
Table 10: North America Embedded System Market CAGR Forecast 2017-2019, 2020-2022, 2017-2022 (CAGR %)
Table 11: North America Embedded Systems Market Forecast, By Industry Vertical 2017-2022 (US$ Bn, AGR %, CAGR %)
Table 12: North America Embedded Systems Market CAGR Forecast, By Industry Vertical 2017-2019, 2020-2022, 2017-2022 (CAGR %)
Table 13: North America Embedded Systems Market Forecast, By Country 2017-2022 (US$ Bn, AGR %, CAGR %)
Table 14: North America Embedded Systems Market CAGR Forecast 2017-2019, 2020-2022, 2017-2022 (CAGR %)
Table 15: Europe Embedded Systems Market Forecast, By Type 2017-2022 (US$ Bn, AGR %, Cumulative)
Table 16: Europe Embedded System Market CAGR Forecast 2017-2019, 2020-2022, 2017-2022 (CAGR %)
Table 17: Europe Embedded Systems Market Forecast, By Industry Vertical 2017-2022 (US$ Bn, AGR %, CAGR %)
Table 18: Europe Embedded Systems Market CAGR Forecast, By Industry Vertical 2017-2019, 2020-2022, 2017-2022 (CAGR %)
Table 19: Europe Embedded Systems Market Forecast, By Country 2017-2022 (US$ Bn, AGR %, CAGR %)
Table 20: Europe Embedded Systems Market CAGR Forecast 2017-2019, 2020-2022, 2017-2022 (CAGR %)
Table 21: APAC Embedded Systems Market Forecast, By Type 2017-2022 (US$ Bn, AGR %, CAGR %)
Table 22: APAC Embedded System Market CAGR Forecast 2017-2019, 2020-2022, 2017-2022 (CAGR %)
Table 23: APAC Embedded System/>Figure 26: North America Embedded Systems Market Forecast, By Industry Vertical 2017-2022 (USD Bn)
Figure 27: North America Embedded Systems Market, By Industry Vertical, Share Forecast 2016 (% Share)
Figure 28: North America Embedded Systems Market, By Industry Vertical, Share Forecast 2022 (% Share)
Figure 29: Compounded Growth Comparison
Figure 30: North America Embedded Systems Market Forecast, By Country 2017-2022 (USD Bn)
Figure 31: North America Embedded Systems Market, By Country, Share Forecast 2016 (% Share)
Figure 32: North America Embedded Systems Market, By Country, Share Forecast 2022 (% Share)
Figure 33: Compounded Growth Comparison
Figure 34: Europe Embedded Systems Market Forecast, By Type 2017-2022 (USD Bn)
Figure 35: Europe Embedded Systems Market, By Type, Share Forecast 2016 (% Share)
Figure 36: Europe Embedded Systems Market, By Type, Share Forecast 2022 (% Share)
Figure 37: Compounded Growth Comparison
Figure 38: Europe Embedded Systems Market Forecast, By Industry Vertical 2017-2022 (USD Bn)
Figure 39: Europe Embedded Systems Market, By Industry Vertical, Share Forecast 2016 (% Share)
Figure 40: Europe Embedded Systems Market, By Industry Vertical, Share Forecast 2022 (% Share)
Figure 41: Compounded Growth Comparison
Figure 42: Europe Embedded Systems Market Forecast, By Country 2017-2022 (USD Bn)
Figure 43: Europe Embedded Systems Market, By Country, Share Forecast 2016 (% Share)
Figure 44: Europe Embedded Systems Market, By Country, Share Forecast 2022 (% Share)
Figure 45: Compounded Growth Comparison
Figure 46: APAC Embedded Systems Market Forecast, By Type 2017-2022 (USD Bn)
Figure 47: APAC Embedded Systems Market, By Type, Share Forecast 2016 (% Share)
Figure 48: APAC Embedded Systems Market, By Type, Share Forecast 2022 (% Share)
Figure 49: Compounded Growth Comparison
Figure 50: APAC Embedded Systems Market Forecast, By Industry Vertical 2017-2022 (USD Bn)
Figure 51: APAC Embedded Systems Market, By Industry Vertical, Share Forecast 2016 (% Share)
Figure 52: APAC Embedded Systems Market, By Industry Vertical, Share Forecast 2022 (% Share)
Figure 53: Compounded Growth Comparison
Figure 54: APAC Embedded Systems Market Forecast, By Country 2017-2022 (USD Bn)
Figure 55: APAC Embedded Systems Market, By Country, Share Forecast 2016 (% Share)
Figure 56: APAC Embedded Systems Market, By Country, Share Forecast 2022 (% Share)
Figure 57: Compounded Growth Comparison
Figure 58: RoW Embedded Systems Market Forecast, By Type 2017-2022 (USD Bn)
Figure 59: RoW Embedded Systems Market, By Type, Share Forecast 2016 (% Share)
Figure 60: RoW Embedded Systems Market, By Type, Share Forecast 2022 (% Share)
Figure 61: Compounded Growth Comparison
Figure 62: RoW Embedded Systems Market Forecast, By Industry Vertical 2017-2022 (USD Bn)
Figure 63: RoW Embedded Systems Market, By Industry Vertical, Share Forecast 2016 (% Share)
Figure 64: RoW Embedded Systems Market, By Industry Vertical, Share Forecast 2022 (% Share)
Figure 65: Compounded Growth Comparison
Figure 66: Market Share of 7 Leading Companies 2016 (% Share)
Figure 67: Strategy Share Analysis 2016 (% Share)
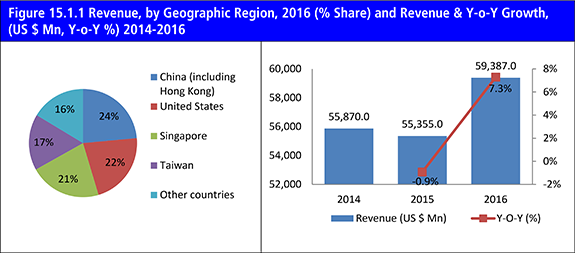
Figure 15.1.1 Revenue, by Geographic Region, 2016 (% Share) and Revenue & Y-o-Y Growth, (US $ Mn, Y-o-Y %) 2014-2016
Figure 15.1.2 Revenue, by Business Segment, 2016 (% Share) and Research & Development, (US $ Mn) 2014-2016
Figure 15.2.1 Revenue, by Geographic Region, 2016 (% Share) and Revenue & Y-o-Y Growth, (US $ Mn, Y-o-Y %) 2014-2016
Figure 15.2.2 Revenue, by Business Segment, 2016(% Share) and Research & Development, (US $ Mn) 2014-2016
Figure 15.3.1 Revenue, by Geographic Region, 2016(% Share) and Revenue & Y-o-Y Growth, (US $ Mn, Y-o-Y %) 2014-2016
Figure 15.3.2 Revenue, by Business Segment, 2016(% Share) and Research & Development, (US $ Mn) 2014-2016
Figure 15.4.1 Revenue, by Geographic Region, 2015(% Share) and Revenue & Y-o-Y Growth, (US