Market Definition:
• Cryogenic valves are similar to conventional valves, with the only difference of Gas and features such as an extended stem.
• Cryogenic valves works with temperature below -110°C, and are widely used in industrial gas, LNG, LPG and other low temperature applications and regulating or controlling the flow of cryogenic gases, slurries or liquids at low temperatures.
Market Overview and Trends
• Cryogenic Valves are available in various shapes and sizes so that they can handle different pressures required by several applications.
• Some of the most common types of cryogenic valves are butterfly valves, relief valves, ball valves and solenoid valves. The users can manually operate or automate cryogenic valves to handle large systems.
• Liquefied gases, such as liquid nitrogen and liquid helium, are used in many cryogenic valve applications. Liquid nitrogen is the most commonly used element in cryogenics and is purchasable around the world.
Market Dynamics:
Factors Influencing the Market Growth:
• Surge in LNG trade and growing demand for industrial gases are the major key factors boosting the cryogenic valve market growth.
• Increased demand for industrial gases.
• Rise in demand for more Fpso and Fsru.
Factors Restraining the Market Growth:
• High cost
• Unstable metal prices
Market Segmentation 2019-2029:
Gas
• LNG Market, 2019-2029
• Oxygen Market, 2019-2029
• Nitrogen Market, 2019-2029
Application
• Tanks & Cold Boxes Market, 2019-2029
• Transfer Lines Market, 2019-2029
• Manifolds & Gas Trains Market, 2019-2029
Type
• Globe Market
• Gate Market
• Ball Market
End User
• Tanks & Cold Boxes Market, 2019-2029
• Transfer Lines Market, 2019-2029
• Chemicals Market, 2019-2029
Geographic breakdown
Focused regional forecasts and analysis explore the future opportunities:
• North America Market, 2019-2029
• Europe Market, 2019-2029
• Asia-Pacific Market, 2019-2029
• Middle East and Africa Market, 2019-2029
Competitive Analysis:
• Being a new technology, there are very few companies operating in the Cryogenic Valve market. However, number of players are entering in this arena by developing more standardized and cost effective Gas.
• Companies are strategically expanding their global presence and offering improved Cryogenic Valve technology across various sectors.
Major Market Players:
• BAC., Bray, Cryocomp, Emerson, Flowserve, Habonim, Herose., L&T., Parker, and Powell Valvesis also provided in this report.
Visiongain is a trading partner with the US Federal Government
CCR Ref number: KD4R6
Do you have any custom requirements we can help you with? Any need for specific country, geo region, market segment or specific company information? Contact us today, we can discuss your needs and see how we can help: sara.peerun@visiongain.com
1 Report Overview
1.1 Global Cryogenic Valve Market Overview
1.2 Global Cryogenic Valve Market Segmentation
1.3 Why You Should Read This Report
1.4 How This Report Delivers
1.5 Key Questions Answered by This Analytical Report Include:
1.6 Who is This Report For?
1.7 Methodology
1.7.1 Secondary Research
1.7.2 Market Evaluation & Forecasting Methodology
1.8 Frequently Asked Questions (FAQ)
1.9 Associated Visiongain Reports
1.10 About Visiongain
2 Introduction to the Cryogenic Valve Market
2.1 Cryogenic Valve Market Definition
2.2 Classification of Cryogenic Valve
3 Global Cryogenic Valve Market 2020-2030
3.1 Global Cryogenic Valve Market Forecast 2020-2030
3.2 Global Cryogenic Valve Market Drivers & Restraints
3.2.1 Rising Trade for LNG
3.2.2 High Demand for Industrial Gases
3.2.3 Increasing Number of FPSO and FSRU
3.2.4 Volatile Metal Prices Increase the Production Cost
4 Global Cryogenic Valve Market Forecast by Gas 2020-2030
4.1 Global Cryogenic Valve Market for Oxygen Submarket Forecast 2020-2030
4.2 Global Cryogenic Valve Market for LNG Submarket Forecast 2020-2030
4.3 Global Cryogenic Valve Market for Nitrogen Submarket Forecast 2020-2030
4.4 Global Cryogenic Valve Market for Hydrogen Submarket Forecast 2020-2030
4.5 Global Cryogenic Valve Market for Helium Submarket Forecast 2020-2030
4.6 Global Cryogenic Valve Market for Other Gases Submarket Forecast 2020-2030
5 Global Cryogenic Valve Market Forecast by Type 2020-2030
5.1 Global Cryogenic Valve Market For Gate Valve Submarket Forecast 2020-2030
5.2 Global Cryogenic Valve Market For Globe Valve Submarket Forecast 2020-2030
5.3 Global Cryogenic Valve Market For Ball Valve Submarket Forecast 2020-2030
5.4 Global Cryogenic Valve Market For Shut off Valve Submarket Forecast 2020-2030
5.5 Global Cryogenic Valve Market For Butterfly Valve Submarket Forecast 2020-2030
5.6 Global Cryogenic Valve Market For Other Valve Submarket Forecast 2020-2030
6 Global Cryogenic Valve Market Forecast by End User 2020-2030
6.1 Global Cryogenic Valve Energy & Power Submarket Forecast 2020-2030
6.2 Global Cryogenic Valve Market For Chemical Submarket Forecast 2020-2030
6.3 Global Cryogenic Valve Market For Food & Beverage Submarket Forecast 2020-2030
6.4 Global Cryogenic Valve Market For Healthcare Submarket Forecast 2020-2030
6.5 Global Cryogenic Valve Market For Other Submarket Forecast 2020-2030
7 Global Cryogenic Valve Market Forecast by Application 2020-2030
7.1 Global Cryogenic Valve Tanks & Cold Boxes Submarket Forecast 2020-2030
7.2 Global Cryogenic Valve Market For Transfer Lines Submarket Forecast 2020-2030
7.3 Global Cryogenic Valve Market For Manifolds & Gas Trains Submarket Forecast 2020-2030
8 Global Cryogenic Valve Market Forecast by Material 2020-2030
8.1 Global Cryogenic Valve Brass/Bronze Submarket Forecast 2020-2030
8.2 Global Cryogenic Valve Market For Stainless Steel Submarket Forecast 2020-2030
8.3 Global Cryogenic Valve Market For Carbon Steel Submarket Forecast 2020-2030
8.4 Global Cryogenic Valve Market For Others Submarket Forecast 2020-2030
9 Leading Regional Cryogenic Valve Markets Forecast 2020-2030
9.1 North America Cryogenic Valve Market Forecast 2020-2030
9.1.1 North America Cryogenic Valve Market, By Country 2020-2030
9.2 Europe Cryogenic Valve Market Forecast 2020-2030
9.2.1 Europe Cryogenic Valve Market, By Country 2020-2030
9.3 Asia Pacific Cryogenic Valve Market Forecast 2020-2030
9.3.1 Asia-Pacific Cryogenic Valve Market, By Country 2020-2030
9.4 Middle East and Africa Cryogenic Valve Market Forecast 2020-2030
9.4.1 Middle East and Africa Cryogenic Valve Market, By Country 2020-2030
9.5 Latin America Cryogenic Valve Market Forecast 2020-2030
9.5.1 Latin America Cryogenic Valve Market, By Country 2020-2030
10 SWOT Analysis of the Cryogenic Valve Market 2020-2030
11 Company Profiles
11.1 Cryogenic Valve Companies 2019
11.2 BAC Valves SA
11.2.1 BAC Valves SA Overview
11.2.2 BAC Valves SA Product Offering
11.3 Bray International Inc.
11.3.1 Bray International Inc. Overview
11.3.2 Bray International Inc. Product Offering
11.4 Flowserve Corporation
11.4.1 Flowserve Corporation Overview
11.4.2 Flowserve Corporation Product Offering
11.4.3 Flowserve Corporation Sales 2014-2018
11.4.4 Flowserve Corporation Net Income 2014-2018
11.4.5 Flowserve Corporation Key Development
11.5 Habonim Industrial Valves & Actuators
11.5.1 Habonim Industrial Valves & Actuators Overview and Key Development
11.5.2 Habonim Industrial Valves & Actuators Product Offering
11.6 Cryocomp Inc.
11.6.1 Cryocomp Inc. Overview
11.6.2 Cryocomp Inc. Product Offering
11.7 Emerson
11.7.1 Emerson Overview
11.7.2 Emerson Total Company Sales 2015-2018
11.7.3 Emerson Total Company Net Income 2015-2018
11.7.4 Emerson Product Offering
11.7.5 Emerson Key Developments
11.8 Packers Plus Energy Services
11.8.1 Packers Plus Energy Services Overview
11.8.2 Packers Plus Energy Services Product Offering
11.8.3 Packers Plus Energy Services Key Developments
11.9 Herose GMBH
11.9.1 Herose GMBH Overview
11.9.2 Herose GMBH Product Offering
11.10 Omega Well Intervention Ltd.
11.10.1 Omega Well Intervention Ltd. Overview
11.10.2 Omega Well Intervention Ltd. Product Offering
11.10.3 Omega Well Intervention Ltd. Key Developments
11.11 Larsen & Toubro Ltd
11.11.1 Larsen & Toubro Ltd Overview
11.11.2 Larsen & Toubro Ltd Product Offering
11.11.3 Larsen & Toubro Ltd Sales 2015-2019
11.11.4 Larsen & Toubro Ltd Net Income 2015-2019
11.11.5 Larsen & Toubro Ltd Key Development
11.12 Other Notable Companies in the Cryogenic Valve Market Value Chain
12 Porter’s Five Forces Analysis
12.1.1 Bargaining Power of Suppliers
12.1.2 Bargaining Power of Buyers
12.1.3 Threat of Substitutes
12.1.4 Threat of New Entrants
12.1.5 Intensity of Competition Rivalry
13 Conclusions
14 Glossary
Associated Visiongain Reports
Visiongain Report Sales Order Form
Appendix A
About Visiongain
Appendix B
Visiongain report evaluation form
List of Tables
Table 2.1 Cryogenic Gases and Their Properties
Table 2.2 Cryogenic Valve Material Type Utilized By Manufacturers
Table 3.1 Global Cryogenic Valve Market Forecast 2020-2030 (US$m, AGR %, CAGR %, Cumulative)
Table 4.1 Global Cryogenic Valve Market Forecast By Gas 2020-2030 (US$m, AGR %, Cumulative)
Table 4.2: Liquid Oxygen Physical and Chemical Properties
Table 4.3 Global Cryogenic Valve Market for Oxygen Submarket by Region Forecast 2020-2030 (US$m, AGR %, CAGR %, Cumulative)
Table 4.4 Global Cryogenic Valve Market For LNG Submarket by Region Forecast 2020-2030 (US$m, AGR %, CAGR %, Cumulative)
Table 4.5 Global Cryogenic Valve Market For Nitrogen Submarket by Region Forecast 2020-2030 (US$m, AGR %, CAGR %, Cumulative)
Table 4.6 Global Cryogenic Valve Market For Hydrogen Submarket by Region Forecast 2020-2030 (US$m, AGR %, CAGR %, Cumulative)
Table 4.7 Helium – Properties and Applications
Table 4.8 Global Cryogenic Valve Market for Helium Submarket by Region Forecast 2020-2030 (US$m, AGR %, CAGR %, Cumulative)
Table 4.9 Global Cryogenic Valve Market for Other Gases Submarket by Region Forecast 2020-2030 (US$m, AGR %, CAGR %, Cumulative)
Table 5.1 Global Cryogenic Valve Market Forecast By Type 2020-2030 (US$m, AGR %, Cumulative)
Table 5.2 Global Cryogenic Valve Market For Gate Valve by Region Forecast 2020-2030 (US$m, AGR %, Cumulative)
Table 5.3 Global Cryogenic Valve Market For Globe Valve Submarket by Region Forecast 2020-2030 (US$m, AGR %, CAGR %, Cumulative)
Table 5.4 Global Cryogenic Valve Market For Ball Valve Submarket by Region Forecast 2020-2030 (US$m, AGR %, CAGR %, Cumulative)
Table 5.5 Global Cryogenic Valve Market For Shut off Valve Submarket by Region Forecast 2020-2030 (US$m, AGR %, CAGR %, Cumulative)
Table 5.6 Global Cryogenic Valve Market For Butterfly Valve Submarket by Region Forecast 2020-2030 (US$m, AGR %, CAGR %, Cumulative)
Table 5.7 Global Cryogenic Valve Market For Other Valve Submarket by Region Forecast 2020-2030 (US$m, AGR %, CAGR %, Cumulative)
Table 6.1 Global Cryogenic Valve Market Forecast By End User 2020-2030 (US$m, AGR %, Cumulative)
Table 6.2 Global Cryogenic Valve Market For Energy & Power Submarket by Region Forecast 2020-2030 (US$m, AGR %, CAGR %, Cumulative)
Table 6.3 Global Cryogenic Valve Market For Chemical Submarket by Region Forecast 2020-2030 (US$m, AGR %, CAGR %, Cumulative)
Table 6.4 Global Cryogenic Valve Market For Food & Beverage & Submarket by Region Forecast 2020-2030 (US$m, AGR %, CAGR %, Cumulative)
Table 6.5 Global Cryogenic Valve Market For Healthcare Submarket by Region Forecast 2020-2030 (US$m, AGR %, CAGR %, Cumulative)
Table 6.6 Global Cryogenic Valve Market For Other & Submarket by Region Forecast 2020-2030 (US$m, AGR %, CAGR %, Cumulative)
Table7.1 Global Cryogenic Valve Market Forecast By Application 2020-2030 (US$m, AGR, Cumulative)
Table 7.2 Global Cryogenic Valve Market For Tanks & Cold Boxes Submarket by Region Forecast 2020-2030 (US$m, AGR %, CAGR %, Cumulative)
Table 7.3 Global Cryogenic Valve Market For Transfer Lines Submarket by Region Forecast 2020-2030 (US$m, AGR %, CAGR %, Cumulative)
Table 7.4 Global Cryogenic Valve Market For Manifolds & Gas Trains Submarket by Region Forecast 2020-2030 (US$m, AGR %, CAGR %, Cumulative)
Table 8.1 Global Cryogenic Valve Market Forecast By Material 2020-2030 (US$m, AGR %, Cumulative)
Table 8.2 Global Cryogenic Valve Market For Brass/Bronze Submarket by Region Forecast 2020-2030 (US$m, AGR %, CAGR %, Cumulative)
Table 8.3 Global Cryogenic Valve Market For Stainless Steel Submarket by Region Forecast 2020-2030 (US$m, AGR %, CAGR %, Cumulative)
Table 8.4 Global Cryogenic Valve Market For Carbon Steel Submarket by Region Forecast 2020-2030 (US$m, AGR %, CAGR %, Cumulative)
Table 8.5 Global Cryogenic Valve Market For Others Submarket by Region Forecast 2020-2030 (US$m, AGR %, CAGR %, Cumulative)
Table 9.1 Leading Regional Cryogenic Valve Market Forecast 2020-2030 (US$m, Global AGR %, Cumulative)
Table 9.2 North America Cryogenic Valve Market by Gas Forecast 2020-2030 (US$m, AGR %, CAGR %, Cumulative)
Table 9.3 North America Cryogenic Valve Market by Type Forecast 2020-2030 (US$m, AGR %, CAGR %, Cumulative)
Table 9.4 North America Cryogenic Valve Market by End User Forecast 2020-2030 (US$m, AGR %, CAGR %, Cumulative)
Table 9.5 North America Cryogenic Valve Market by Application Forecast 2020-2030 (US$m, AGR %, CAGR %, Cumulative)
Table 9.6 North America Cryogenic Valve Market by Material Forecast 2020-2030 (US$m, AGR %, CAGR %, Cumulative)
Table 9.7 North America Cryogenic Valve Market by Country Forecast 2020-2030 (US$m, AGR %, Cumulative)
Table 9.8 Europe Cryogenic Valve Market by Gas Forecast 2020-2030 (US$m, AGR %, CAGR %, Cumulative)
Table 9.9 Europe Cryogenic Valve Market by Type Forecast 2020-2030 (US$m, AGR %, CAGR %, Cumulative)
Table 9.10 Europe Cryogenic Valve Market by End User Forecast 2020-2030 (US$m, AGR %, CAGR %, Cumulative)
Table 9.11 Europe Cryogenic Valve Market by Application Forecast 2020-2030 (US$m, AGR %, CAGR %, Cumulative)
Table 9.12 Europe Cryogenic Valve Market by Material Forecast 2020-2030 (US$m, AGR %, CAGR %, Cumulative)
Table 9.13 Europe Cryogenic Valve Market by Country Forecast 2020-2030 (US$m, AGR %, Cumulative)
Table 9.14 Asia Pacific Cryogenic Valve Market by Gas Forecast 2020-2030 (US$m, AGR %, CAGR %, Cumulative)
Table 9.15 Asia Pacific Cryogenic Valve Market by Type Forecast 2020-2030 (US$m, AGR %, CAGR %, Cumulative)
Table 9.16 Asia Pacific Cryogenic Valve Market by End User Forecast 2020-2030 (US$m, AGR %, CAGR %, Cumulative)
Table 9.17 Asia Pacific Cryogenic Valve Market by Application Forecast 2020-2030 (US$m, AGR %, CAGR %, Cumulative)
Table 9.18 Asia Pacific Cryogenic Valve Market by Material Forecast 2020-2030 (US$m, AGR %, CAGR %, Cumulative)
Table 9.19 Asia-Pacific Cryogenic Valve Market by Country Forecast 2020-2030 (US$m, AGR %, Cumulative)
Table 9.20 Middle East and Africa Cryogenic Valve Market by Gas Forecast 2020-2030 (US$m, AGR %, CAGR %, Cumulative)
Table 9.21 Middle East and Africa Cryogenic Valve Market by Type Forecast 2020-2030 (US$m, AGR %, CAGR %, Cumulative)
Table 9.22 Middle East and Africa Cryogenic Valve Market by End User Forecast 2020-2030 (US$m, AGR %, CAGR %, Cumulative)
Table 9.23 Middle East and Africa Cryogenic Valve Market by Application Forecast 2020-2030 (US$m, AGR %, CAGR %, Cumulative)
Table 9.24 Middle East and Africa Cryogenic Valve Market by Material Forecast 2020-2030 (US$m, AGR %, CAGR %, Cumulative)
Table 9.25 Middle East and Africa Cryogenic Valve Market by Country Forecast 2020-2030 (US$m, AGR %, Cumulative)
Table 9.26 Latin America Cryogenic Valve Market by Gas Forecast 2020-2030 (US$m, AGR %, CAGR %, Cumulative)
Table 9.27 Latin America Cryogenic Valve Market by Type Forecast 2020-2030 (US$m, AGR %, CAGR %, Cumulative)
Table 9.28 Latin America Cryogenic Valve Market by End User Forecast 2020-2030 (US$m, AGR %, CAGR %, Cumulative)
Table 9.29 Latin America Cryogenic Valve Market by Application Forecast 2020-2030 (US$m, AGR %, CAGR %, Cumulative)
Table 9.30 Latin America Cryogenic Valve Market by Material Forecast 2020-2030 (US$m, AGR %, CAGR %, Cumulative)
Table 9.31 Latin America Cryogenic Valve Market by Country Forecast 2020-2030 (US$m, AGR %, Cumulative)
Table 10.1 Global Cryogenic Valve Market SWOT Analysis 2020-2030
Table 11.1 Cryogenic Valve Market Companies 2019
Table 11.2 BAC Valves SA Profile 2019 (CEO, Parent HQ, Founded, No. of Employees, Website)
Table 11.3 BAC Valves SA Product Offering
Table 11.4 BAC Valves SA Cryogenic Valves Specific Offering
Table 11.5 Bray International Inc. Profile 2019 (CEO, Parent HQ, Founded, No. of Employees, Website)
Table 11.6 Bray International Inc. Product Offering and Services
Table 11.7 Flowserve Corporation Profile 2019 (CEO, Parent HQ, Founded, No. of Employees, Website)
Table 11.8 Flowserve Corporation Product Portfolio
Table 11.9 Flowserve Corporation Sales 2014-2018 (US$m, AGR %)
Table 11.10 Flowserve Corporation Net Income 2014-2018 (US$m, AGR %)
Table 11.12 Habonim Industrial Valves & Actuators Profile 2019 (CEO, Parent HQ, Founded, No. of Employees, Website)
Table 11.13 Habonim Industrial Valves & Actuators Product Offering
Table 11.14 Cryocomp Inc. Profile 2019 (Parent HQ, Founded, Website)
Table 11.15 Cryocomp Inc. Product Offering
Table 11.16 Emerson Profile 2019 (CEO, Parent HQ, Founded, No. of Employees, Website)
Table 11.17 Emerson Total Company Sales 2015-2018 (US$m, AGR %)
Table 11.18 Emerson Total Company Net Income 2015-2018 (US$m)
Table 11.19 Emerson Product Offering
Table 11.20 Packers Plus Energy Services Profile 2019 (CEO, HQ, Founded, No. of Employees, Website)
Table 11.21 Packers Plus Energy Services Product Offering
Table 11.22 Herose GMBH Profile 2019 (CEO, Parent HQ, Founded, No. of Employees, Website)
Table 11.23 Herose GMBH Product Offering
Table 11.24 Omega Well Intervention Ltd. Profile 2019 (CEO, Parent HQ, Founded, No. of Employees, Website)
Table 11.25 Omega Well Intervention Ltd. Product Offering
Table 11.26 Larsen & Toubro Ltd Profile 2019 (CEO, Parent HQ, Founded, No. of Employees, Website)
Table 11.27 Larsen & Tourbo Ltd. Product Offering
Table 11.28 Larsen & Toubro Ltd Sales 2015-2019 (US$m, AGR %)
Table 11.29 Larsen & Toubro Ltd Net Income 2015-2019 (US$m)
Table 11.30 Other Notable Companies in the Cryogenic Valve Market Value Chain
List of Figures
Figure 1.1 Global Cryogenic Valve Market Segmentation Overview
Figure 3.1 Global Cryogenic Valve Market Forecast 2020-2030 (US$m, AGR %)
Figure 4.1 Global Cryogenic Valve Market Forecast By Gas 2020-2030 (US$m, Global AGR %)
Figure 4.2 Global Cryogenic Valve Market Share By Gas 2020, 2025, 2030 (% Share)
Figure 4.3 Global Cryogenic Valve Market for Oxygen Submarket by Region Forecast 2020-2030 (US$m, Global AGR %)
Figure 4.4 Global Cryogenic Valve Market for Nitrogen Submarket by Region Forecast 2020-2030 (US$m, Global AGR %)
Figure 4.5 Global Cryogenic Valve Market for Helium Submarket by Region Forecast 2020-2030 (US$m, Global AGR %)
Figure 5.1 Global Cryogenic Valve Market Forecast By Type 2020-2030 (US$m, Global AGR %)
Figure 5.2 Global Cryogenic Valve Market Share By Type 2020, 2025, 2030 (% Share)
Figure 5.3 Global Cryogenic Valve Market For Gate Valve Submarket by Region Forecast 2020-2030 (US$m, Global AGR %)
Figure 5.4 Global Cryogenic Valve Market For Globe Valve Submarket by Region Forecast 2020-2030 (US$m, Global AGR %)
Figure 5.5 Global Cryogenic Valve Market For Ball Valve Submarket by Region Forecast 2020-2030 (US$m, Global AGR %)
Figure 5.6 Global Cryogenic Valve Market For Shut off Valve Submarket by Region Forecast 2020-2030 (US$m, Global AGR %)
Figure 5.7 Global Cryogenic Valve Market For Butterfly Valve Submarket by Region Forecast 2020-2030 (US$m, Global AGR %)
Figure 5.8 Global Cryogenic Valve Market For Other Valve Submarket by Region Forecast 2020-2030 (US$m, Global AGR %)
Figure 6.1 Global Cryogenic Valve Market Forecast By End User 2020-2030 (US$m, Global AGR %)
Figure 6.2 Global Cryogenic Valve Market Share By End User 2020, 2025, 2030 (% Share)
Figure 6.3 Global Cryogenic Valve Market For Energy & Power Submarket by Region Forecast 2020-2030 (US$m, Global AGR %)
Figure 6.4 Global Cryogenic Valve Market For Chemical Submarket by Region Forecast 2020-2030 (US$m, Global AGR %)
Figure 6.5 Global Cryogenic Valve Market For Food & Beverage Submarket by Region Forecast 2020-2030 (US$m, Global AGR %)
Figure 6.6 Global Cryogenic Valve Market For Healthcare Submarket by Region Forecast 2020-2030 (US$m, Global AGR %)
Figure 7.1 Global Cryogenic Valve Market Forecast By Application 2020-2030 (US$m, Global AGR %)
Figure 7.2 Global Cryogenic Valve Market Share By Application 2020, 2025, 2030 (% Share)
Figure 7.3 Global Cryogenic Valve Market For Tanks & Cold Boxes Submarket by Region Forecast 2020-2030 (US$m, Global AGR %)
Figure 7.4 Global Cryogenic Valve Market For Transfer Lines Submarket by Region Forecast 2020-2030 (US$m, Global AGR %)
Figure 7.5 Global Cryogenic Valve Market For Manifolds & Gas Trains Submarket by Region Forecast 2020-2030 (US$m, Global AGR %)
Figure 8.1 Global Cryogenic Valve Market Forecast By Material 2020-2030 (US$m, Global AGR %)
Figure 8.2 Global Cryogenic Valve Market Share By Material 2020, 2025, 2030 (% Share)
Figure 8.3 Global Cryogenic Valve Market For Brass/Bronze Submarket by Region Forecast 2020-2030 (US$m, Global AGR %)
Figure 8.4 Global Cryogenic Valve Market For Stainless Steel Submarket by Region Forecast 2020-2030 (US$m, Global AGR %)
Figure 8.5 Global Cryogenic Valve Market For Carbon Steel Submarket by Region Forecast 2020-2030 (US$m, Global AGR %)
Figure 8.6 Global Cryogenic Valve Market For Others Submarket by Region Forecast 2020-2030 (US$m, Global AGR %)
Figure 9.1 Leading Regional Cryogenic Valve Markets Forecast 2020-2030 (US$m, Global AGR %)
Figure 9.2 Leading Regional Cryogenic Valve Market Share Forecast 2020, 2025, 2030 (% Share)
Figure 9.3 North America Cryogenic Valve Market By Gas Forecast 2020-2030 (US$m, Total North America Market Sales AGR %)
Figure 9.4 North America Cryogenic Valve Market By Gas Forecast 2020, 2025, 2030 (% Share)
Figure 9.5 North America Cryogenic Valve Market By Type Forecast 2020-2030 (US$m, Total Market Sales AGR %)
Figure 9.6 North America Cryogenic Valve Market By Type Forecast 2020, 2025, 2030 (% Share)
Figure 9.7 North America Cryogenic Valve Market By End User Forecast 2020-2030 (US$m, Total Market Sales AGR %)
Figure 9.8 North America Cryogenic Valve Market By End User Forecast 2020, 2025, 2030 (% Share)
Figure 9.9 North America Cryogenic Valve Market By Application Forecast 2020-2030 (US$m, Total Market Sales AGR %)
Figure 9.10 North America Cryogenic Valve Market By Application Forecast 2020, 2025, 2030 (% Share)
Figure 9.11 North America Cryogenic Valve Market By Material Forecast 2020-2030 (US$m, Total Market Sales AGR %)
Figure 9.12 North America Cryogenic Valve Market By Material Forecast 2020, 2025, 2030 (% Share)
Figure 9.13 North America Cryogenic Valve Market by Country Forecast 2020-2030 (US$m, North America AGR %)
Figure 9.14 North America Cryogenic Valve Market by Country Market Share Forecast 2020, 2025, 2030 (% Share)
Figure 9.15 Europe Cryogenic Valve Market By Gas Forecast 2020-2030 (US$m, Total Market Sales AGR %)
Figure 9.16 Europe Cryogenic Valve Market By Gas Forecast 2020, 2025, 2030 (% Share)
Figure 9.17 Europe Cryogenic Valve Market By Type Forecast 2020-2030 (US$m, Total Market Sales AGR %)
Figure 9.18 Europe Cryogenic Valve Market By Type Forecast 2020, 2025, 2030 (% Share)
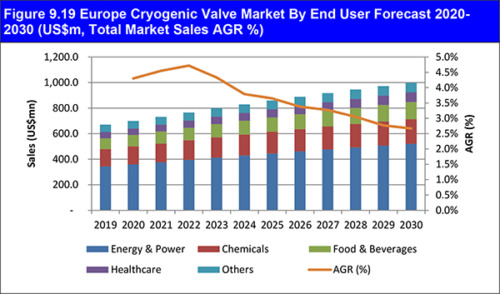
Figure 9.19 Europe Cryogenic Valve Market By End User Forecast 2020-2030 (US$m, Total Market Sales AGR %)
Figure 9.20 Europe Cryogenic Valve Market By End User Forecast 2020, 2025, 2030 (% Share)
Figure 9.21 Europe Cryogenic Valve Market By Application Forecast 2020-2030 (US$m, Total Market Sales AGR %)
Figure 9.22 Europe Cryogenic Valve Market By Application Forecast 2020, 2025, 2030 (% Share)
Figure 9.23 Europe Cryogenic Valve Market By Material Forecast 2020-2030 (US$m, Total Market Sales AGR %)
Figure 9.24 Europe Cryogenic Valve Market By Material Forecast 2020, 2025, 2030 (% Share)
Figure 9.25 Europe Cryogenic Valve Market by Country Forecast 2020-2030 (US$m, Europe AGR %)
Figure 9.26 Europe Cryogenic Valve Market by Country Market Share Forecast 2020, 2025, 2030 (% Share)
Figure 9.27 Asia Pacific Cryogenic Valve Market By Gas Forecast 2020-2030 (US$m, Total Market Sales AGR %)
Figure 9.28 Asia Pacific Cryogenic Valve Market By Gas Forecast 2020, 2025, 2030 (% Share)
Figure 9.29 Asia Pacific Cryogenic Valve Market By Type Forecast 2020-2030 (US$m, Total Market Sales AGR %)
Figure 9.30 Asia Pacific Cryogenic Valve Market By Type Forecast 2020, 2025, 2030 (% Share)
Figure 9.31 Asia Pacific Cryogenic Valve Market By End User Forecast 2020-2030 (US$m, Total Market Sales AGR %)
Figure 9.32 Asia Pacific Cryogenic Valve Market By End User Forecast 2020, 2025, 2030 (% Share)
Figure 9.33 Asia Pacific Cryogenic Valve Market By Application Forecast 2020-2030 (US$m, Total Market Sales AGR %)
Figure 9.34 Asia Pacific Cryogenic Valve Market By Application Forecast 2020, 2025, 2030 (% Share)
Figure 9.35 Asia Pacific Cryogenic Valve Market By Material Forecast 2020-2030 (US$m, Total Market Sales AGR %)
Figure 9.36 Asia Pacific Cryogenic Valve Market By Material Forecast 2020, 2025, 2030 (% Share)
Figure 9.37 Asia-Pacific Cryogenic Valve Market by Country Forecast 2020-2030 (US$m, Asia-Pacific AGR %)
Figure 9.38 Asia-Pacific Cryogenic Valve Market by Country Market Share Forecast 2020, 2025, 2030 (% Share)
Figure 9.39 Middle East and Africa Cryogenic Valve Market By Gas Forecast 2020-2030 (US$m, Total Market Sales AGR %)
Figure 9.40 Middle East and Africa Cryogenic Valve Market By Gas Forecast 2020, 2025, 2030 (% Share)
Figure 9.41 Middle East and Africa Cryogenic Valve Market By Type Forecast 2020-2030 (US$m, Total Market Sales AGR %)
Figure 9.42 Middle East and Africa Cryogenic Valve Market By Type Forecast 2020, 2025, 2030 (% Share)
Figure 9.43 Middle East and Africa Cryogenic Valve Market By End User Forecast 2020-2030 (US$m, Total Market Sales AGR %)
Figure 9.44 Middle East and Africa Cryogenic Valve Market By End User Forecast 2020, 2025, 2030 (% Share)
Figure 9.45 Middle East and Africa Cryogenic Valve Market By Application Forecast 2020-2030 (US$m, Total Market Sales AGR %)
Figure 9.46 Middle East and Africa Cryogenic Valve Market By Application Forecast 2020, 2025, 2030 (% Share)
Figure 9.47 Middle East and Africa Cryogenic Valve Market By Material Forecast 2020-2030 (US$m, Total Market Sales AGR %)
Figure 9.48 Middle East and Africa Cryogenic Valve Market By Material Forecast 2020, 2025, 2030 (% Share)
Figure 9.49 Middle East and Africa Cryogenic Valve Market by Country Forecast 2020-2030 (US$m, Middle East and Africa AGR %)
Figure 9.50 Middle East and Africa Cryogenic Valve Market By Country Forecast 2020, 2025, 2030 (% Share)
Figure 9.51 Latin America Cryogenic Valve Market By Gas Forecast 2020-2030 (US$m, Total Market Sales AGR %)
Figure 9.52 Latin America Cryogenic Valve Market By Gas Forecast 2020, 2025, 2030 (% Share)
Figure 9.53 Latin America Cryogenic Valve Market By Type Forecast 2020-2030 (US$m, Total Market Sales AGR %)
Figure 9.54 Latin America Cryogenic Valve Market By Type Forecast 2020, 2025, 2030 (% Share)
Figure 9.55 Latin America Cryogenic Valve Market By End User Forecast 2020-2030 (US$m, Total Market Sales AGR %)
Figure 9.56 Latin America Cryogenic Valve Market By End User Forecast 2020, 2025, 2030 (% Share)
Figure 9.57 Latin America Cryogenic Valve Market By Application Forecast 2020-2030 (US$m, Total Market Sales AGR %)
Figure 9.58 Latin America Cryogenic Valve Market By Application Forecast 2020, 2025, 2030 (% Share)
Figure 9.59 Latin America Cryogenic Valve Market By Material Forecast 2020-2030 (US$m, Total Market Sales AGR %)
Figure 9.60 Latin America Cryogenic Valve Market By Material Forecast 2020, 2025, 2030 (% Share)
Figure 9.61 Latin America Cryogenic Valve Market by Country Forecast 2020-2030 (US$m, Latin America AGR %)
Figure 9.62 Latin America Cryogenic Valve Market By Country Forecast 2020, 2025, 2030 (% Share)
Figure 11.1 Flowserve Corporation Sales 2014-2018 (US$m, AGR %)
Figure 11.2 Flowserve Corporation Net Income 2014-2018 (US$m)
Figure 11.3 Emerson Total Company Sales 2015-2018 (US$m, AGR %)
Figure 11.4 Emerson Total Company Net Income 2015-2018 (US$m)
Figure 11.5 Larsen & Toubro Ltd Sales 2015-2019 (US$m, AGR %)
Figure 11.6 Larsen & Toubro Ltd Net Income 2015-2019 (US$m)
Danyang Feilun Gas Valve Co Ltd
Didtek Valve Co., Ltd (Wenzhou)
Foshan Jianda Valve Pump Co, Ltd
Guangdong South China Special Gas Institute Co Ltd
Hangzhou Darhor Technology Co. Ltd
Jiangsu Cunrui Metal Products Co Ltd
Keyu Valve Co., Ltd
Leyon International Trading (Shanghai) Co Ltd
Qingdao I-Flow Co., Ltd
Schlumberger
Shanghai KS Flow Control Equipment Co Ltd
Shenyang Taike Fluid Control Co Ltd
Sichuan Liangchuan Mechanical Equipmant Co Ltd
Sichuan Mayflower Precision Machinery Co Ltd
Suzhou Octoparts Nano Technology Co Ltd
Tianjin Bell Automatic Instrument Technology Co Ltd
Tianjin Tanggu Valve Co., Ltd.
Valv
Velan
Wenzhou Sfan Valve Co., Ltd
Wenzhou Tipvalve Manufacturing Co Ltd
Wuhan Garlos Imp And Exp Co Ltd
Wuxi Zhengcheng Valve Factory
Zhejiang Boyuan Valve Co., Ltd.
Zhejiang Shunshui Valve Co, Ltd