This latest report by business intelligence provider Visiongain assesses that Crude Oil Desalter Market spending will reach $2.87 billion by 2020 and grow from 2020 to 2030 at a CAGR of 8.9 percent. Desalting is a water-washing operation initially carried out in the field of production and subsequently at the refinery site for additional crude oil cleaning, where the specifications for salt and water content are even more rigid due to their negative effect in downstream processes due to the formation of scales, corrosion and deactivation of catalysts. Desalting involves mixing heated crude oil with washing water, using a mixing valve or static mixers to ensure a proper contact between the crude oil and the water, and then passing it to a separating vessel, where a proper separation between the aqueous and organic phases is achieved.
Petroleum retrieved from the reservoir is combined with a multitude of materials that involve other minerals, such as methane, water, chloride salts, and dust. Thus, petroleum processing actually begins shortly after reservoir fluid production, where pre-treatment operations are applied to pre-transportation crude oil. Any crude oil to be shipped through a pipeline or through any other form of transport must comply with strict water and salt content regulations. Desalting is a water-washing procedure originally carried out in the sector of manufacturing and subsequently at the refinery facility for further cleaning of crude oil, Where the specifications of salt and water content are even more rigid due to their negative effect in downstream processes due to deactivation of the scale, corrosion and catalyst. Desalting involves mixing heated crude oil with washing water, using a mixing valve or static mixers to ensure proper contact between crude oil and water, and then transferring it to a separating vessel where proper separation is achieved between the aqueous and organic phases.
Crude oil usually contains inorganic chloride salts that can react to organic chloride forming with the oil. Both organic and inorganic chlorine compounds can cause substantial refining installation corrosion, pipelines, and tanks, and can lead to poisoning catalyst. Desalting is therefore one of the first separation processes at a refinery’s front edge. Desalting removes most of the salts by adding water, dissolving the salts and other water-soluble impurities from the feedstock of crude oil. Then the blend is divided; the water comes to an industrial wastewater treatment plant and the desalted crude oil is processed into different products.
It is therefore critical that you have your timescales correct and your forecasting plans ready. This report will ensure that you do. Visiongain’s report will ensure that you keep informed and ahead of your competitors. Gain that competitive advantage.
Increasing investment for upgradation and expansion of refineries will positively encourage the crude oil desalter and electrostatic dehydrator market size
Increasing investment to upgrade and expand refineries primarily in China and India will encourage the market size of crude oil desalterers and electrostatic dehydrators. The Joint Commission for China-Venezuela is planning to expand the refinery in Puerto La Cruz. This alliance will increase the refinery’s capacity from 129,000 barrels of oil per day to 210,000 barrels. The falling rates of crude oil due to greater profit margins for refinery will further boost the magnitude of the sector.
Increasing demand for desalter and dehydrator equipment
Increasing demand for desalter and dehydrator equipment to reduce the content of salt and water across the upstream and downstream sectors will stimulate market share of crude oil desalter and electrostatic dehydrator. Calcium chloride, sodium chloride and magnesium chlorides are the most common salts found in crude oil. Salt in the crude oil poisons the catalysts for handling and promotes corrosion.
Increasing demand for fluid catalytic cracker unit will increase demand for crude oil desalter and electrostatic dehydrator
Increasing requirement for a fluid catalytic cracker device to break larger molecules into heavier ones and turn them into more useful products will further boost market share of crude oil desalter and electrostatic dehydrator. Due to its increasing petrochemical capacity, Reliance imported about 60,000 to 90,000 tons of heavy full-range naphtha to meet the demand and supply gap. In the forecast time frame, volatile crude oil prices can hamper the market share of crude oil desalterers and electrostatic dehydrators.
The global oil desalting systems plays a vital role for the oil & gas sector
Global oil desalination technologies play a crucial part for the oil & petrol industry and it is anticipated that increased development in refineries will achieve momentum in the close future between the prediction era. There are several drivers that can lift up the market for oil desalination systems in the near future, such as the emergence of petroleum refineries in several regions, and market growth is expected to be boosted by in-house production units. It is also expected that the increasing importance of fluid catalytic units will have a positive impact on the growth of the market for oil desalination systems. However, declining imports of crude oil from European region is expected to create challenge for oil desalting systems market in the near future.
Heavy Crude Desalting Systems Segment Is Estimated To Dominate The Market
Based on application, it is estimated that the segment of heavy crude desalting systems accounts for more than one third of market share in terms of volume and value. The market for oil desalination systems in Asia Pacific is expected to fuel demand in the future with relatively significant growth in the same period in terms of regional perspective. In Asia Pacific, the market for oil desalination systems is expected to account for more than one-third of the market volume and value share and is also expected to expand in the near future at a significant CAGR.
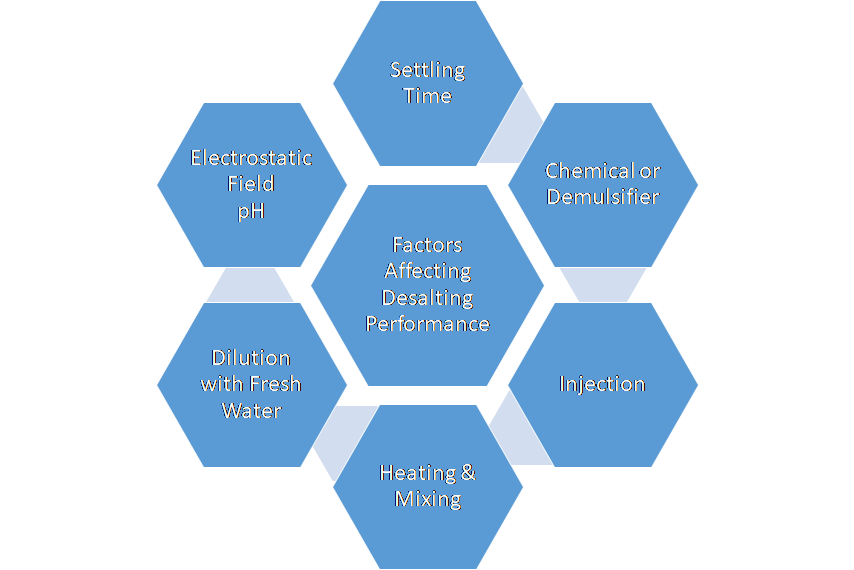
Figure:- Factors Affecting Desalting Performance
Read on to discover how you can exploit the future business opportunities emerging in this sector. Visiongain’s new study tells you and tells you NOW. The 220-pages report provides clear, detailed insight into the global Crude Oil Desalter market. Discover the key drivers and challenges affecting the market.
By ordering and reading our brand-new report today, you stay better informed and ready to act.
Report Scope
The report delivers considerable added value by revealing:
77 tables, charts and graphs are analyzing and revealing the growth prospects and outlook for the Crude Oil Desalter market.
Global Crude Oil Desalter market forecasts and analysis from 2020-2030.
Crude Oil Desalter market provides revenue estimates, forecasts and analysis from 2020-2030 for Crude Oil Desalter submarkets:
Forecasts and analysis of Crude Oil Desalter market by End-Use between 2020-2030
FCC Feed Desalting Market, 2020-2030
Heavy Crude Desalting Market, 2020-2030
Distillate Treating Market, 2020-2030
Other Market, 2020-2030
Forecasts and analysis of Crude Oil Desalter market by Application between 2020-2030
Upstream Market, 2020-2030
Downstream Market, 2020-2030
Other Application Market, 2020-2030
Forecasts and analysis of Crude Oil Desalter market by Technology between 2020-2030
Cameron’s Bilectric Technology Market, 2020-2030
NATCO’s Dual Polarity Technology Market, 2020-2030
Other Technology Market, 2020-2030
Regional Crude Oil Desalter market forecasts from 2020-2030 with drivers and restraints for the countries including:
Geographic Breakdown
Focused regional forecasts and analysis explore the future opportunities:
North America Market, 2020-2030
US Market, 2020-2030
Canada Market, 2020-2030
Europe Market, 2020-2030
The UK Market, 2020-2030
Germany Market, 2020-2030
France Market, 2020-2030
Italy Market, 2020-2030
Spain Market, 2020-2030
Rest of Europe Market, 2020-2030
Asia-Pacific Market, 2020-2030
China Market, 2020-2030
India Market, 2020-2030
Japan Market, 2020-2030
Australia & New Zealand Market, 2020-2030
Rest of Asia-Pacific Market, 2020-2030
LAMEA Market, 2020-2030
Latin America Market, 2020-2030
Middle East Market, 2020-2030
Africa Market, 2020-2030

Figure:- Crude Oil Desalter Market Size and Forecast by Region, 2020-2030
Asia Pacific Market to witness strong growth
Asia Pacific’s market share of crude oil desalter and electrostatic dehydrator is expected to see strong growth due to increased investment in expansion of refinery, mainly in China and India. In 2017, HPCL announced that it would spend USD 150,000 million to grow the Mumbai refinery to generate diesel and gasoline, fulfilling the requirements of Euro IV performance. Significant development is anticipated due to increased discovery and manufacturing of petroleum gas in North America’s natural petroleum desalter and electrostatic dehydrator industry.
Company profiles for the leading Crude Oil Desalter companies
Company Profiles of Leading Players
Forum Energy Technologies
Schlumberger
Croda International Plc
Mackenzie Hydrocarbons
Petro Techna
Fjords Processing
VME
CPE
ETI Process Group
Alfa Laval
Petro-Techna International, ICE (Asia) Pvt. Ltd
Other Key Players in the market
Canadian Petroleum Processing Equipment Inc.
Komax systems Inc.
En-Fab, Inc.
GasTech Engineering Corp
Agar Corporation Ltd.
Cameron International Corporation
PROSERNAT S.A
VME Process Inc.
Frames Group
Howe-Baker
MFS Co
Chemex Modular, LLC
Dorf Ketal Chemicals India Private Limited
Conclusions and recommendations which will aid decision-making
How will you benefit from this report?
Keep your knowledge base up to speed. Don’t get left behind
Reinforce your strategic decision-making with definitive and reliable market data
Learn how to exploit new technological trends
Realise your company’s full potential within the market
Understand the competitive landscape and identify potential new business opportunities & partnerships
Who should read this report?
Anyone with involvement in the Crude Oil Desalter
Energy operators
Engineering contractors
Investment managers
Arbitrage companies and divisions
Energy price reporting companies
Energy company managers
Energy consultants
Energy company executives and analysts
Heads of strategic development
Business development managers
Marketing managers
Market analysts,
Technologists
Suppliers
Investors
Banks
Government agencies
Visiongain’s study is intended for anyone requiring commercial analyses for the Crude Oil Desalter market and leading companies. You find data, trends and predictions.
Buy our report today the Crude Oil Desalter Market Forecast 2020-2030. Avoid missing out by staying informed – get our report now.
Visiongain is a trading partner with the US Federal Government
CCR Ref number: KD4R6
Do you have any custom requirements we can help you with? Any need for specific country, geo region, market segment or specific company information? Contact us today, we can discuss your needs and see how we can help sara.peerun@visiongain.com
Report Overview
1.1 Global Crude Oil Desalter Market
1.2 Global Crude Oil Desalter Market Overview
1.3 Global Crude Oil Desalter Market Segmentation
1.4 The Emergence of Crude Oil Desalter in the Industry
1.5 Why You Should Read This Report
1.6 How This Report Delivers
1.7 Key Questions Answered by This Analytical Report
1.8 Methodology
1.8.1 Secondary Research
1.8.2 Market Evaluation & Forecasting Methodology
1.9 Frequently Asked Questions (FAQ)
1.10 Associated Visiongain Reports
1.11 About Visiongain
2. Introduction to Crude Oil Desalter Market
2.1 Market Definition
2.2 Industry Outlook
2.3 Value Chain Analysis
2.4 Industry Structure
2.5 Current Status & Trends
2.6 Demand & Supply Analysis
2.7 Trade Analysis
2.8 Price Trend Analysis
2.9 Equipment Design Consideration
2.9.1 Parallel Wash Water Injection to Both Desalters
2.9.2 Counter-Current (Recycle) Injection of Wash Water
2.9.3 Heat Exchange for Increased Desalter Temperature
2.9.4 Heat Integration
3. Global Crude Oil Desalter Market Analysis
3.1 PEST Analysis of the Crude Oil Desalter Market
3.2 Expert Opinion
3.2.1 Primary Correspondents
3.3 Market Outlook
3.4 Drivers & Restraints
3.5 Dominant Region/Country
3.6 Market Scenario
3.7 Overall Growth Rate, Globally
3.8 SWOT Analysis of the Crude Oil Desalter Market
3.8.1 Strengths
3.8.2 Weaknesses
3.8.3 Opportunities
3.8.4 Threats
3.9 Porter’s Five Forces Analysis
3.9.1 Competitive Rivalry
3.9.2 Supplier Power
3.9.3 Buyer Power
3.9.4 Threat of Substitute
3..9.5 Threat of New Entrant
3.10 Importance of Desalting in Refineries
3.10.1 Corrosion
3.10.2 Scale Accumulation
3.10.3 Catalyst Activity
4. Crude Oil Desalter: Global Market Analysis by Segments
4.1 Global Crude Oil Desalter Market Forecast, by Type 2020-2030
4.1.1 Type Overview
4.1.2 Single Stage Crude Oil Desalter Market, 2020-2030
4.1.3 Two Stage Crude Oil Desalter Market, 2020-2030
4.1.4 Three Stage Crude Oil Desalter Market, 2020-2030
4.1.5 AC Field Electrostatic Dehydrator Market, 2020-2030
4.1.6 Combined AC-DC Field Electrostatic Dehydrator Market, 2020-2030
4.1.7 DC Field Electrostatic Dehydrator Market, 2020-2030
4.2 Global Crude Oil Desalter Market Forecast, by End-Use 2020-2030
4.2.1 End-Use Overview
4.2.2 FCC Feed Desalting Market, 2020-2030
4.2.3 Heavy Crude Desalting Market, 2020-2030
4.2.4 Distillate Treating Market, 2020-2030
4.2.5 Other Market, 2020-2030
4.3 Global Crude Oil Desalter Market Forecast, by Application 2020-2030
4.3.1 Application Overview
4.3.2 Upstream Market, 2020-2030
4.3.3 Downstream Market, 2020-2030
4.3.4 Other Application Market, 2020-2030
4.4 Global Crude Oil Desalter Market Forecast, by Technology 2020-2030
4.4.1 Technology Overview
4.4.2 Cameron’s Bilectric Technology Market, 2020-2030
4.4.3 NATCO’s Dual Polarity Technology Market, 2020-2030
4.4.4 Other Technology Market, 2020-2030
5. Leading Regions in Crude Oil Desalter Market 2020-2030
5.1 Regional Overview
5.1.1 North America
5.1.2 Europe
5.1.3 Asia Pacific
5.1.4 LAMEA
5.1.5 Leading Countries/ Regions
5.2 U.S. Crude Oil Desalter Market Forecast, 2020-2030
5.2.1 U.S. Crude Oil Desalter Submarket, By Type Forecast 2020-2030
5.2.2 U.S. Crude Oil Desalter Submarket, By End-Use Forecast 2020-2030
5.2.3 U.S. Crude Oil Desalter Submarket, By Application Forecast 2020-2030
5.2.4 U.S. Crude Oil Desalter Submarket, By Technology Forecast 2020-2030
5.3 Canada Crude Oil Desalter Market Forecast, 2020-2030
5.3.1 Canada Crude Oil Desalter Submarket, By Type Forecast 2020-2030
5.3.2 Canada Crude Oil Desalter Submarket, By End-Use Forecast 2020-2030
5.3.3 Canada Crude Oil Desalter Submarket, By Application Forecast 2020-2030
5.3.4 Canada Crude Oil Desalter Submarket, By Technology Forecast 2020-2030
5.4 The UK Crude Oil Desalter Market Forecast, 2020-2030
5.4.1 The UK Crude Oil Desalter Submarket, By Type Forecast 2020-2030
5.4.2 The UK Crude Oil Desalter Submarket, By End-Use Forecast 2020-2030
5.4.3 The UK Crude Oil Desalter Submarket, By Application Forecast 2020-2030
5.4.4 The UK Crude Oil Desalter Submarket, By Technology Forecast 2020-2030
5.5 Germany Crude Oil Desalter Market Forecast, 2020-2030
5.5.1 Germany Crude Oil Desalter Submarket, By Type Forecast 2020-2030
5.5.2 Germany Crude Oil Desalter Submarket, By End-Use Forecast 2020-2030
5.5.3 Germany Crude Oil Desalter Submarket, By Application Forecast 2020-2030
5.5.4 Germany Crude Oil Desalter Submarket, By Technology Forecast 2020-2030
5.6 France Crude Oil Desalter Market Forecast, 2020-2030
5.6.1 France Crude Oil Desalter Submarket, By Type Forecast 2020-2030
5.6.2 France Crude Oil Desalter Submarket, By End-Use Forecast 2020-2030
5.6.3 France Crude Oil Desalter Submarket, By Application Forecast 2020-2030
5.6.4 France Crude Oil Desalter Submarket, By Technology Forecast 2020-2030
5.7 Italy Crude Oil Desalter Market Forecast, 2020-2030
5.7.1 Italy Crude Oil Desalter Submarket, By Type Forecast 2020-2030
5.7.2 Italy Crude Oil Desalter Submarket, By End-Use Forecast 2020-2030
5.7.3 Italy Crude Oil Desalter Submarket, By Application Forecast 2020-2030
5.7.4 Italy Crude Oil Desalter Submarket, By Technology Forecast 2020-2030
5.8 Spain Crude Oil Desalter Market Forecast, 2020-2030
5.8.1 Spain Crude Oil Desalter Submarket, By Type Forecast 2020-2030
5.8.2 Spain Crude Oil Desalter Submarket, By End-Use Forecast 2020-2030
5.8.3 Spain Crude Oil Desalter Submarket, By Application Forecast 2020-2030
5.8.4 Spain Crude Oil Desalter Submarket, By Technology Forecast 2020-2030
5.9 Rest of Europe Crude Oil Desalter Market Forecast, 2020-2030
5.9.1 Rest of Europe Crude Oil Desalter Submarket, By Type Forecast 2020-2030
5.9.2 Rest of Europe Crude Oil Desalter Submarket, By End-Use Forecast 2020-2030
5.9.3 Rest of Europe Crude Oil Desalter Submarket, By Application Forecast 2020-2030
5.9.4 Rest of Europe Crude Oil Desalter Submarket, By Technology Forecast 2020-2030
5.10 China Crude Oil Desalter Market Forecast, 2020-2030
5.10.1 China Crude Oil Desalter Submarket, By Type Forecast 2020-2030
5.10.2 China Crude Oil Desalter Submarket, By End-Use Forecast 2020-2030
5.10.3 China Crude Oil Desalter Submarket, By Application Forecast 2020-2030
5.10.4 China Crude Oil Desalter Submarket, By Technology Forecast 2020-2030
5.11 India Crude Oil Desalter Market Forecast, 2020-2030
5.11.1 India Crude Oil Desalter Submarket, By Type Forecast 2020-2030
5.11.2 India Crude Oil Desalter Submarket, By End-Use Forecast 2020-2030
5.11.3 India Crude Oil Desalter Submarket, By Application Forecast 2020-2030
5.11.4 India Crude Oil Desalter Submarket, By Technology Forecast 2020-2030
5.12 Japan Crude Oil Desalter Market Forecast, 2020-2030
5.12.1 Japan Crude Oil Desalter Submarket, By Type Forecast 2020-2030
5.12.2 Japan Crude Oil Desalter Submarket, By End-Use Forecast 2020-2030
5.12.3 Japan Crude Oil Desalter Submarket, By Application Forecast 2020-2030
5.12.4 Japan Crude Oil Desalter Submarket, By Technology Forecast 2020-2030
5.13 Australia & New Zealand Crude Oil Desalter Market Forecast, 2020-2030
5.13.1 Australia & New Zealand Crude Oil Desalter Submarket, By Type Forecast 2020-2030
5.13.2 Australia & New Zealand Crude Oil Desalter Submarket, By End-Use Forecast 2020-2030
5.13.3 Australia & New Zealand Crude Oil Desalter Submarket, By Application Forecast 2020-2030
5.13.4 Australia & New Zealand Crude Oil Desalter Submarket, By Technology Forecast 2020-2030
5.14 Rest of Asia-Pacific Crude Oil Desalter Market Forecast, 2020-2030
5.14.1 Rest of Asia-Pacific Crude Oil Desalter Submarket, By Type Forecast 2020-2030
5.14.2 Rest of Asia-Pacific Crude Oil Desalter Submarket, By End-Use Forecast 2020-2030
5.14.3 Rest of Asia-Pacific Crude Oil Desalter Submarket, By Application Forecast 2020-2030
5.14.4 Rest of Asia-Pacific Crude Oil Desalter Submarket, By Technology Forecast 2020-2030
5.15 Latin America Crude Oil Desalter Market Forecast, 2020-2030
5.15.1 Latin America Crude Oil Desalter Submarket, By Type Forecast 2020-2030
5.15.2 Latin America Crude Oil Desalter Submarket, By End-Use Forecast 2020-2030
5.15.3 Latin America Crude Oil Desalter Submarket, By Application Forecast 2020-2030
5.15.4 Latin America Crude Oil Desalter Submarket, By Technology Forecast 2020-2030
5.16 Middle East Crude Oil Desalter Market Forecast, 2020-2030
5.16.1 Middle East Crude Oil Desalter Submarket, By Type Forecast 2020-2030
5.16.2 Middle East Crude Oil Desalter Submarket, By End-Use Forecast 2020-2030
5.16.3 Middle East Crude Oil Desalter Submarket, By Application Forecast 2020-2030
5.16.4 Middle East Crude Oil Desalter Submarket, By Technology Forecast 2020-2030
5.17 Africa Crude Oil Desalter Market Forecast, 2020-2030
5.17.1 Africa Crude Oil Desalter Submarket, By Type Forecast 2020-2030
5.17.2 Africa Crude Oil Desalter Submarket, By End-Use Forecast 2020-2030
5.17.3 Africa Crude Oil Desalter Submarket, By Application Forecast 2020-2030
5.17.4 Africa Crude Oil Desalter Submarket, By Technology Forecast 2020-2030
7. Leading Companies in The Crude Oil Desalter Market
7.1 Forum Energy Technologies
7.1.1 Forum Energy Technologies Products and Services
7.1.2 Analysis of Forum Energy Technologies within the Crude Oil Desalter Market
7.1.3 Forum Energy Technologies M&A Activity
7.1.4 Future Outlook for Forum Energy Technologies
7.1.5 Forum Energy Technologies Projects
7.1 Schlumberger
7.1.1 Schlumberger Products and Services
7.1.2 Analysis of Schlumberger within the Crude Oil Desalter Market
7.1.3 Schlumberger M&A Activity
7.1.4 Future Outlook for Schlumberger
7.1.5 Schlumberger Projects
7.1 Croda International Plc
7.1.1 Croda International Plc Products and Services
7.1.2 Analysis of Croda International Plc within the Crude Oil Desalter Market
7.1.3 Croda International Plc M&A Activity
7.1.4 Future Outlook for Croda International Plc
7.1.5 Croda International Plc Projects
7.1 Mackenzie Hydrocarbons
7.1.1 Mackenzie Hydrocarbons Products and Services
7.1.2 Analysis of Mackenzie Hydrocarbons within the Crude Oil Desalter Market
7.1.3 Mackenzie Hydrocarbons M&A Activity
7.1.4 Future Outlook for Mackenzie Hydrocarbons
7.1.5 Mackenzie Hydrocarbons Projects
7.1 Petro Techna
7.1.1 Petro Techna Products and Services
7.1.2 Analysis of Petro Techna within the Crude Oil Desalter Market
7.1.3 Petro Techna M&A Activity
7.1.4 Future Outlook for Petro Techna
7.1.5 Petro Techna Projects
7.1 Fjords Processing
7.1.1 Fjords Processing Products and Services
7.1.2 Analysis of Fjords Processing within the Crude Oil Desalter Market
7.1.3 Fjords Processing M&A Activity
7.1.4 Future Outlook for Fjords Processing
7.1.5 Fjords Processing Projects
7.1 VME
7.1.1 VME Products and Services
7.1.2 Analysis of VME within the Crude Oil Desalter Market
7.1.3 VME M&A Activity
7.1.4 Future Outlook for VME
7.1.5 VME Projects
7.1 CPE
7.1.1 CPE Products and Services
7.1.2 Analysis of CPE within the Crude Oil Desalter Market
7.1.3 CPE M&A Activity
7.1.4 Future Outlook for CPE
7.1.5 CPE Projects
7.1 ETI Process Group
7.1.1 ETI Process Group Products and Services
7.1.2 Analysis of ETI Process Group within the Crude Oil Desalter Market
7.1.3 ETI Process Group M&A Activity
7.1.4 Future Outlook for ETI Process Group
7.1.5 ETI Process Group Projects
7.1 Alfa Laval
7.1.1 Alfa Laval Products and Services
7.1.2 Analysis of Alfa Laval within the Crude Oil Desalter Market
7.1.3 Alfa Laval M&A Activity
7.1.4 Future Outlook for Alfa Laval
7.1.5 Alfa Laval Projects
7.1 Petro-Techna International, ICE (Asia) Pvt. Ltd
7.1.1 Petro-Techna International, ICE (Asia) Pvt. Ltd Products and Services
7.1.2 Analysis of Petro-Techna International, ICE (Asia) Pvt. Ltd within the Crude Oil Desalter Market
7.1.3 Petro-Techna International, ICE (Asia) Pvt. Ltd M&A Activity
7.1.4 Future Outlook for Petro-Techna International, ICE (Asia) Pvt. Ltd
7.1.5 Petro-Techna International, ICE (Asia) Pvt. Ltd Projects
8. Conclusions and Recommendations
8.1 Global Crude Oil Desalter Market Outlook
8.2 Recommendations
9. Glossary
Associated Visiongain Reports
Visiongain Report Sales Order Form
Appendix A
About Visiongain
Appendix B
Visiongain Report Evaluation Form
List of Tables
Table 1.0 Key Highlights
Table 3.1 PEST Analysis, Crude Oil Desalter Market
Table 3.2 SWOT Analysis
Table 4.1 Global Crude Oil Desalter Market Forecast 2020-2030 ($Bn, AGR %, CAGR %, Cumulative)
Table 4.2 Global Crude Oil Desalter Submarket, By Type Forecast 2020-2030 ($billion, AGR %, Cumulative)
Table 4.3 Global Crude Oil Desalter Submarket, By Application Forecast 2020-2030 ($billion, AGR %, Cumulative)
Table 4.4 Global Crude Oil Desalter Submarket, By Technology Forecast 2020-2030 ($billion, AGR %, Cumulative)
Table 5.1 Global Crude Oil Desalter Market, by Country/Region Forecast 2020-2030 ($billion, AGR %, Cumulative)
Table 5.2 Global Crude Oil Desalter Market, by Country/Region Forecast 2020-2030 ($billion, AGR %, Cumulative)
Table 5.3 Canada Crude Oil Desalter Market Forecast 2020-2030 ($billion, , AGR %, CAGR %, Cumulative)
Table 5.4 Canada Crude Oil Desalter Submarket, By Type Forecast 2020-2030 ($billion, AGR %, Cumulative)
Table 5.5 Canada Crude Oil Desalter Submarket, By End-Use Forecast 2020-2030 ($billion, AGR %, Cumulative)
Table 5.6 US Crude Oil Desalter Market Submarket, By Application Forecast 2020-2030 ($billion, , AGR %, CAGR %, Cumulative)
Table 5.7 US Crude Oil Desalter Submarket, By Type Forecast 2020-2030 ($billion, AGR %, Cumulative)
Table 5.8 US Crude Oil Desalter Submarket, By End-Use Forecast 2020-2030 ($billion, AGR %, Cumulative)
Table 5.9 Latin America Crude Oil Desalter Market Forecast 2020-2030 ($billion, , AGR %, CAGR %, Cumulative)
Table 5.10 Latin America Crude Oil Desalter Submarket, By Type Forecast 2020-2030 ($billion, AGR %, Cumulative)
Table 5.11 Latin America Crude Oil Desalter Submarket, By End-Use Forecast 2020-2030 ($billion, AGR %, Cumulative)
Table 5.12 Germany Crude Oil Desalter Market Submarket, By Application Forecast 2020-2030 ($billion, , AGR %, CAGR %, Cumulative)
Table 5.13 Germany Crude Oil Desalter Submarket, By Type Forecast 2020-2030 ($billion, AGR %, Cumulative)
Table 5.14 Germany Crude Oil Desalter Submarket, By End-Use Forecast 2020-2030 ($billion, AGR %, Cumulative)
Table 5.15 UK Crude Oil Desalter Market Submarket, By Application Forecast 2020-2030 ($billion, , AGR %, CAGR %, Cumulative)
Table 5.16 UK Crude Oil Desalter Submarket, By Type Forecast 2020-2030 ($billion, AGR %, Cumulative)
Table 5.17 UK Crude Oil Desalter Submarket, By End-Use Forecast 2020-2030 ($billion, AGR %, Cumulative)
Table 5.18 Spain Crude Oil Desalter Market Submarket, By Application Forecast 2020-2030 ($billion, , AGR %, CAGR %, Cumulative)
Table 5.19 Spain Crude Oil Desalter Submarket, By Type Forecast 2020-2030 ($billion, AGR %, Cumulative)
Table 5.20 Spain Crude Oil Desalter Submarket, By End-Use Forecast 2020-2030 ($billion, AGR %, Cumulative)
Table 5.21 UK Crude Oil Desalter Submarket, By Application Forecast 2020-2030 ($billion, , AGR %, CAGR %, Cumulative)
Table 5.22 UK Crude Oil Desalter Submarket, By Type Forecast 2020-2030 ($billion, AGR %, Cumulative)
Table 5.23 UK Crude Oil Desalter Submarket, By End-Use Forecast 2020-2030 ($billion, AGR %, Cumulative)
Table 5.24 China Crude Oil Desalter Submarket, By Application Forecast 2020-2030 ($billion, , AGR %, CAGR %, Cumulative)
Table 5.25 China Crude Oil Desalter Submarket, By Type Forecast 2020-2030 ($billion, AGR %, Cumulative)
Table 5.26 China Crude Oil Desalter Submarket, By End-Use Forecast 2020-2030 ($billion, AGR %, Cumulative)
Table 5.27 Australia Crude Oil Desalter Submarket, By Application Forecast 2020-2030 ($billion, , AGR %, CAGR %, Cumulative)
Table 5.28 Australia Crude Oil Desalter Submarket, By Type Forecast 2020-2030 ($billion, AGR %, Cumulative)
Table 5.29 Australia Crude Oil Desalter Submarket, By End-Use Forecast 2020-2030 ($billion, AGR %, Cumulative)
Table 5.30 South Korea Crude Oil Desalter Submarket, By Application Forecast 2020-2030 ($billion, , AGR %, CAGR %, Cumulative)
Table 5.31 South Korea Crude Oil Desalter Submarket, By Type Forecast 2020-2030 ($billion, AGR %, Cumulative)
Table 5.32 South Korea Crude Oil Desalter Submarket, By End-Use Forecast 2020-2030 ($billion, AGR %, Cumulative)
Table 5.33 Japan Crude Oil Desalter Submarket, By Application Forecast 2020-2030 ($billion, , AGR %, CAGR %, Cumulative)
Table 5.34 Japan Crude Oil Desalter Submarket, By Type Forecast 2020-2030 ($billion, AGR %, Cumulative)
Table 5.35 Japan Crude Oil Desalter Submarket, By End-Use Forecast 2020-2030 ($billion, AGR %, Cumulative)
Table 5.36 India Crude Oil Desalter Submarket, By Application Forecast 2020-2030 ($billion, , AGR %, CAGR %, Cumulative)
Table 5.37 India Crude Oil Desalter Submarket, By Type Forecast 2020-2030 ($billion, AGR %, Cumulative)
Table 5.38 India Crude Oil Desalter Submarket, By End-Use Forecast 2020-2030 ($billion, AGR %, Cumulative)
Table 5.39 Middle East Crude Oil Desalter Submarket, By Application Forecast 2020-2030 ($billion, , AGR %, CAGR %, Cumulative)
Table 5.40 Middle East Crude Oil Desalter Submarket, By Type Forecast 2020-2030 ($billion, AGR %, Cumulative)
Table 5.41 Middle East Crude Oil Desalter Submarket, By End-Use Forecast 2020-2030 ($billion, AGR %, Cumulative)
Table 5.42 Rest of Asia-Pacific Crude Oil Desalter Submarket, By Application Forecast 2020-2030 ($billion , , AGR %, CAGR %, Cumulative)
Table 5.43 Rest of Asia-Pacific Crude Oil Desalter Submarket, By Type Forecast 2020-2030 ($billion , AGR %, Cumulative)
Table 5.44 Rest of Asia-Pacific Crude Oil Desalter Submarket, By End-Use Forecast 2020-2030 ($billion , AGR %, Cumulative)
Table 5.45 Rest of Europe Crude Oil Desalter Submarket, By Application Forecast 2020-2030 ($billion, , AGR %, CAGR %, Cumulative)
Table 5.46 Rest of Europe Crude Oil Desalter Submarket, By Type Forecast 2020-2030 ($billion, AGR %, Cumulative)
Table 5.47 Rest of Europe Crude Oil Desalter Submarket, By End-Use Forecast 2020-2030 ($billion, AGR %, Cumulative)
Table 5.48 Africa Crude Oil Desalter Submarket, By Application Forecast 2020-2030 ($billion, , AGR %, CAGR %, Cumulative)
Table 5.49 Africa Crude Oil Desalter Submarket, By Type Forecast 2020-2030 ($billion, AGR %, Cumulative)
Table 5.50 Africa Crude Oil Desalter Submarket, By End-Use Forecast 2020-2030 ($billion, AGR %, Cumulative)
Table 5.51 Spain Crude Oil Desalter Submarket, By Application Forecast 2020-2030 ($billion , , AGR %, CAGR %, Cumulative)
Table 5.52 Spain Crude Oil Desalter Submarket, By Type Forecast 2020-2030 ($billion , AGR %, Cumulative)
Table 5.53 Spain Crude Oil Desalter Submarket, By End-Use Forecast 2020-2030 ($billion , AGR %, Cumulative)
Table 7.1 Forum Energy Technologies Profile 2019 (Market Entry, Public/Private, Headquarters, Geography, Key Market, Listed on, Products/Services
Table 7.2 Forum Energy Technologies Profile 2019 (Market Entry, Public/Private, Headquarter, Total Company Revenue $billion, Change in Revenue, Geography, Key Market, Listed on, Products/Services)
Table 7.3 Forum Energy Technologies Products and Services (Product/Service, Notes)
Table 7.4 Forum Energy Technologies Total Company Sales 2015-2019 (US$billion, AGR %)
Table 7.5 Forum Energy Technologies Total Company Recent Development 2015-2019
Table 7.6 Schlumberger Profile 2019 (Market Entry, Public/Private, Headquarter, Total Company Revenue $billion, Change in Revenue, Geography, Key Market, Listed on, Products/Services)
Table 7.7 Schlumberger Products and Services (Product/Service, Notes)
Table 7.8 Schlumberger Total Company Sales 2015-2019 (US$billion, AGR %)
Table 7.9 Schlumberger Total Company Recent Development 2015-2019
Table 7.10 Croda International Plc Profile 2019 (Market Entry, Public/Private, Headquarter, Total Company Revenue $billion, Change in Revenue, Geography, Key Market, Listed on, Products/Services)
Table 7.11 Croda International Plc Products and Services (Product/Service, Notes)
Table 7.12 Croda International Plc Total Company Sales 2015-2019 (US$billion, AGR %)
Table 7.13 Croda International Plc Total Company Recent Development 2015-2019
Table 7.14 Mackenzie Hydrocarbons Profile 2019 (Market Entry, Public/Private, Headquarter, Total Company Revenue $billion, Change in Revenue, Geography, Key Market, Listed on, Products/Services)
Table 7.15 Mackenzie Hydrocarbons Products and Services (Product/Service, Notes)
Table 7.16 Mackenzie Hydrocarbons Total Company Sales 2015-2019 (US$billion, AGR %)
Table 7.17 Mackenzie Hydrocarbons Total Company Recent Development 2015-2019
Table 7.18 Petro Techna Profile 2019 (Market Entry, Public/Private, Headquarter, Total Company Revenue $billion, Change in Revenue, Geography, Key Market, Listed on, Products/Services)
Table 7.19 Petro Techna Products and Services (Product/Service, Notes)
Table 7.20 Petro Techna Total Company Sales 2015-2019 (US$billion, AGR %)
Table 7.21 Petro Techna Total Company Recent Development 2015-2019
Table 7.22 Fjords Processing Profile 2019 (Market Entry, Public/Private, Headquarter, Total Company Revenue $billion, Change in Revenue, Geography, Key Market, Listed on, Products/Services)
Table 7.23 Fjords Processing Products and Services (Product/Service, Notes)
Table 7.24 Fjords Processing Total Company Sales 2015-2019 (US$billion, AGR %)
Table 7.25 Fjords Processing Total Company Recent Development 2015-2019
Table 7.26 VME Profile 2019 (Market Entry, Public/Private, Headquarter, Total Company Revenue $billion, Change in Revenue, Geography, Key Market, Listed on, Products/Services)
Table 7.27 VME Products and Services (Product/Service, Notes)
Table 7.28 VME Total Company Sales 2015-2019 (US$billion, AGR %)
Table 7.29 VME Total Company Recent Development 2015-2019
Table 7.30 CPE Profile 2019 (Market Entry, Public/Private, Headquarter, Total Company Revenue $billion, Change in Revenue, Geography, Key Market, Listed on, Products/Services)
Table 7.31 CPE Products and Services (Product/Service, Notes)
Table 7.32 CPE Total Company Sales 2015-2019 (US$billion, AGR %)
Table 7.33 CPE Total Company Recent Development 2015-2019
Table 7.34 ETI Process Group Profile 2019 (Market Entry, Public/Private, Headquarter, Total Company Revenue $billion, Change in Revenue, Geography, Key Market, Listed on, Products/Services)
Table 7.35 ETI Process Group Products and Services (Product/Service, Notes)
Table 7.36 ETI Process Group Total Company Sales 2015-2019 (US$billion, AGR %)
Table 7.37 ETI Process Group Total Company Recent Development 2015-2019
Table 7.38 Alfa Laval Profile 2019 (Market Entry, Public/Private, Headquarter, Total Company Revenue $billion, Change in Revenue, Geography, Key Market, Listed on, Products/Services)
Table 7.39 Alfa Laval Products and Services (Product/Service, Notes)
Table 7.40 Alfa Laval Total Company Sales 2015-2019 (US$billion, AGR %)
Table 7.41 Alfa Laval Total Company Recent Development 2015-2019
Table 7.42 Petro-Techna International, ICE (Asia) Pvt. Ltd Profile 2019 (Market Entry, Public/Private, Headquarter, Total Company Revenue $billion, Change in Revenue, Geography, Key Market, Listed on, Products/Services)
Table 7.43 Petro-Techna International, ICE (Asia) Pvt. Ltd Products and Services (Product/Service, Notes)
Table 7.44 Petro-Techna International, ICE (Asia) Pvt. Ltd Total Company Sales 2015-2019 (US$billion, AGR %)
Table 7.45 Petro-Techna International, ICE (Asia) Pvt. Ltd Total Company Recent Development 2015-2019
List of Figures
Figure 1.1 Global Crude Oil Desalter Market Segmentation
Figure 2.1 Crude Oil Desalter Value Chain Analysis
Figure 3.1 Crude Oil Desalter Supply-Demand Analysis
Figure 4.1 Global Crude Oil Desalter Forecast 2020-2030 ($billion, AGR %)
Figure 4.2 Global Crude Oil Desalter Market Forecast 2020-2030
Figure 4.3 Global Crude Oil Desalter Submarket Forecast by 2020-2030 ($ billion)
Figure 4.4 Global Crude Oil Desalter Market By Type Share Forecast 2020, 2025, 2030 (% Share)
Figure 4.19 Global Crude Oil Desalter by Submarket By Type Forecast 2020-2030 ($ million)
Figure 4.20 Global Crude Oil Desalter Market, by Share Forecast 2020, 2025, 2030 (% Share)
Figure 4.21 Crude Oil Desalter Market, By Type Forecast 2020-2030 ($billion, AGR%)
Figure 4.23 Crude Oil Desalter Market, By Type Forecast 2020-2030 ($billion, AGR%)
Figure 4.25 Crude Oil Desalter Market, By Type Forecast 2020-2030 ($billion, AGR%)
Figure 4.27 Crude Oil Desalter Market, By Type Forecast 2020-2030 ($billion, AGR%)
Figure 5.1 Regional/Country Crude Oil Desalter Market, by 2020-2030
Figure 5.3 Leading Country/Regional Crude Oil Desalter Market Share, by 2020
Figure 5.4 Leading Country/Regional Crude Oil Desalter Market Share, by 2025
Figure 5.5 Leading Country/Regional Crude Oil Desalter Market Share, by 2030
Figure 5.6 Canada Crude Oil Desalter Market Forecast 2020-2030 ($billion, AGR%)
Figure 5.7 Canada Crude Oil Desalter Market, by Forecast 2020-2030
Figure 5.8 Canada Crude Oil Desalter Submarket, By Type Forecast 2020-2030
Figure 5.9 Canada Crude Oil Desalter Submarket , By End-Use Forecast 2020-2030
Figure 5.10 Canada Crude Oil Desalter Submarket , By Application 2020-2030 ($billion, AGR%)
Figure 5.10 U.S. Crude Oil Desalter Market Forecast 2020-2030 ($billion, AGR%)
Figure 5.11 U.S. Crude Oil Desalter Market, by Forecast 2020-2030
Figure 5.12 U.S. Crude Oil Desalter Submarket, By Type Forecast 2020-2030
Figure 5.13 U.S. Crude Oil Desalter Submarket , By End-Use Forecast 2020-2030
Figure 5.13 U.S. Crude Oil Desalter Submarket , By Application Forecast 2020-2030
Figure 5.14 Latin America Crude Oil Desalter Market Forecast 2020-2030 ($billion , AGR%)
Figure 5.15 Latin America Crude Oil Desalter Market, by Forecast 2020-2030
Figure 5.16 Latin America Crude Oil Desalter Submarket, By Type Forecast 2020-2030
Figure 5.17 Latin America Crude Oil Desalter Submarket , By End-Use Forecast 2020-2030
Figure 5.17 Latin America Crude Oil Desalter Submarket , By Application Forecast 2020-2030
Figure 5.18 Germany Crude Oil Desalter Market Forecast 2020-2030 ($billion, AGR%)
Figure 5.19 Germany Crude Oil Desalter Market, by Forecast 2020-2030
Figure 5.20 Germany Crude Oil Desalter Submarket, By Type Forecast 2020-2030
Figure 5.21 Germany Crude Oil Desalter Submarket , By End-Use Forecast 2020-2030
Figure 5.21 Germany Crude Oil Desalter Submarket , By Application Forecast 2020-2030
Figure 5.22 U.K. Crude Oil Desalter Market Forecast 2020-2030 ($billion, AGR%)
Figure 5.23 U.K. Crude Oil Desalter Market, by Forecast 2020-2030
Figure 5.24 U.K. Crude Oil Desalter Submarket, By Type Forecast 2020-2030
Figure 5.25 U.K. Crude Oil Desalter Submarket , By End-Use Forecast 2020-2030
Figure 5.25 U.K. Crude Oil Desalter Submarket , By Application Forecast 2020-2030
Figure 5.26 Spain Crude Oil Desalter Market Forecast 2020-2030 ($billion, AGR%)
Figure 5.27 Spain Crude Oil Desalter Market, by Forecast 2020-2030
Figure 5.28 Spain Crude Oil Desalter Submarket, By Type Forecast 2020-2030
Figure 5.29 Spain Crude Oil Desalter Submarket , By End-Use Forecast 2020-2030
Figure 5.30 UK Crude Oil Desalter Market Forecast 2020-2030 ($billion, AGR%)
Figure 5.31 UK Crude Oil Desalter Market, by Forecast 2020-2030
Figure 5.32 UK Crude Oil Desalter Submarket, By Type Forecast 2020-2030
Figure 5.33 UK Crude Oil Desalter Submarket , By End-Use Forecast 2020-2030
Figure 5.34 China Crude Oil Desalter Market Forecast 2020-2030 ($billion, AGR%)
Figure 5.35 China Crude Oil Desalter Submarket , By Application, by Forecast 2020-2030
Figure 5.36 China Crude Oil Desalter Submarket, By Type Forecast 2020-2030
Figure 5.37 China Crude Oil Desalter Submarket , By End-Use Forecast 2020-2030
Figure 5.38 Australia Crude Oil Desalter Market Forecast 2020-2030 ($billion, AGR%)
Figure 5.39 Australia Crude Oil Desalter Submarket , By Application, by Forecast 2020-2030
Figure 5.40 Australia Crude Oil Desalter Submarket, By Type Forecast 2020-2030
Figure 5.41 Australia Crude Oil Desalter Submarket , By End-Use Forecast 2020-2030
Figure 5.42 South Korea Crude Oil Desalter Market Forecast 2020-2030 ($billion, AGR%)
Figure 5.43 South Korea Crude Oil Desalter Submarket , By Application, by Forecast 2020-2030
Figure 5.44 South Korea Crude Oil Desalter Submarket, By Type Forecast 2020-2030
Figure 5.45 South Korea Crude Oil Desalter Submarket , By End-Use Forecast 2020-2030
Figure 5.46 Japan Crude Oil Desalter Market Forecast 2020-2030 ($billion, AGR%)
Figure 5.47 Japan Crude Oil Desalter Submarket , By Application, by Forecast 2020-2030
Figure 5.48 Japan Crude Oil Desalter Submarket, By Type Forecast 2020-2030
Figure 5.49 Japan Crude Oil Desalter Submarket , By End-Use Forecast 2020-2030
Figure 5.50 India Crude Oil Desalter Market Forecast 2020-2030 ($billion, AGR%)
Figure 5.51 India Crude Oil Desalter Submarket , By Application, by Forecast 2020-2030
Figure 5.52 India Crude Oil Desalter Submarket, By Type Forecast 2020-2030
Figure 5.53 India Crude Oil Desalter Submarket , By End-Use Forecast 2020-2030
Figure 5.54 Middle East Crude Oil Desalter Market Forecast 2020-2030 ($billion, AGR%)
Figure 5.55 Middle East Crude Oil Desalter Submarket , By Application, by Forecast 2020-2030
Figure 5.56 Middle East Crude Oil Desalter Submarket, By Type Forecast 2020-2030
Figure 5.57 Middle East Crude Oil Desalter Submarket , By End-Use Forecast 2020-2030
Figure 5.70 Rest of the World Crude Oil Desalter Market Forecast 2020-2030 ($billion , AGR%)
Figure 5.71 Rest of the World Crude Oil Desalter Submarket , By Application, by Forecast 2020-2030
Figure 5.72 Rest of the World Crude Oil Desalter Submarket, By Type Forecast 2020-2030
Figure 5.73 Rest of the World Crude Oil Desalter Submarket , By End-Use Forecast 2020-2030
Figure 7.1 Forum Energy Technologies Total Company Sales 2013-2019 (US$ million, AGR %)
Figure 7.2 Schlumberger Total Company Sales 2013-2019 (US$ million, AGR %)
Figure 7.3 Croda International Plc Total Company Sales 2013-2019 (US$ Bn, AGR %)
Figure 7.6 Mackenzie Hydrocarbons Company Sales 2013-2019 (US$ bn, AGR %)
Figure 7.7 Mackenzie Hydrocarbons Revenue % Share, by Application Segment, 2019
Figure 7.8 Mackenzie Hydrocarbons Revenue % Share, by Geographical Trade, 2019
Figure 7.9 Mackenzie Hydrocarbons Revenue % Share, by Business Segment, 2019
Figure 7.10 Petro Techna Revenue % Share, by Geographic Segment, 2019
Figure 7.11 Fjords Processing Company Total Company Sales 2013-2019 (US$ million, AGR %)
Figure 7.12 VME Total Company Sales 2013-2019 (US$ million, AGR %)
Figure 7.13 VME Revenue % Share, by Regional Segment, 2019
Figure 7.14 CPE Total Company Sales 2013-2019 (US$ million, AGR %)
Figure 7.15 CPE Revenue % Share, by Regional Segment, 2019
Figure 7.16 CPE Revenue % Share, by Business Segment, 2019
Figure 7.17 ETI Process Group Total Company Sales 2013-2019 (US$ bn, AGR %)
Figure 7.18 Alfa Laval Total Company Revenue 2013-2019 (US$ bn, AGR %)
Figure 7.19 Alfa Laval Company Sales 2014-2019 (US$ bn, AGR %)
Figure 7.20 Alfa Laval Revenue % Share, by Business Segment, 2019