Report Description
This latest report by business intelligence provider Visiongain assesses that Coal Bed Methane Market spending will reach $14.8 billion in 2020, and is expected to reach $23.4 billion by 2023, registering a CAGR of 9.4% from 2020 to 2030. Coal bed methane (CBM) is the gas found in the majority of coal deposits. It is created during the process of coalification, where over millions of years plant material is converted into coal. Additionally, CBM is made up of pure methane, a clean-burning fuel that contains lesser impurities and requires minimal processing. It is regarded environmentally friendly than petroleum, carbon or even standard natural gas.
Reducing methane emissions from conventional fuels and coal mining, lowering CBM prices compared to other unconventional natural gases, and generating direct and indirect employment in CBM extraction drive global CBM market growth. The big original investment dedication to well drilling, stimulus, and water processing, and the complexity in estimating recoverable quantities in evaluating CBM projects, however, hamper market growth. Key market players have agreed to expand their brand portfolios and expand their market outreach as their key strategy.
Favorable government initiatives towards use of unconventional resources will propel the coal bed methane market during the forecast timeline.
In acknowledging the importance of CBM, the Government of China initiated the creation of the Five-Year Plan requiring the nation to generate 50 billion m3 of CBM by 2020. Similarly, India’s government has allocated 31 development blocks for CBM exploration and production to propel the industry. A substantial number of unexplored reserves will speed up the methane market for coal beds, boosting business growth leading to increased production. However, Russia is estimated to hold between 17 and 80 trillion m3 of total resources, political instability and market forces have restricted full-scale production.
It is therefore critical that you have your timescales correct and your forecasting plans ready. This report will ensure that you do. Visiongain’s report will ensure that you keep informed and ahead of your competitors. Gain that competitive advantage.
In the future the CBM industry may take an entirely new direction, becoming an essential player in carbon storage
The CBM industry may take a completely new direction in the future, becoming a key player in carbon storage. As applicants for CO2 sequestration, a range of improved coalbed gas (ECBM) initiatives explored unminable coal seams and deprived CBM areas. In general, organic materials that make up coals have a stronger CO2 affinity than methane. In a process similar to that used to recover secondary oil, CO2 is pumped into a coal seam and adsorbed by the coal while methane is displaced and released. ECBM projects offer the opportunity to remove greenhouse gasses from the atmosphere and at the same time increase supplies of natural gas. The studies have moved from the data collection and analysis phase to implementation, and the results have encouraged the United States to lead the way in the early days of development of CBM. Australia, China and other nations are picking up rapidly. CBM is a global resource capable of becoming a major contributor to clean, plentiful energy.
Coal Has A Large Internal Surface Area, It Can Store Surprisingly Large Volumes Of Methane-Rich Gas
Large amounts of methane-rich gas are produced and deposited on inner layers within the coal during coalification. Because coal has such a big inner layer, it can store amazingly big quantities of methane-rich gas; it can carry six or seven times as much gas as a standard rock-sized natural gas reservoir. Moreover, much of the coal, and therefore much of the methane, lies at shallow depths, making wells easy to drill and cheap to complete. Increased stress seals fractures (cleats) in the coal with higher size, thereby reducing the permeability and capacity of the gas to pass through and out the coal.
Exploration Costs For Coal-Bed Methane Are Low, And The Wells Are Cost Effective To Drill.
Coal-bed methane exploration costs are low and the wells are cost-effective for drilling. In most coals, methane occurs, and the location of the coal resources of the nation is already well known. Coal methane is therefore an attractive resource. It is estimated that the cost of producing one cubic meter of CBM through vertical drilling is around USD 0.11 globally. It pays for the highest percentage of drilling costs earned. It is estimated that the drilling cost represents approximately 74.3 percent of the total cost of one cubic meter of CBM gas production.
Increased Production Of Coal-Bed Methane Brings Some Challenges Also.
However, increased coal-bed methane production carries some technological and environmental challenges and costs with it. For instance, gas rests on bottom of oil which, in turn, rests on bottom of water in a conventional oil or gas reservoir. An oil or gas well draws only from the extracted petroleum without a large volume of water being produced. But water permeates coal beds, and methane is trapped in the coal by its pressure. Water must first be drawn off to produce methane from coal beds, reducing the pressure so that methane can flow out of the coal and into the well bore. Surface disposal of large volumes of potable water can affect streams and other habitats, and subsurface reinjection makes production more costly. In addition, methane is a greenhouse gas; in the atmosphere it acts to trap heat and thus contributes to global warming.
Read on to discover how you can exploit the future business opportunities emerging in this sector. Visiongain’s new study tells you and tells you NOW. The 212-pages report provides clear, detailed insight into the global Coal Bed Methane market. Discover the key drivers and challenges affecting the market.
By ordering and reading our brand-new report today, you stay better informed and ready to act.
Report Scope
The report delivers considerable added value by revealing:
71 tables, charts and graphs are analyzing and revealing the growth prospects and outlook for the Coal Bed Methane market.
Global Coal Bed Methane market forecasts and analysis from 2020-2030.
Coal Bed Methane market provides revenue estimates, forecasts and analysis from 2020-2030 for Coal Bed Methane submarkets:
Forecasts and analysis of Coal Bed Methane market by Application between 2020-2030
Power Generation Market, 2020-2030
Residential Market, 2020-2030
Commercial Market, 2020-2030
Transportation Market, 2020-2030
Other Application Market, 2020-2030
Forecasts and analysis of Coal Bed Methane market by Drilling Type between 2020-2030
Conventional Drilling Market, 2020-2030
Drilling before Mining Market, 2020-2030
Horizontal Drilling Market, 2020-2030
Other Drilling Type Market, 2020-2030
Forecasts and analysis of Coal Bed Methane market by Type between 2020-2030
Coal-mine methane (CMM) Market, 2020-2030
Abandoned mine methane(AMM) Market, 2020-2030
Virgin coalbed methane(VCBM) Market, 2020-2030
Other Type Market, 2020-2030
Regional Coal Bed Methane market forecasts from 2020-2030 with drivers and restraints for the countries including:
Geographic Breakdown
Focused regional forecasts and analysis explore the future opportunities:
North America Market, 2020-2030
US Market, 2020-2030
Canada Market, 2020-2030
Europe Market, 2020-2030
The UK Market, 2020-2030
Germany Market, 2020-2030
France Market, 2020-2030
Italy Market, 2020-2030
Spain Market, 2020-2030
Rest of Europe Market, 2020-2030
Asia-Pacific Market, 2020-2030
China Market, 2020-2030
India Market, 2020-2030
Japan Market, 2020-2030
Australia & New Zealand Market, 2020-2030
Rest of Asia-Pacific Market, 2020-2030
LAMEA Market, 2020-2030
Latin America Market, 2020-2030
Middle East Market, 2020-2030
Africa Market, 2020-2030
Figure:- Coal Bed Methane Market Size and Forecast by Application, 2020-2030
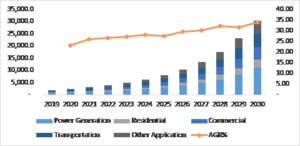
Coal bed methane market has numerous applications
Coal bed methane market has numerous applications including power generation, manufacturing liquefied petroleum gas, gas turbine propelling, gas engine systems, and providing plastics and pharmaceutical industry foundations. It is also possible to use CBM with a proportionate amount of methane gas to replace conventional natural gas and find its application as a propeller fuel in the automotive industry. In 2015, India’s Petroleum and Explosives Safety Organization (PESO) awarded seven licenses to distribute CBM as a gas in cars across the nation.
Company profiles for the leading Coal Bed Methane companies
Company Profiles of Leading Players
Dart Energy
Baker Hughes
Santos Ltd.
BG Group (Royal Dutch Shell PLC.)
Arrow Energy
Origin Energy
Great Eastern Energy
PetroChina
Petronas
Encana Corporation
Concophillips
Other Key Players in the market
China United Coal Bed Methane Corporation
BP PLC
Blue Energy
BJ Services
Black Diamond Energy, Inc.
Halliburton
Chevron U.S.A.
Suncor
The Williams Companies
Exxon Mobil Corporation
Anadarko
Devon
El Paso
Energen
Fidelity Exploration
Range Resources
Bill Barrett
Belden & Blake
Continental Production Company
Double Eagle Petroleum
GeoMet
Penn Virginia
ConocoPhillips
Chesapeake
CNX
Dominion
Layne Christianson
Newfield
Noble Energy
Southwestern Energy
St. Mary Land & Exploration
Unit Petroleum
Enerjex
Petrohawk
PetroQuest
Rosetta Resources
Warren Resources
Conclusions and recommendations which will aid decision-making
How will you benefit from this report?
Keep your knowledge base up to speed. Don’t get left behind
Reinforce your strategic decision-making with definitive and reliable market data
Learn how to exploit new technological trends
Realise your company’s full potential within the market
Understand the competitive landscape and identify potential new business opportunities & partnerships
Who should read this report?
Anyone with involvement in the Coal Bed Methane
Energy operators
Engineering contractors
Investment managers
Arbitrage companies and divisions
Gas price reporting companies
Gas company managers
Gas consultants
Gas company executives and analysts
Heads of strategic development
Business development managers
Marketing managers
Market analysts,
Technologists
Suppliers
Investors
Banks
Government agencies
Visiongain’s study is intended for anyone requiring commercial analyses for the Coal Bed Methane market and leading companies. You find data, trends and predictions.
Buy our report today the Coal Bed Methane Market Forecast 2020-2030. Avoid missing out by staying informed – get our report now.
Visiongain is a trading partner with the US Federal Government
CCR Ref number: KD4R6
Do you have any custom requirements we can help you with? Any need for specific country, geo region, market segment or specific company information? Contact us today, we can discuss your needs and see how we can help sara.peerun@visiongain.com
Report Overview
1.1 Global Coal Bed Methane Market
1.2 Global Coal Bed Methane Market Overview
1.3 Global Coal Bed Methane Market Segmentation
1.4 The Emergence of Coal Bed Methane in the Industry
1.5 Why You Should Read This Report
1.6 How This Report Delivers
1.7 Key Questions Answered by This Analytical Report
1.8 Methodology
1.8.1 Secondary Research
1.8.2 Market Evaluation & Forecasting Methodology
1.9 Frequently Asked Questions (FAQ)
1.10 Associated Visiongain Reports
1.11 About Visiongain
2. Introduction to Coal Bed Methane Market
2.1 Market Definition
2.2 Industry Outlook
2.3 Value Chain Analysis
2.4 Industry Structure
2.5 Current Status & Trends
2.6 Demand & Supply Analysis
2.7 Trade Analysis
2.8 Price Trend Analysis
2.9 Current Economics of CBM Production
2.10 Number of Wells and Projects
2.11 Project Revenue
2.12 Project Cost
2.13 Project Operators (Numbers, Size, and Discharge Status)
2.14 Financial Characteristics of Firms Producing CBM
3. Global Coal Bed Methane Market Analysis
3.1 PEST Analysis of the Coal Bed Methane Market
3.2 Expert Opinion
3.2.1 Primary Correspondents
3.3 Market Outlook
3.4 Drivers & Restraints
3.5 Dominant Region/Country
3.6 Market Scenario
3.7 Overall Growth Rate, Globally
3.8 SWOT Analysis of the Coal Bed Methane Market
3.8.1 Strengths
3.8.2 Weaknesses
3.8.3 Opportunities
3.8.4 Threats
3.9 Porter’s Five Forces Analysis
3.9.1 Competitive Rivalry
3.9.2 Supplier Power
3.9.3 Buyer Power
3.9.4 Threat of Substitute
3..9.5 Threat of New Entrant
3.10 Treatment Methods
3.10.1 Aeration
3.10.2 Sedimentation/Chemical Precipitation
3.10.3 Reverse Osmosis
3.10.4 Ion Exchange
3.10.5 Electrodialysis
3.10.6 Thermal Distillation
4. Coal Bed Methane: Global Market Analysis by Segments
4.1 Global Coal Bed Methane Market Forecast, by Application 2020-2030
4.1.1 Application Overview
4.1.2 Power Generation Market, 2020-2030
4.1.3 Residential Market, 2020-2030
4.1.4 Commercial Market, 2020-2030
4.1.5 Transportation Market, 2020-2030
4.1.6 Other Application Market, 2020-2030
4.2 Global Coal Bed Methane Market Forecast, by Drilling Type 2020-2030
4.2.1 Drilling Type Overview
4.2.2 Conventional Drilling Market, 2020-2030
4.2.3 Drilling before Mining Market, 2020-2030
4.2.4 Horizontal Drilling Market, 2020-2030
4.2.5 Other Drilling Type Market, 2020-2030
4.3 Global Coal Bed Methane Market Forecast, by Type 2020-2030
4.3.1 Type Overview
4.3.2 Coal-mine methane (CMM) Market, 2020-2030
4.3.3 Abandoned mine methane(AMM) Market, 2020-2030
4.3.4 Virgin coalbed methane(VCBM) Market, 2020-2030
4.3.5 Other Type Market, 2020-2030
5. Leading Regions in Coal Bed Methane Market 2020-2030
5.1 Regional Overview
5.1.1 North America
5.1.2 Europe
5.1.3 Asia Pacific
5.1.4 LAMEA
5.1.5 Leading Countries/ Regions
5.2 U.S. Coal Bed Methane Market Forecast, 2020-2030
5.2.1 U.S. Coal Bed Methane Submarket, By Application Forecast 2020-2030
5.2.2 U.S. Coal Bed Methane Submarket, By Drilling Type Forecast 2020-2030
5.2.3 U.S. Coal Bed Methane Submarket, By Type Forecast 2020-2030
5.2.4 U.S. Coal Bed Methane Submarket, By Forecast 2020-2030
5.3 Canada Coal Bed Methane Market Forecast, 2020-2030
5.3.1 Canada Coal Bed Methane Submarket, By Application Forecast 2020-2030
5.3.2 Canada Coal Bed Methane Submarket, By Drilling Type Forecast 2020-2030
5.3.3 Canada Coal Bed Methane Submarket, By Type Forecast 2020-2030
5.3.4 Canada Coal Bed Methane Submarket, By Forecast 2020-2030
5.4 The UK Coal Bed Methane Market Forecast, 2020-2030
5.4.1 The UK Coal Bed Methane Submarket, By Application Forecast 2020-2030
5.4.2 The UK Coal Bed Methane Submarket, By Drilling Type Forecast 2020-2030
5.4.3 The UK Coal Bed Methane Submarket, By Type Forecast 2020-2030
5.4.4 The UK Coal Bed Methane Submarket, By Forecast 2020-2030
5.5 Germany Coal Bed Methane Market Forecast, 2020-2030
5.5.1 Germany Coal Bed Methane Submarket, By Application Forecast 2020-2030
5.5.2 Germany Coal Bed Methane Submarket, By Drilling Type Forecast 2020-2030
5.5.3 Germany Coal Bed Methane Submarket, By Type Forecast 2020-2030
5.5.4 Germany Coal Bed Methane Submarket, By Forecast 2020-2030
5.6 France Coal Bed Methane Market Forecast, 2020-2030
5.6.1 France Coal Bed Methane Submarket, By Application Forecast 2020-2030
5.6.2 France Coal Bed Methane Submarket, By Drilling Type Forecast 2020-2030
5.6.3 France Coal Bed Methane Submarket, By Type Forecast 2020-2030
5.6.4 France Coal Bed Methane Submarket, By Forecast 2020-2030
5.7 Italy Coal Bed Methane Market Forecast, 2020-2030
5.7.1 Italy Coal Bed Methane Submarket, By Application Forecast 2020-2030
5.7.2 Italy Coal Bed Methane Submarket, By Drilling Type Forecast 2020-2030
5.7.3 Italy Coal Bed Methane Submarket, By Type Forecast 2020-2030
5.7.4 Italy Coal Bed Methane Submarket, By Forecast 2020-2030
5.8 Spain Coal Bed Methane Market Forecast, 2020-2030
5.8.1 Spain Coal Bed Methane Submarket, By Application Forecast 2020-2030
5.8.2 Spain Coal Bed Methane Submarket, By Drilling Type Forecast 2020-2030
5.8.3 Spain Coal Bed Methane Submarket, By Type Forecast 2020-2030
5.8.4 Spain Coal Bed Methane Submarket, By Forecast 2020-2030
5.9 Rest of Europe Coal Bed Methane Market Forecast, 2020-2030
5.9.1 Rest of Europe Coal Bed Methane Submarket, By Application Forecast 2020-2030
5.9.2 Rest of Europe Coal Bed Methane Submarket, By Drilling Type Forecast 2020-2030
5.9.3 Rest of Europe Coal Bed Methane Submarket, By Type Forecast 2020-2030
5.9.4 Rest of Europe Coal Bed Methane Submarket, By Forecast 2020-2030
5.10 China Coal Bed Methane Market Forecast, 2020-2030
5.10.1 China Coal Bed Methane Submarket, By Application Forecast 2020-2030
5.10.2 China Coal Bed Methane Submarket, By Drilling Type Forecast 2020-2030
5.10.3 China Coal Bed Methane Submarket, By Type Forecast 2020-2030
5.10.4 China Coal Bed Methane Submarket, By Forecast 2020-2030
5.11 India Coal Bed Methane Market Forecast, 2020-2030
5.11.1 India Coal Bed Methane Submarket, By Application Forecast 2020-2030
5.11.2 India Coal Bed Methane Submarket, By Drilling Type Forecast 2020-2030
5.11.3 India Coal Bed Methane Submarket, By Type Forecast 2020-2030
5.11.4 India Coal Bed Methane Submarket, By Forecast 2020-2030
5.12 Japan Coal Bed Methane Market Forecast, 2020-2030
5.12.1 Japan Coal Bed Methane Submarket, By Application Forecast 2020-2030
5.12.2 Japan Coal Bed Methane Submarket, By Drilling Type Forecast 2020-2030
5.12.3 Japan Coal Bed Methane Submarket, By Type Forecast 2020-2030
5.12.4 Japan Coal Bed Methane Submarket, By Forecast 2020-2030
5.13 Australia & New Zealand Coal Bed Methane Market Forecast, 2020-2030
5.13.1 Australia & New Zealand Coal Bed Methane Submarket, By Application Forecast 2020-2030
5.13.2 Australia & New Zealand Coal Bed Methane Submarket, By Drilling Type Forecast 2020-2030
5.13.3 Australia & New Zealand Coal Bed Methane Submarket, By Type Forecast 2020-2030
5.13.4 Australia & New Zealand Coal Bed Methane Submarket, By Forecast 2020-2030
5.14 Rest of Asia-Pacific Coal Bed Methane Market Forecast, 2020-2030
5.14.1 Rest of Asia-Pacific Coal Bed Methane Submarket, By Application Forecast 2020-2030
5.14.2 Rest of Asia-Pacific Coal Bed Methane Submarket, By Drilling Type Forecast 2020-2030
5.14.3 Rest of Asia-Pacific Coal Bed Methane Submarket, By Type Forecast 2020-2030
5.14.4 Rest of Asia-Pacific Coal Bed Methane Submarket, By Forecast 2020-2030
5.15 Latin America Coal Bed Methane Market Forecast, 2020-2030
5.15.1 Latin America Coal Bed Methane Submarket, By Application Forecast 2020-2030
5.15.2 Latin America Coal Bed Methane Submarket, By Drilling Type Forecast 2020-2030
5.15.3 Latin America Coal Bed Methane Submarket, By Type Forecast 2020-2030
5.15.4 Latin America Coal Bed Methane Submarket, By Forecast 2020-2030
5.16 Middle East Coal Bed Methane Market Forecast, 2020-2030
5.16.1 Middle East Coal Bed Methane Submarket, By Application Forecast 2020-2030
5.16.2 Middle East Coal Bed Methane Submarket, By Drilling Type Forecast 2020-2030
5.16.3 Middle East Coal Bed Methane Submarket, By Type Forecast 2020-2030
5.16.4 Middle East Coal Bed Methane Submarket, By Forecast 2020-2030
5.17 Africa Coal Bed Methane Market Forecast, 2020-2030
5.17.1 Africa Coal Bed Methane Submarket, By Application Forecast 2020-2030
5.17.2 Africa Coal Bed Methane Submarket, By Drilling Type Forecast 2020-2030
5.17.3 Africa Coal Bed Methane Submarket, By Type Forecast 2020-2030
5.17.4 Africa Coal Bed Methane Submarket, By Forecast 2020-2030
7. Leading Companies in The Coal Bed Methane Market
7.1 Santos Ltd.
7.1.1 Santos Ltd. Products and Services
7.1.2 Analysis of Santos Ltd. within the Coal Bed Methane Market
7.1.3 Santos Ltd. M&A Activity
7.1.4 Future Outlook for Santos Ltd.
7.1.5 Santos Ltd. Projects
7.1 Origin Energy
7.1.1 Origin Energy Products and Services
7.1.2 Analysis of Origin Energy within the Coal Bed Methane Market
7.1.3 Origin Energy M&A Activity
7.1.4 Future Outlook for Origin Energy
7.1.5 Origin Energy Projects
7.1 Great Eastern Energy
7.1.1 Great Eastern Energy Products and Services
7.1.2 Analysis of Great Eastern Energy within the Coal Bed Methane Market
7.1.3 Great Eastern Energy M&A Activity
7.1.4 Future Outlook for Great Eastern Energy
7.1.5 Great Eastern Energy Projects
7.1 BG Group (Royal Dutch Shell PLC.)
7.1.1 BG Group (Royal Dutch Shell PLC.) Products and Services
7.1.2 Analysis of BG Group (Royal Dutch Shell PLC.) within the Coal Bed Methane Market
7.1.3 BG Group (Royal Dutch Shell PLC.) M&A Activity
7.1.4 Future Outlook for BG Group (Royal Dutch Shell PLC.)
7.1.5 BG Group (Royal Dutch Shell PLC.) Projects
7.1 Arrow Energy
7.1.1 Arrow Energy Products and Services
7.1.2 Analysis of Arrow Energy within the Coal Bed Methane Market
7.1.3 Arrow Energy M&A Activity
7.1.4 Future Outlook for Arrow Energy
7.1.5 Arrow Energy Projects
7.1 Dart Energy
7.1.1 Dart Energy Products and Services
7.1.2 Analysis of Dart Energy within the Coal Bed Methane Market
7.1.3 Dart Energy M&A Activity
7.1.4 Future Outlook for Dart Energy
7.1.5 Dart Energy Projects
7.1 Baker Hughes
7.1.1 Baker Hughes Products and Services
7.1.2 Analysis of Baker Hughes within the Coal Bed Methane Market
7.1.3 Baker Hughes M&A Activity
7.1.4 Future Outlook for Baker Hughes
7.1.5 Baker Hughes Projects
7.1 PetroChina
7.1.1 PetroChina Products and Services
7.1.2 Analysis of PetroChina within the Coal Bed Methane Market
7.1.3 PetroChina M&A Activity
7.1.4 Future Outlook for PetroChina
7.1.5 PetroChina Projects
7.1 Petronas
7.1.1 Petronas Products and Services
7.1.2 Analysis of Petronas within the Coal Bed Methane Market
7.1.3 Petronas M&A Activity
7.1.4 Future Outlook for Petronas
7.1.5 Petronas Projects
7.1 Encana Corporation
7.1.1 Encana Corporation Products and Services
7.1.2 Analysis of Encana Corporation within the Coal Bed Methane Market
7.1.3 Encana Corporation M&A Activity
7.1.4 Future Outlook for Encana Corporation
7.1.5 Encana Corporation Projects
7.1 Concophillips
7.1.1 Concophillips Products and Services
7.1.2 Analysis of Concophillips within the Coal Bed Methane Market
7.1.3 Concophillips M&A Activity
7.1.4 Future Outlook for Concophillips
7.1.5 Concophillips Projects
8. Conclusions and Recommendations
8.1 Global Coal Bed Methane Market Outlook
8.2 Recommendations
9. Glossary
Associated Visiongain Reports
Visiongain Report Sales Order Form
Appendix A
About Visiongain
Appendix B
Visiongain Report Evaluation Form
List of Tables
Table 1.0 Key Highlights
Table 3.1 PEST Analysis, Coal Bed Methane Market
Table 3.2 SWOT Analysis
Table 4.1 Global Coal Bed Methane Market Forecast 2020-2030 ($Bn, AGR %, CAGR %, Cumulative)
Table 4.2 Global Coal Bed Methane Submarket, By Application Forecast 2020-2030 ($billion, AGR %, Cumulative)
Table 4.3 Global Coal Bed Methane Submarket, By Type Forecast 2020-2030 ($billion, AGR %, Cumulative)
Table 4.4 Global Coal Bed Methane Submarket, By Forecast 2020-2030 ($billion, AGR %, Cumulative)
Table 5.1 Global Coal Bed Methane Market, by Country/Region Forecast 2020-2030 ($billion, AGR %, Cumulative)
Table 5.2 Global Coal Bed Methane Market, by Country/Region Forecast 2020-2030 ($billion, AGR %, Cumulative)
Table 5.3 Canada Coal Bed Methane Market Forecast 2020-2030 ($billion, , AGR %, CAGR %, Cumulative)
Table 5.4 Canada Coal Bed Methane Submarket, By Application Forecast 2020-2030 ($billion, AGR %, Cumulative)
Table 5.5 Canada Coal Bed Methane Submarket, By Drilling Type Forecast 2020-2030 ($billion, AGR %, Cumulative)
Table 5.6 US Coal Bed Methane Market Submarket, By Type Forecast 2020-2030 ($billion, , AGR %, CAGR %, Cumulative)
Table 5.7 US Coal Bed Methane Submarket, By Application Forecast 2020-2030 ($billion, AGR %, Cumulative)
Table 5.8 US Coal Bed Methane Submarket, By Drilling Type Forecast 2020-2030 ($billion, AGR %, Cumulative)
Table 5.9 Latin America Coal Bed Methane Market Forecast 2020-2030 ($billion, , AGR %, CAGR %, Cumulative)
Table 5.10 Latin America Coal Bed Methane Submarket, By Application Forecast 2020-2030 ($billion, AGR %, Cumulative)
Table 5.11 Latin America Coal Bed Methane Submarket, By Drilling Type Forecast 2020-2030 ($billion, AGR %, Cumulative)
Table 5.12 Germany Coal Bed Methane Market Submarket, By Type Forecast 2020-2030 ($billion, , AGR %, CAGR %, Cumulative)
Table 5.13 Germany Coal Bed Methane Submarket, By Application Forecast 2020-2030 ($billion, AGR %, Cumulative)
Table 5.14 Germany Coal Bed Methane Submarket, By Drilling Type Forecast 2020-2030 ($billion, AGR %, Cumulative)
Table 5.15 UK Coal Bed Methane Market Submarket, By Type Forecast 2020-2030 ($billion, , AGR %, CAGR %, Cumulative)
Table 5.16 UK Coal Bed Methane Submarket, By Application Forecast 2020-2030 ($billion, AGR %, Cumulative)
Table 5.17 UK Coal Bed Methane Submarket, By Drilling Type Forecast 2020-2030 ($billion, AGR %, Cumulative)
Table 5.18 Spain Coal Bed Methane Market Submarket, By Type Forecast 2020-2030 ($billion, , AGR %, CAGR %, Cumulative)
Table 5.19 Spain Coal Bed Methane Submarket, By Application Forecast 2020-2030 ($billion, AGR %, Cumulative)
Table 5.20 Spain Coal Bed Methane Submarket, By Drilling Type Forecast 2020-2030 ($billion, AGR %, Cumulative)
Table 5.21 UK Coal Bed Methane Submarket, By Type Forecast 2020-2030 ($billion, , AGR %, CAGR %, Cumulative)
Table 5.22 UK Coal Bed Methane Submarket, By Application Forecast 2020-2030 ($billion, AGR %, Cumulative)
Table 5.23 UK Coal Bed Methane Submarket, By Drilling Type Forecast 2020-2030 ($billion, AGR %, Cumulative)
Table 5.24 China Coal Bed Methane Submarket, By Type Forecast 2020-2030 ($billion, , AGR %, CAGR %, Cumulative)
Table 5.25 China Coal Bed Methane Submarket, By Application Forecast 2020-2030 ($billion, AGR %, Cumulative)
Table 5.26 China Coal Bed Methane Submarket, By Drilling Type Forecast 2020-2030 ($billion, AGR %, Cumulative)
Table 5.27 Australia Coal Bed Methane Submarket, By Type Forecast 2020-2030 ($billion, , AGR %, CAGR %, Cumulative)
Table 5.28 Australia Coal Bed Methane Submarket, By Application Forecast 2020-2030 ($billion, AGR %, Cumulative)
Table 5.29 Australia Coal Bed Methane Submarket, By Drilling Type Forecast 2020-2030 ($billion, AGR %, Cumulative)
Table 5.30 South Korea Coal Bed Methane Submarket, By Type Forecast 2020-2030 ($billion, , AGR %, CAGR %, Cumulative)
Table 5.31 South Korea Coal Bed Methane Submarket, By Application Forecast 2020-2030 ($billion, AGR %, Cumulative)
Table 5.32 South Korea Coal Bed Methane Submarket, By Drilling Type Forecast 2020-2030 ($billion, AGR %, Cumulative)
Table 5.33 Japan Coal Bed Methane Submarket, By Type Forecast 2020-2030 ($billion, , AGR %, CAGR %, Cumulative)
Table 5.34 Japan Coal Bed Methane Submarket, By Application Forecast 2020-2030 ($billion, AGR %, Cumulative)
Table 5.35 Japan Coal Bed Methane Submarket, By Drilling Type Forecast 2020-2030 ($billion, AGR %, Cumulative)
Table 5.36 India Coal Bed Methane Submarket, By Type Forecast 2020-2030 ($billion, , AGR %, CAGR %, Cumulative)
Table 5.37 India Coal Bed Methane Submarket, By Application Forecast 2020-2030 ($billion, AGR %, Cumulative)
Table 5.38 India Coal Bed Methane Submarket, By Drilling Type Forecast 2020-2030 ($billion, AGR %, Cumulative)
Table 5.39 Middle East Coal Bed Methane Submarket, By Type Forecast 2020-2030 ($billion, , AGR %, CAGR %, Cumulative)
Table 5.40 Middle East Coal Bed Methane Submarket, By Application Forecast 2020-2030 ($billion, AGR %, Cumulative)
Table 5.41 Middle East Coal Bed Methane Submarket, By Drilling Type Forecast 2020-2030 ($billion, AGR %, Cumulative)
Table 5.42 Rest of Asia-Pacific Coal Bed Methane Submarket, By Type Forecast 2020-2030 ($billion , , AGR %, CAGR %, Cumulative)
Table 5.43 Rest of Asia-Pacific Coal Bed Methane Submarket, By Application Forecast 2020-2030 ($billion , AGR %, Cumulative)
Table 5.44 Rest of Asia-Pacific Coal Bed Methane Submarket, By Drilling Type Forecast 2020-2030 ($billion , AGR %, Cumulative)
Table 5.45 Rest of Europe Coal Bed Methane Submarket, By Type Forecast 2020-2030 ($billion, , AGR %, CAGR %, Cumulative)
Table 5.46 Rest of Europe Coal Bed Methane Submarket, By Application Forecast 2020-2030 ($billion, AGR %, Cumulative)
Table 5.47 Rest of Europe Coal Bed Methane Submarket, By Drilling Type Forecast 2020-2030 ($billion, AGR %, Cumulative)
Table 5.48 Africa Coal Bed Methane Submarket, By Type Forecast 2020-2030 ($billion, , AGR %, CAGR %, Cumulative)
Table 5.49 Africa Coal Bed Methane Submarket, By Application Forecast 2020-2030 ($billion, AGR %, Cumulative)
Table 5.50 Africa Coal Bed Methane Submarket, By Drilling Type Forecast 2020-2030 ($billion, AGR %, Cumulative)
Table 5.51 Spain Coal Bed Methane Submarket, By Type Forecast 2020-2030 ($billion , , AGR %, CAGR %, Cumulative)
Table 5.52 Spain Coal Bed Methane Submarket, By Application Forecast 2020-2030 ($billion , AGR %, Cumulative)
Table 5.53 Spain Coal Bed Methane Submarket, By Drilling Type Forecast 2020-2030 ($billion , AGR %, Cumulative)
Table 7.1 Santos Ltd. Profile 2019 (Market Entry, Public/Private, Headquarters, Geography, Key Market, Listed on, Products/Services
Table 7.2 Santos Ltd. Profile 2019 (Market Entry, Public/Private, Headquarter, Total Company Revenue $billion, Change in Revenue, Geography, Key Market, Listed on, Products/Services)
Table 7.3 Santos Ltd. Products and Services (Product/Service, Notes)
Table 7.4 Santos Ltd. Total Company Sales 2015-2019 (US$billion, AGR %)
Table 7.5 Santos Ltd. Total Company Recent Development 2015-2019
Table 7.6 Origin Energy Profile 2019 (Market Entry, Public/Private, Headquarter, Total Company Revenue $billion, Change in Revenue, Geography, Key Market, Listed on, Products/Services)
Table 7.7 Origin Energy Products and Services (Product/Service, Notes)
Table 7.8 Origin Energy Total Company Sales 2015-2019 (US$billion, AGR %)
Table 7.9 Origin Energy Total Company Recent Development 2015-2019
Table 7.10 Great Eastern Energy Profile 2019 (Market Entry, Public/Private, Headquarter, Total Company Revenue $billion, Change in Revenue, Geography, Key Market, Listed on, Products/Services)
Table 7.11 Great Eastern Energy Products and Services (Product/Service, Notes)
Table 7.12 Great Eastern Energy Total Company Sales 2015-2019 (US$billion, AGR %)
Table 7.13 Great Eastern Energy Total Company Recent Development 2015-2019
Table 7.14 BG Group (Royal Dutch Shell PLC.) Profile 2019 (Market Entry, Public/Private, Headquarter, Total Company Revenue $billion, Change in Revenue, Geography, Key Market, Listed on, Products/Services)
Table 7.15 BG Group (Royal Dutch Shell PLC.) Products and Services (Product/Service, Notes)
Table 7.16 BG Group (Royal Dutch Shell PLC.) Total Company Sales 2015-2019 (US$billion, AGR %)
Table 7.17 BG Group (Royal Dutch Shell PLC.) Total Company Recent Development 2015-2019
Table 7.18 Arrow Energy Profile 2019 (Market Entry, Public/Private, Headquarter, Total Company Revenue $billion, Change in Revenue, Geography, Key Market, Listed on, Products/Services)
Table 7.19 Arrow Energy Products and Services (Product/Service, Notes)
Table 7.20 Arrow Energy Total Company Sales 2015-2019 (US$billion, AGR %)
Table 7.21 Arrow Energy Total Company Recent Development 2015-2019
Table 7.22 Dart Energy Profile 2019 (Market Entry, Public/Private, Headquarter, Total Company Revenue $billion, Change in Revenue, Geography, Key Market, Listed on, Products/Services)
Table 7.23 Dart Energy Products and Services (Product/Service, Notes)
Table 7.24 Dart Energy Total Company Sales 2015-2019 (US$billion, AGR %)
Table 7.25 Dart Energy Total Company Recent Development 2015-2019
Table 7.26 Baker Hughes Profile 2019 (Market Entry, Public/Private, Headquarter, Total Company Revenue $billion, Change in Revenue, Geography, Key Market, Listed on, Products/Services)
Table 7.27 Baker Hughes Products and Services (Product/Service, Notes)
Table 7.28 Baker Hughes Total Company Sales 2015-2019 (US$billion, AGR %)
Table 7.29 Baker Hughes Total Company Recent Development 2015-2019
Table 7.30 PetroChina Profile 2019 (Market Entry, Public/Private, Headquarter, Total Company Revenue $billion, Change in Revenue, Geography, Key Market, Listed on, Products/Services)
Table 7.31 PetroChina Products and Services (Product/Service, Notes)
Table 7.32 PetroChina Total Company Sales 2015-2019 (US$billion, AGR %)
Table 7.33 PetroChina Total Company Recent Development 2015-2019
Table 7.34 Petronas Profile 2019 (Market Entry, Public/Private, Headquarter, Total Company Revenue $billion, Change in Revenue, Geography, Key Market, Listed on, Products/Services)
Table 7.35 Petronas Products and Services (Product/Service, Notes)
Table 7.36 Petronas Total Company Sales 2015-2019 (US$billion, AGR %)
Table 7.37 Petronas Total Company Recent Development 2015-2019
Table 7.38 Encana Corporation Profile 2019 (Market Entry, Public/Private, Headquarter, Total Company Revenue $billion, Change in Revenue, Geography, Key Market, Listed on, Products/Services)
Table 7.39 Encana Corporation Products and Services (Product/Service, Notes)
Table 7.40 Encana Corporation Total Company Sales 2015-2019 (US$billion, AGR %)
Table 7.41 Encana Corporation Total Company Recent Development 2015-2019
Table 7.42 Concophillips Profile 2019 (Market Entry, Public/Private, Headquarter, Total Company Revenue $billion, Change in Revenue, Geography, Key Market, Listed on, Products/Services)
Table 7.43 Concophillips Products and Services (Product/Service, Notes)
Table 7.44 Concophillips Total Company Sales 2015-2019 (US$billion, AGR %)
Table 7.45 Concophillips Total Company Recent Development 2015-2019
List of Figures
Figure 1.1 Global Coal Bed Methane Market Segmentation
Figure 2.1 Coal Bed Methane Value Chain Analysis
Figure 3.1 Coal Bed Methane Supply-Demand Analysis
Figure 4.1 Global Coal Bed Methane Forecast 2020-2030 ($billion, AGR %)
Figure 4.2 Global Coal Bed Methane Market Forecast 2020-2030
Figure 4.3 Global Coal Bed Methane Submarket Forecast by 2020-2030 ($ billion)
Figure 4.4 Global Coal Bed Methane Market By Application Share Forecast 2020, 2025, 2030 (% Share)
Figure 4.19 Global Coal Bed Methane by Submarket By Application Forecast 2020-2030 ($ million)
Figure 4.20 Global Coal Bed Methane Market, by Share Forecast 2020, 2025, 2030 (% Share)
Figure 4.21 Coal Bed Methane Market, By Application Forecast 2020-2030 ($billion, AGR%)
Figure 4.23 Coal Bed Methane Market, By Application Forecast 2020-2030 ($billion, AGR%)
Figure 4.25 Coal Bed Methane Market, By Application Forecast 2020-2030 ($billion, AGR%)
Figure 4.27 Coal Bed Methane Market, By Application Forecast 2020-2030 ($billion, AGR%)
Figure 5.1 Regional/Country Coal Bed Methane Market, by 2020-2030
Figure 5.3 Leading Country/Regional Coal Bed Methane Market Share, by 2020
Figure 5.4 Leading Country/Regional Coal Bed Methane Market Share, by 2025
Figure 5.5 Leading Country/Regional Coal Bed Methane Market Share, by 2030
Figure 5.6 Canada Coal Bed Methane Market Forecast 2020-2030 ($billion, AGR%)
Figure 5.7 Canada Coal Bed Methane Market, by Forecast 2020-2030
Figure 5.8 Canada Coal Bed Methane Submarket, By Application Forecast 2020-2030
Figure 5.9 Canada Coal Bed Methane Submarket , By Drilling Type Forecast 2020-2030
Figure 5.10 Canada Coal Bed Methane Submarket , By Type 2020-2030 ($billion, AGR%)
Figure 5.10 U.S. Coal Bed Methane Market Forecast 2020-2030 ($billion, AGR%)
Figure 5.11 U.S. Coal Bed Methane Market, by Forecast 2020-2030
Figure 5.12 U.S. Coal Bed Methane Submarket, By Application Forecast 2020-2030
Figure 5.13 U.S. Coal Bed Methane Submarket , By Drilling Type Forecast 2020-2030
Figure 5.13 U.S. Coal Bed Methane Submarket , By Type Forecast 2020-2030
Figure 5.14 Latin America Coal Bed Methane Market Forecast 2020-2030 ($billion , AGR%)
Figure 5.15 Latin America Coal Bed Methane Market, by Forecast 2020-2030
Figure 5.16 Latin America Coal Bed Methane Submarket, By Application Forecast 2020-2030
Figure 5.17 Latin America Coal Bed Methane Submarket , By Drilling Type Forecast 2020-2030
Figure 5.17 Latin America Coal Bed Methane Submarket , By Type Forecast 2020-2030
Figure 5.18 Germany Coal Bed Methane Market Forecast 2020-2030 ($billion, AGR%)
Figure 5.19 Germany Coal Bed Methane Market, by Forecast 2020-2030
Figure 5.20 Germany Coal Bed Methane Submarket, By Application Forecast 2020-2030
Figure 5.21 Germany Coal Bed Methane Submarket , By Drilling Type Forecast 2020-2030
Figure 5.21 Germany Coal Bed Methane Submarket , By Type Forecast 2020-2030
Figure 5.22 U.K. Coal Bed Methane Market Forecast 2020-2030 ($billion, AGR%)
Figure 5.23 U.K. Coal Bed Methane Market, by Forecast 2020-2030
Figure 5.24 U.K. Coal Bed Methane Submarket, By Application Forecast 2020-2030
Figure 5.25 U.K. Coal Bed Methane Submarket , By Drilling Type Forecast 2020-2030
Figure 5.25 U.K. Coal Bed Methane Submarket , By Type Forecast 2020-2030
Figure 5.26 Spain Coal Bed Methane Market Forecast 2020-2030 ($billion, AGR%)
Figure 5.27 Spain Coal Bed Methane Market, by Forecast 2020-2030
Figure 5.28 Spain Coal Bed Methane Submarket, By Application Forecast 2020-2030
Figure 5.29 Spain Coal Bed Methane Submarket , By Drilling Type Forecast 2020-2030
Figure 5.30 UK Coal Bed Methane Market Forecast 2020-2030 ($billion, AGR%)
Figure 5.31 UK Coal Bed Methane Market, by Forecast 2020-2030
Figure 5.32 UK Coal Bed Methane Submarket, By Application Forecast 2020-2030
Figure 5.33 UK Coal Bed Methane Submarket , By Drilling Type Forecast 2020-2030
Figure 5.34 China Coal Bed Methane Market Forecast 2020-2030 ($billion, AGR%)
Figure 5.35 China Coal Bed Methane Submarket , By Type, by Forecast 2020-2030
Figure 5.36 China Coal Bed Methane Submarket, By Application Forecast 2020-2030
Figure 5.37 China Coal Bed Methane Submarket , By Drilling Type Forecast 2020-2030
Figure 5.38 Australia Coal Bed Methane Market Forecast 2020-2030 ($billion, AGR%)
Figure 5.39 Australia Coal Bed Methane Submarket , By Type, by Forecast 2020-2030
Figure 5.40 Australia Coal Bed Methane Submarket, By Application Forecast 2020-2030
Figure 5.41 Australia Coal Bed Methane Submarket , By Drilling Type Forecast 2020-2030
Figure 5.42 South Korea Coal Bed Methane Market Forecast 2020-2030 ($billion, AGR%)
Figure 5.43 South Korea Coal Bed Methane Submarket , By Type, by Forecast 2020-2030
Figure 5.44 South Korea Coal Bed Methane Submarket, By Application Forecast 2020-2030
Figure 5.45 South Korea Coal Bed Methane Submarket , By Drilling Type Forecast 2020-2030
Figure 5.46 Japan Coal Bed Methane Market Forecast 2020-2030 ($billion, AGR%)
Figure 5.47 Japan Coal Bed Methane Submarket , By Type, by Forecast 2020-2030
Figure 5.48 Japan Coal Bed Methane Submarket, By Application Forecast 2020-2030
Figure 5.49 Japan Coal Bed Methane Submarket , By Drilling Type Forecast 2020-2030
Figure 5.50 India Coal Bed Methane Market Forecast 2020-2030 ($billion, AGR%)
Figure 5.51 India Coal Bed Methane Submarket , By Type, by Forecast 2020-2030
Figure 5.52 India Coal Bed Methane Submarket, By Application Forecast 2020-2030
Figure 5.53 India Coal Bed Methane Submarket , By Drilling Type Forecast 2020-2030
Figure 5.54 Middle East Coal Bed Methane Market Forecast 2020-2030 ($billion, AGR%)
Figure 5.55 Middle East Coal Bed Methane Submarket , By Type, by Forecast 2020-2030
Figure 5.56 Middle East Coal Bed Methane Submarket, By Application Forecast 2020-2030
Figure 5.57 Middle East Coal Bed Methane Submarket , By Drilling Type Forecast 2020-2030
Figure 5.70 Rest of the World Coal Bed Methane Market Forecast 2020-2030 ($billion , AGR%)
Figure 5.71 Rest of the World Coal Bed Methane Submarket , By Type, by Forecast 2020-2030
Figure 5.72 Rest of the World Coal Bed Methane Submarket, By Application Forecast 2020-2030
Figure 5.73 Rest of the World Coal Bed Methane Submarket , By Drilling Type Forecast 2020-2030
Figure 7.1 Santos Ltd. Total Company Sales 2013-2019 (US$ million, AGR %)
Figure 7.2 Origin Energy Total Company Sales 2013-2019 (US$ million, AGR %)
Figure 7.3 Great Eastern Energy Total Company Sales 2013-2019 (US$ Bn, AGR %)
Figure 7.6 BG Group (Royal Dutch Shell PLC.) Company Sales 2013-2019 (US$ bn, AGR %)
Figure 7.7 BG Group (Royal Dutch Shell PLC.) Revenue % Share, by Type Segment, 2019
Figure 7.8 BG Group (Royal Dutch Shell PLC.) Revenue % Share, by Geographical Trade, 2019
Figure 7.9 BG Group (Royal Dutch Shell PLC.) Revenue % Share, by Business Segment, 2019
Figure 7.10 Arrow Energy Revenue % Share, by Geographic Segment, 2019
Figure 7.11 Dart Energy Company Total Company Sales 2013-2019 (US$ million, AGR %)
Figure 7.12 Baker Hughes Total Company Sales 2013-2019 (US$ million, AGR %)
Figure 7.13 Baker Hughes Revenue % Share, by Regional Segment, 2019
Figure 7.14 PetroChina Total Company Sales 2013-2019 (US$ million, AGR %)
Figure 7.15 PetroChina Revenue % Share, by Regional Segment, 2019
Figure 7.16 PetroChina Revenue % Share, by Business Segment, 2019
Figure 7.17 Petronas Total Company Sales 2013-2019 (US$ bn, AGR %)
Figure 7.18 Encana Corporation Total Company Revenue 2013-2019 (US$ bn, AGR %)
Figure 7.19 Encana Corporation Company Sales 2014-2019 (US$ bn, AGR %)
Figure 7.20 Encana Corporation Revenue % Share, by Business Segment, 2019


