Industries > Energy > Big Data Analytics for Oil & Gas Market Report 2017-2027

Big Data Analytics for Oil & Gas Market Report 2017-2027
Forecasts by Sector (Upstream, Midstream, Downstream), by Type (Hardware, Software, Services) and by Key National Markets, with Leading Company Profiles Plus Analysis Of Environment, Health, and Safety (EH&S), Exploration & Production (E&P), Risk Prevention, Operational Optimization, Drilling Optimization, Asset Maintenance, Production Optimization and Other Factors
• Do you need definitive Big Data (Analytics) for Oil & Gas market data?
• Succinct analysis of big data analytics in the context of Oil & Gas?
• Insight?
• Clear competitor analysis?
• Actionable recommendations?
Read on to discover how this definitive report can transform your own research and save you time
Continued industry interest in the application of big data analytics to the Oil & Gas sector has led Visiongain to publish this timey report. The $7.5bn Big Data (Analytics) for Oil & Gas market is expected to flourish in the next few years because of the sheer applicability of big data-led insights in the oil & gas industry. If you want to be part of this growing aspect of the oil & gas industry, then read on to discover how you can maximise your investment potential.
Report highlights
• 135+ quantitative tables, charts, and graphs
• Analysis of key players in Big Data (Analytics) for Oil & Gas technologies
• Accenture PLC
• Cap Gemini S.A.
• Deloitte Development LLC.
• Drillinginfo, Inc.
• Hitachi Data Systems Corporation
• International Business Machines Corporation (IBM)
• Microsoft Corporation
• Oracle Corporation
• SAP SE
• TIBCO Software Inc.
• Global Big Data (Analytics) for Oil & Gas market outlook and analysis from 2017-2027
• An interview with a key industry expert
• Big Data (Analytics) for Oil & Gas submarket forecasts and analysis from 2017-2027
• By sector
– Upstream
– Midstream
– Downstream
• By Type
– Hardware
– Software
– Services
• National Big Data (Analytics) for Oil & Gas market forecasts from 2017-2027
• U.S. forecast 2017-2027,
• Canada forecast 2017-2027
• Russia forecast 2017-2027
• U.K. forecast 2017-2027
• Norway forecast 2017-2027
• Rest of Europe forecast 2017-2027
• China forecast 2017-2027
• Indonesia forecast 2017-2027
• Rest of Asia Pacific forecast 2017-2027
• GCC forecast 2017-2027
• South Africa forecast 2017-2027
• Rest of Middle East & Africa forecast 2017-2027
• Brazil forecast 2017-2027
• Venezuela forecast 2017-2027
• Rest of Latin America forecast 2017-2027
– Including an overall regional forecast table for North America, Europe, Asia Pacific, Middle East & Africa, Latin America
• Key questions answered
• What does the future hold for the Big Data (Analytics) for Oil & Gas industry?
• What industry trends should you be aware of?
• Which submarkets will see higher growth rates?
• Which national markets will see high growth rates?
• Target audience
• Anyone within the Big Data (Analytics) for Oil & Gas value chain
• Leading Big Data (Analytics) for Oil & Gas companies
• Suppliers
• Contractors
• Technologists
• R&D staff
• Consultants
• Analysts
• CEO’s
• CIO’s
• COO’s
• Business development managers
• Investors
• Governments
• Agencies
• Industry organisations
• Banks
Visiongain is a trading partner with the US Federal Government
CCR Ref number: KD4R6
1. Report Overview
1.1 Global Big Data (Analytics) for Oil & Gas Market Overview
1.2 Market Structure Overview and Market Definition
1.3 Why You Should Read This Report
1.4 How This Report Delivers
1.5 Key Questions Answered by This Analytical Report Include:
1.6 Who is This Report For?
1.7 Methodology
1.7.1 Primary Research
1.7.2 Secondary Research
1.7.3 Market Evaluation & Forecasting Methodology
1.8 Frequently Asked Questions (FAQ)
1.9 Associated Visiongain Reports
1.10 About Visiongain
2. Introduction to the Big Data (Analytics) for Oil & Gas Market
2.1 Big Data (Analytics) for Oil & Gas Market Structure
2.2 Big Data (Analytics) for Oil & Gas Market Definition
2.3 Big Data (Analytics) for oil & Gas Market, Industry Analysis
2.4 Big Data (Analytics) for Oil & Gas Market, Value Chain Analysis
3. Global Overview of Big Data (Analytics) for Oil & Gas Market
3.1 Global Big Data (Analytics) for Oil & Gas, Market Attractiveness Analysis
3.2 Global Big Data (Analytics) for Oil & Gas Market Drivers and Restraints
4. Big Data (Analytics) for Oil & Gas Submarkets Forecasts 2017-2027
4.1 Global Sector Type Big Data (Analytics) for Oil & Gas Submarkets Forecasts 2017-2027
4.1.1 Global Upstream Sector Big Data (Analytics) for Oil & Gas Forecasts 2017-2027
4.1.2 Global Midstream Sector Big Data (Analytics) for Oil & Gas Forecasts 2017-2027
4.1.3 Global Downstream Sector Big Data (Analytics) for Oil & Gas Forecasts 2017-2027
4.1.4 Sector Type Submarket Drivers and Restraints
4.2 Global Type Big Data (Analytics) for Oil & Gas Submarkets Forecasts 2017-2027
4.2.1 Global Hardware Type Big Data (Analytics) for Oil & Gas Forecasts 2017-2027
4.2.2 Global Software Type Big Data (Analytics) for Oil & Gas Forecasts 2017-2027
4.2.3 Global Services Type Big Data (Analytics) for Oil & Gas Forecasts 2017-2027
4.2.4 Type Submarket Driver and Restraints
5. Leading National Big Data (Analytics) for Oil & Gas Market Forecasts 2017-2027
Source: Visiongain 2017
Source: Visiongain 2017
5.1 The U.S. Big Data (Analytics) for Oil & Gas Market
5.1.1 U.S. Big Data (Analytics) for Oil & Gas Market Forecast 2017-2027
5.1.2 U.S. Big Data (Analytics) for Oil & Gas by Type Submarket Forecast 2017-2027
5.1.3 U.S. Big Data (Analytics) for Oil & Gas by Sector Submarket Forecast 2017-2027
5.1.4 U.S. Big Data (Analytics) for Oil & Gas Market Analysis
5.2 Canada Big Data (Analytics) for Oil & Gas Market
5.2.1 Canada Big Data (Analytics) for Oil & Gas Market Forecast 2017-2027
5.2.2 Canada Big Data (Analytics) for Oil & Gas by Type Submarket Forecast 2017-2027
5.2.3 Canada Big Data (Analytics) for Oil & Gas by Sector Submarket Forecast 2017-2027
5.2.4 Canada Big Data (Analytics) for Oil & Gas Market Analysis
5.3 Russia Big Data (Analytics) for Oil & Gas Market
5.3.1 Russia Big Data (Analytics) for Oil & Gas Market Forecast 2017-2027
5.3.2 Russia Big Data (Analytics) for Oil & Gas by Type Submarket Forecast 2017-2027
5.3.3 Russia Big Data (Analytics) for Oil & Gas by Sector Submarket Forecast 2017-2027
5.3.4 Russia Big Data (Analytics) for Oil & Gas Market Analysis
5.4 U.K. Big Data (Analytics) for Oil & Gas Market
5.4.1 U.K. Big Data (Analytics) for Oil & Gas Market Forecast 2017-2027
5.4.2 U.K. Big Data (Analytics) for Oil & Gas by Type Submarket Forecast 2017-2027
5.4.3 U.K. Big Data (Analytics) for Oil & Gas by Sector Submarket Forecast 2017-2027
5.4.4 U.K. Big Data (Analytics) for Oil & Gas Market Analysis
5.5 Norway Big Data (Analytics) for Oil & Gas Market
5.5.1 Norway Big Data (Analytics) for Oil & Gas Market Forecast 2017-2027
5.5.2 Norway Big Data (Analytics) for Oil & Gas by Type Submarket Forecast 2017-2027
5.5.3 Norway Big Data (Analytics) for Oil & Gas by Sector Submarket Forecast 2017-2027
5.5.4 Norway Big Data (Analytics) for Oil & Gas Market Analysis
5.6 Rest of Europe Big Data (Analytics) for Oil & Gas Market
5.6.1 Rest of Europe (Analytics) for Oil & Gas Market Forecast 2017-2027
5.6.2 Rest of Europe Big Data (Analytics) for Oil & Gas by Type Submarket Forecast 2017-2027
5.6.3 Rest of Europe Big Data (Analytics) for Oil & Gas by Sector Submarket Forecast 2017-2027
5.6.4 Rest of Europe Big Data (Analytics) for Oil & Gas Market Analysis
5.7 China Big Data (Analytics) for Oil & Gas Market
5.7.1 China Big Data (Analytics) for Oil & Gas Market Forecast 2017-2027
5.7.2 China Big Data (Analytics) for Oil & Gas by Type Submarket Forecast 2017-2027
5.5.3 China Big Data (Analytics) for Oil & Gas by Sector Submarket Forecast 2017-2027
5.7.4 China Big Data (Analytics) for Oil & Gas Market Analysis
5.8 Indonesia Big Data (Analytics) for Oil & Gas Market
5.8.1 Indonesia Big Data (Analytics) for Oil & Gas Market Forecast 2017-2027
5.8.2 Indonesia Big Data (Analytics) for Oil & Gas by Type Submarket Forecast 2017-2027
5.8.3 Indonesia Big Data (Analytics) for Oil & Gas by Sector Submarket Forecast 2017-2027
5.8.4 Indonesia Big Data (Analytics) for Oil & Gas Market Analysis
5.9 Rest of Asia Pacific Big Data (Analytics) for Oil & Gas Market
5.9.1 Rest of Asia Pacific Big Data (Analytics) for Oil & Gas Market Forecast 2017-2027
5.9.2 Rest of Asia Pacific Big Data (Analytics) for Oil & Gas by Type Submarket Forecast 2017-2027
5.9.3 Rest of Asia Pacific Big Data (Analytics) for Oil & Gas by Type Submarket Forecast 2017-2027
5.9.4 Rest of Asia Pacific Big Data (Analytics) for Oil & Gas Market Analysis
5.10 GCC Big Data (Analytics) for Oil & Gas Market
5.10.1 GCC Big Data (Analytics) for Oil & Gas Market Forecast 2017-2027
5.10.2 GCC Big Data (Analytics) for Oil & Gas by Type Submarket Forecast 2017-2027
5.10.3 GCC Big Data (Analytics) for Oil & Gas by Sector Submarket Forecast 2017-2027
5.10.4 GCC Big Data (Analytics) for Oil & Gas Market Analysis
5.11 South Africa Big Data (Analytics) for Oil & Gas Market
5.11.1 South Africa Big Data (Analytics) for Oil & Gas Market Forecast 2017-2027
5.11.2 South Africa Big Data (Analytics) for Oil & Gas by Type Submarket Forecast 2017-2027
5.11.3 South Africa Big Data (Analytics) for Oil & Gas by Type Submarket Forecast 2017-2027
5.11.4 South Africa Big Data (Analytics) for Oil & Gas Market Analysis
5.12 Rest of Middle East & Africa Big Data (Analytics) for Oil & Gas Market
5.12.1 Rest of Middle East Big Data (Analytics) for Oil & Gas Market Forecast 2017-2027
5.12.2 Rest of Middle East & Africa Big Data (Analytics) for Oil & Gas by Type Submarket Forecast 2017-2027
5.12.3 Rest of Middle East & Africa Big Data (Analytics) for Oil & Gas by Sector Submarket Forecast 2017-2027
5.12.4 Rest of Middle East & Africa Big Data (Analytics) for Oil & Gas Market Analysis
5.13 Brazil Big Data (Analytics) for Oil & Gas Market
5.13.1 Brazil Big Data (Analytics) for Oil & Gas Market Forecast 2017-2027
5.13.2 Brazil Big Data (Analytics) for Oil & Gas by Type Submarket Forecast 2017-2027
5.13.3 Brazil Big Data (Analytics) for Oil & Gas by Type Submarket Forecast 2017-2027
5.13.4 Brazil Big Data (Analytics) for Oil & Gas Market Analysis
5.14 Venezuela Big Data (Analytics) for Oil & Gas Market
5.14.1 Venezuela Big Data (Analytics) for Oil & Gas Market Forecast 2017-2027
5.14.2 Venezuela Big Data (Analytics) for Oil & Gas by Type Submarket Forecast 2017-2027
5.14.3 Venezuela Big Data (Analytics) for Oil & Gas by Sector Submarket Forecast 2017-2027
5.14.4 Venezuela Big Data (Analytics) for Oil & Gas Market Analysis
5.15 Rest of Latin America Big Data (Analytics) for Oil & Gas Market
5.15.1 Rest of Latin America Big Data (Analytics) for Oil & Gas Market Forecast 2017-2027
5.15.2 Rest of Latin America Big Data (Analytics) for Oil & Gas by Type Submarket Forecast 2017-2027
5.15.3 Rest of Latin America Big Data (Analytics) for Oil & Gas by Sector Submarket Forecast 2017-2027
5.15.4 Rest of Latin America Big Data (Analytics) for Oil & Gas Market Analysis
6. PESTEL Analysis of the Big Data (Analytics) for Oil & Gas Market
6.1 Political Impact of Big Data (Analytics) for Oil & Gas Market
6.2 Economical Impact of Big Data (Analytics) for Oil & Gas Market
6.3 Social Impact of Big Data (Analytics) for Oil & Gas Market
6.4 Technological Impact of Big Data (Analytics) for Oil & Gas Market
6.5 Environmental Impact of Big Data (Analytics) for Oil & Gas Market
6.6 Legal Impact of Big Data (Analytics) for Oil & Gas Market
7. Expert Opinion
7.1 Primary Correspondent
7.2 Estimated Market Revenue for Big Data
7.3 Big Data Drivers & Restraints
7.4 Big Data Solutions Utilized in Oil & Gas Industries
7.5 Key Petroleum Sector and Growth Rate
7.6 Leading Regions and Companies in the Natural Gas Storages Market
7.7 Overall Growth Rate, Globally
8. Leading Companies in Big Data (Analytics) for Oil & Gas Market
8.1 Cap Gemini S.A.
8.1.1 Business Overview
8.1.2 Recent Developments
8.1.3 Business Strategy
8.1.4 % Revenue Share, by Sector, 2015
8.1.5 % Revenue Share, by Region, 2015
8.1.6 Revenue 2011-2015
8.2 Accenture PLC
8.2.1 Business Overview
8.2.2 Recent Developments
8.2.3 Business Strategy
8.2.4 % Revenue Share, by Business Segment, 2015
8.2.5 % Revenue Share, by Regional Segment, 2015
8.2.6 Revenue, 2011-2015
8.3 Drillinginfo, Inc.
8.3.1 Business Overview
8.3.2 Recent Developments
8.3.3 Business Strategy
8.4 TIBCO Software Inc.
8.4.1 Business Overview
8.4.2 Recent Developments
8.4.3 Business Strategy
8.5 Oracle Corporation
8.5.1 Business Overview
8.5.2 Recent Developments
8.5.3 Business Strategy
8.5.4 Revenue, by Business Segment, 2015
8.5.5 Revenue, by Region, 2015
8.5.6 Revenue, 2011-2015
8.6 Hitachi Data Systems Corporation
8.6.1 Business Overview
8.6.2 Recent Developments
8.6.3 Business Strategy
8.7 Microsoft Corporation
Source: Visiongain 2017, Microsoft Corporation 2017
8.7.1 Business Overview
8.7.2 Recent Developments
8.7.3 Business Overview
8.7.4 Revenue by Business Segment, 2015
8.7.5 Revenue by Region, 2015
8.7.6 Revenue by Sales of Products & Services, 2015
8.7.7 Revenue, 2011-2015
8.8 Deloitte Development LLC.
8.8.1 Business Overview
8.8.2 Recent Developments
8.8.3 Business Strategy
8.9 SAP SE
8.9.1 Business Overview
8.9.2 Recent Developments
8.9.3 Business Strategy
8.9.4 Revenue by Industry Segment, 2015
8.9.5 Revenue by Regional Segment, 2015
8.9.6 Revenue by Business Segment, 2015
8.9.7 Revenue, 2011-2015
8.10 International Business Machines Corporation (IBM)
8.10.1 Business Overview
8.10.2 Recent Developments
8.10.3 Business Strategy
8.10.4 Revenue by Operating Segment, 2015
8.10.5 Revenue by Geography, 2015
8.10.6 Revenue, 2011-2015
8.11 Global Big Data (Analytics) for Oil & Gas Market, Company Market Share (%), 2015
9. Conclusion & Recommendations
10. Glossary
Associated Visiongain Reports
Visiongain Report Sales Order Form
Appendix A
About Visiongain
Appendix B
Visiongain report evaluation form
List of Tables
Table 1.1 Big Data (Analytics) for Oil & Gas Market by Regional Market Forecast 2017-2027 ($mn, AGR %, CAGR)
Table 3.1 Global Big Data (Analytics) for Oil & Gas Market, by Region Forecast 2017-2027 ($mn, AGR %, Cumulative)
Table 3.2 Global Big Data (Analytics) for Oil & Gas Market Drivers and Restraints
Table 4.1 Global Big Data (Analytics) for Oil & Gas Market, by Sector Type Forecast 2017-2027 ($mn, AGR %, Cumulative)
Table 4.2 Global Upstream Sector Big Data (Analytics) for Oil & Gas Market Forecast 2017-2027 ($mn, AGR %, CAGR %, Cumulative)
Table 4.3 Global Midstream Sector Big Data (Analytics) for Oil & Gas Market Forecast 2017-2027 ($mn, AGR %, CAGR %, Cumulative)
Table 4.4 Global Downstream Sector Big Data (Analytics) for Oil & Gas Market Forecast 2017-2027 ($mn, AGR %, CAGR %, Cumulative)
Table 4.5 Sector Type Submarket Drivers and Restraints
Table 4.6 Global Big Data (Analytics) for Oil & Gas Market, by Type Forecast 2017-2027 ($mn, AGR %, Cumulative)
Table 4.7 Global Big Data (Analytics) for Oil & Gas Market By Hardware Forecast 2017-2027 ($mn, AGR, CAGR, Cumulative)
Table 4.8 Global Big Data (Analytics) for Oil & Gas Market By Software Forecast 2017-2027 ($mn, AGR, CAGR, Cumulative)
Table 4.9 Global Big Data (Analytics) for Oil & Gas Market By Services Forecast 2017-2027 ($mn, AGR, CAGR, Cumulative)
Table 4.10 Type Submarket Drivers and Restraints
Table 5.0 Leading National Big Data (Analytics) for Oil & Gas Market Forecast 2017-2027 ($mn, CAGR %)
Table 5.1 U.S. Big Data (Analytics) for Oil & Gas Market Forecast 2017-2027 ($mn, AGR %, CAGR %, Cumulative)
Table 5.2 U.S. Big Data (Analytics) for Oil & Gas Market, by Type Forecast 2017-2027 ($mn, AGR %, Cumulative)
Table 5.3 U.S. Big Data (Analytics) for Oil & Gas Market, by Sector Forecast 2017-2027 ($mn, AGR %, CAGR %, Cumulative)
Table 5.4 Canada Big Data (Analytics) for Oil & Gas Market Forecast 2017-2027 ($mn, AGR %, CAGR %, Cumulative)
Table 5.5 Canada Big Data (Analytics) for Oil & Gas Market, by Type Forecast 2017-2027 ($mn, AGR %, Cumulative)
Table 5.6 Canada Big Data (Analytics) for Oil & Gas Market, by Sector Forecast 2017-2027 ($mn, AGR %, Cumulative)
Table 5.7 Russia Big Data (Analytics) for Oil & Gas Market Forecast 2017-2027 ($mn, AGR %, CAGR %, Cumulative)
Table 5.8 Russia Big Data (Analytics) for Oil & Gas Market, by Type Forecast 2017-2027 ($mn, AGR %, Cumulative)
Table 5.9 Russia Big Data (Analytics) for Oil & Gas Market, by Sector Forecast 2017-2027 ($mn, AGR %, Cumulative)
Table 5.10 U.K. Big Data (Analytics) for Oil & Gas Market Forecast 2017-2027 ($mn, AGR %, CAGR %, Cumulative)
Table 5.11 U.K. Big Data (Analytics) for Oil & Gas Market, by Type Forecast 2017-2027 ($mn, AGR %, CAGR %, Cumulative)
Table 5.12 U.K. Big Data (Analytics) for Oil & Gas Market, by Sector Forecast 2017-2027 ($mn, AGR %, Cumulative)
Table 5.13 Norway Big Data (Analytics) for Oil & Gas Market Forecast 2017-2027 ($mn, AGR %, CAGR %, Cumulative)
Table 5.14 Norway Big Data (Analytics) for Oil & Gas Market, by Type Forecast 2017-2027 ($mn, AGR %, Cumulative)
Table 5.15 Norway Big Data (Analytics) for Oil & Gas Market, by Sector Forecast 2017-2027 ($mn, AGR %, Cumulative)
Table 5.16 Rest of Europe Big Data (Analytics) for Oil & Gas Market Forecast 2017-2027 ($mn, AGR %, CAGR %, Cumulative)
Table 5.17 Rest of Europe Big Data (Analytics) for Oil & Gas Market, by Type Forecast 2017-2027 ($mn, AGR %, Cumulative)
Table 5.18 Rest of Europe Big Data (Analytics) for Oil & Gas Market, by Sector Forecast 2017-2027 ($mn, AGR %, Cumulative)
Table 5.19 China Big Data (Analytics) for Oil & Gas Market Forecast 2017-2027 ($mn, AGR %, CAGR %, Cumulative)
Table 5.20 China Big Data (Analytics) for Oil & Gas Market, by Type Forecast 2017-2027 ($mn, AGR %, Cumulative)
Table 5.21 China Big Data (Analytics) for Oil & Gas Market, by Sector Forecast 2017-2027 ($mn, AGR %, Cumulative)
Table 5.22 Indonesia Big Data (Analytics) for Oil & Gas Market Forecast 2017-2027 ($mn, AGR %, CAGR %, Cumulative)
Table 5.23 Indonesia Big Data (Analytics) for Oil & Gas Market, by Type Forecast 2017-2027 ($mn, AGR %, Cumulative)
Table 5.24 Indonesia Big Data (Analytics) for Oil & Gas Market, by Sector Forecast 2017-2027 ($mn, AGR %, Cumulative)
Table 5.25 Rest of Asia Pacific Big Data (Analytics) for Oil & Gas Market Forecast 2017-2027 ($mn, AGR %, CAGR %, Cumulative)
Table 5.26 Rest of Asia Pacific Big Data (Analytics) for Oil & Gas Market, by Type Forecast 2017-2027 ($mn, AGR %, Cumulative)
Table 5.27 Rest of Asia Pacific Big Data (Analytics) for Oil & Gas Market, by Sector Forecast 2017-2027 ($mn, AGR %, Cumulative)
Table 5.28 GCC Big Data (Analytics) for Oil & Gas Market Forecast 2017-2027 ($mn, AGR %, CAGR %, Cumulative)
Table 5.29 GCC Big Data (Analytics) for Oil & Gas Market, by Type Forecast 2017-2027 ($mn, AGR %, Cumulative)
Table 5.30 GCC Big Data (Analytics) for Oil & Gas Market, by Sector Forecast 2017-2027 ($mn, AGR %, Cumulative)
Table 5.31 South Africa Big Data (Analytics) for Oil & Gas Market Forecast 2017-2027 ($mn, AGR %, CAGR %, Cumulative)
Table 5.32 South Africa Big Data (Analytics) for Oil & Gas Market, by Type Forecast 2017-2027 ($mn, AGR %, Cumulative)
Table 5.33 South Africa Big Data (Analytics) for Oil & Gas Market, by Sector Forecast 2017-2027 ($mn, AGR %, Cumulative)
Table 5.34 Rest of Middle East & Africa Big Data (Analytics) for Oil & Gas Market Forecast 2017-2027 ($mn, AGR %, CAGR %, Cumulative)
Table 5.35 Rest of Middle East & Africa Big Data (Analytics) for Oil & Gas Market, by Type Forecast 2017-2027 ($mn, AGR %, Cumulative)
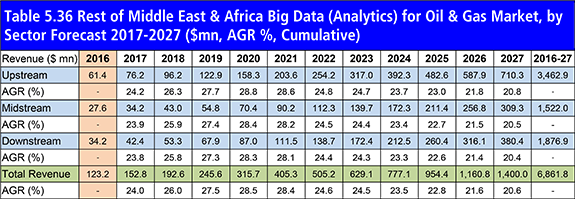
Table 5.36 Rest of Middle East & Africa Big Data (Analytics) for Oil & Gas Market, by Sector Forecast 2017-2027 ($mn, AGR %, Cumulative)
Table 5.37 Brazil Big Data (Analytics) for Oil & Gas Market Forecast 2017-2027 ($mn, AGR %, CAGR %, Cumulative)
Table 5.38 Brazil Big Data (Analytics) for Oil & Gas Market, by Type Forecast 2017-2027 ($mn, AGR %, Cumulative)
Table 5.39 Brazil Big Data (Analytics) for Oil & Gas Market, by Sector Forecast 2017-2027 ($mn, AGR %, Cumulative)
Table 5.40 Venezuela Big Data (Analytics) for Oil & Gas Market Forecast 2017-2027 ($mn, AGR %, CAGR %, Cumulative)
Table 5.41 Venezuela Big Data (Analytics) for Oil & Gas Market, by Type Forecast 2017-2027 ($mn, AGR %, Cumulative)
Table 5.42 Venezuela Big Data (Analytics) for Oil & Gas Market, by Sector Forecast 2017-2027 ($mn, AGR %, Cumulative)
Table 5.43 Rest of Latin America Big Data (Analytics) for Oil & Gas Market Forecast 2017-2027 ($mn, AGR %, CAGR %, Cumulative)
Table 5.44 Rest of Latin America Big Data (Analytics) for Oil & Gas Market, by Type Forecast 2017-2027 ($mn, AGR %, Cumulative)
Table 5.45 Rest of Latin America Big Data (Analytics) for Oil & Gas Market, by Sector Forecast 2017-2027 ($mn, AGR %, Cumulative)
Table 6.1 PESTEL Analysis, Big Data (Analytics) for Oil & Gas Market
Table 8.1 Cap Gemini S.A. Profile 2015(Founded, Public/Private, Headquarters, Number of Employees, 2015, Revenue in $ bn, 2016, Change in Revenue from 2015, Geography, Key Market, Listed On, Products/Services
Table 8.2 Cap Gemini S.A., Revenue 2011-2015 ($bn, AGR %)
Table 8.3 Accenture PLC Profile 2015 (Founded, Public/Private, Headquarters, Number of Employees, 2015, Revenue in $ bn, 2015, Change in Revenue, 2014, Geography, Key Market, Listed on, Products/Services)
Table 8.4 Accenture PLC, Revenue 2011-2015 ($bn, AGR %)
Table 8.5 Drillinginfo, Inc. Profile 2015(Founded, Public/Private, Headquarters, Number of Employees, 2014, Revenue in $mn, 2016, Geography, Key Markets, Products/Services
Table 8.6 TIBCO Software Inc. Company Profile 2015((Founded, Public/Private, Headquarters, Number of Employees, 2015, Revenue in $ bn, 2015, Geography, Key Markets, Listed on, Products/Services
Table 8.7 Oracle Corporation Company Profile 2015 (Founded, Public/Private, Headquarters, Number of Employees, 2015, Revenue in $bn, 2015, Change in Revenue, 2014, Geography, Key Markets, Listed on, Products/Services
Table 8.8 Oracle Corporation, Revenue 2011-2015 ($bn, AGR %)
Table 8.9 Hitachi Data Systems Corporation Company Profile 2015 (Founded, Public/Private, Headquarters, Number of Employees, 2015, Geography, Key Markets, Listed on, Products/Services)
Table 8.10 Microsoft Corporation Profile 2015(Founded, Public/Private, Headquarters, Number of Employees, 2015, Revenue in $ bn, 2015, Change in Revenue from 2014, Geography, Key Markets, Listed on, Products/Services)
Table 8.11 Microsoft Corporation, Revenue 2011-2015 ($bn, AGR %)
Table 8.12 Deloitte Development LLC. Profile 2015 (Founded, Public/Private, Headquarters, Number of Employees, 2015, Revenue in $ bn, 2015, Change in Revenue from 2014, Geography, Key Markets, Products/Services)
Table 8.13 SAP SE Profile 2015 (Founded, Public/Private, Headquarters, Number of Employees, 2015, Revenue in $ bn, 2015, Change in Revenue from 2014, Geography, Key Markets, Listed on, Products/Services)
Table 8.14 SAP SE, Revenue 2011-2015 ($bn, AGR %)
Table 8.15 International Business Machines Corporation (IBM)Profile 2015 (Founded, Public/Private, Headquarters, Number of Employees, 2015, Revenue in $ bn, 2015, Change in Revenue from 2014, Geography, Key Markets, Listed on, Products/Services)
Table 8.16 International Business Machines Corporation (IBM), Revenue 2011-2015 ($bn, AGR %)
Table 8.17 Other Companies in the Big Data (Analytics) for Oil & Gas Market
List of Figures
Figure 2.1 Global Big Data (Analytics) for Oil & Gas Market Segmentation Overview
Figure 2.2 Global Energy Usage, % Share, By Fuel Type, 2016
Figure 2.3 Big Data (Analytics), Business Process Priority and Technology Maturity Analysis
Figure 2.4 Global Big Data (Analytics) for Oil & Gas Market, Value Chain Analysis
Figure 3.1 Global Big Data (Analytics) for Oil & Gas Forecast 2017-2027 ($mn, AGR %)
Figure 3.2 Big Data (Analytics) for Oil & Gas Market by Regional Market Share Forecast 2017, 2022, 2027 (% Share)
Figure 3.3 Global Big Data (Analytics) for Oil & Gas Market, Market Attractiveness, By Region (Market Growth Rate, Market Attractiveness Rating)
Figure 3.4 Crude Oil Prices: West Texas Intermediate (WTI) and Brent Crude Prices
Figure 3.5 Global Liquids Production, By Resources Type, 2010–2015, (Million Barrels of Liquids Per Day)
Figure 4.1 Overall Market Forecast 2017-2027 ($mn, AGR%)
Figure 4.2 Global Big Data (Analytics) for Oil & Gas Market by Sector Type Share Forecast 2017, 2022, 2027 (% Share)
Figure 4.3 Upstream Big Data (Analytics) for Oil & Gas, Types of Services Offered
Figure 4.4 Big Data (Analytics) for Oil & Gas Market, By Upstream Sector, Forecast 2017-2027 ($mn, AGR%)
Figure 4.5 Midstream Big Data (Analytics) for Oil & Gas, Types of Services Offered
Figure 4.6 Global Big Data (Analytics) for Oil & Gas Market, By Midstream Sector, Forecast 2017-2027 ($mn, AGR%)
Figure 4.7 Downstream Big Data (Analytics) for Oil & Gas, Types of Services Offered
Figure 4.8 Global Big Data (Analytics) for Oil & Gas Market, By Downstream Sector, Forecast 2017-2027 ($mn, AGR%)
Figure 4.9 Overall Market Forecast 2017-2027 ($mn, AGR)
Figure 4.10 Big Data (Analytics) for Oil & Gas Market by Type Share Forecast 2017, 2022, 2027 (%Share)
Figure 4.11 Global Big Data (Analytics) for Oil & Gas Market, By Hardware Forecast 2017-2027 ($mn, AGR)
Figure 4.12 Global Big Data (Analytics) for Oil & Gas Market, By Software Forecast 2017-2027 ($mn, AGR)
Figure 4.13 Global Big Data (Analytics) for Oil & Gas Market, By Services Forecast 2017-2027 ($mn, AGR)
Figure 5.1 Leading National Players in Big Data (Analytics) for Oil & Gas Market, % Share, 2017
Figure 5.2 Leading National Players in Big Data (Analytics) for Oil & Gas Market, % Share, 2022
Figure 5.3 Leading National Players in Big Data (Analytics) for Oil & Gas Market, Share, 2027
Figure 5.4 U.S. Big Data (Analytics) for Oil & Gas Market Forecast 2017-2027 ($mn, AGR %)
Figure 5.5 Canada Big Data (Analytics) for Oil & Gas Market Forecast 2017-2027 ($mn, AGR %)
Figure 5.6 Russia Big Data (Analytics) for Oil & Gas Market Forecast 2017-2027 ($mn, AGR %)
Figure 5.7 U.K. Big Data (Analytics) for Oil & Gas Market Forecast 2017-2027 ($mn, AGR %)
Figure 5.8 Norway Big Data (Analytics) for Oil & Gas Market Forecast 2017-2027 ($mn, AGR %)
Figure 5.9 Rest of Europe Big Data (Analytics) for Oil & Gas Market Forecast 2017-2027 ($mn, AGR %)
Figure 5.10 China Big Data (Analytics) for Oil & Gas Market Forecast 2017-2027 ($mn, AGR %)
Figure 5.11 Indonesia Big Data (Analytics) for Oil & Gas Market Forecast 2017-2027 ($mn, AGR %)
Figure 5.12 Rest of Asia Pacific Big Data (Analytics) for Oil & Gas Market Forecast 2017-2027 ($mn, AGR %)
Figure 5.13 GCC Big Data (Analytics) for Oil & Gas Market Forecast 2017-2027 ($mn, AGR %)
Figure 5.14 South Africa Big Data (Analytics) for Oil & Gas Market Forecast 2017-2027 ($mn, AGR %)
Figure 5.15 Rest of Middle East & Africa Big Data (Analytics) for Oil & Gas Market Forecast 2017-2027 ($mn, AGR %)
Figure 5.16 Brazil Big Data (Analytics) for Oil & Gas Market Forecast 2017-2027 ($mn, AGR %)
Figure 5.17 Venezuela Big Data (Analytics) for Oil & Gas Market Forecast 2017-2027 ($mn, AGR %)
Figure 5.18 Rest of Latin America Big Data (Analytics) for Oil & Gas Market Forecast 2017-2027 ($mn, AGR %)
Figure 8.1 Cap Gemini S.A., % Revenue Share, by Sector, 2015
Figure 8.2 Cap Gemini S.A., % Revenue Share, by Region, 2015
Figure 8.3 Cap Gemini S.A., Revenue ($bn, AGR %) 2011-2015
Figure 8.4 Accenture PLC, % Revenue Share, by Business Segment, 2015
Figure 8.5 Accenture PLC, % Revenue Share, by Regional Segment, 2015
Figure 8.6 Accenture PLC, Revenue ($bn & AGR %), 2011-2015
Figure 8.7 Oracle Corporation, % Revenue Share, by Business Segment, 2015
Figure 8.8 Oracle Corporation, % Revenue Share, by Regional Segment, 2015
Figure 8.9 Oracle Corporation, Revenue ($bn & AGR %) 2011-2015
Figure 8.10 Microsoft Corporation, % Revenue Share, by Business Segment, 2015
Figure 8.11 Microsoft Corporation, % Revenue Share, by Regional Segment, 2015
Figure 8.12 Microsoft Corporation, Revenue by Sales of Product & Services ($ bn) 2015
Figure 8.13 Microsoft Corporation, Revenue ($bn & AGR %), 2011-2015
Figure 8.14 SAP SE, % Revenue Share, by Industry Segment, 2015
Figure 8.15 SAP SE, % Revenue Share, by Regional Segment, 2015
Figure 8.16 SAP SE, % Revenue Share, by Business Segment, 2015
Figure 8.17 SAP SE, Revenue ($bn & AGR %) 2011-2015
Figure 8.18 International Business Machines Corporation (IBM), % Revenue Share, by Operating Segment, 2015
Figure 8.19 International Business Machines Corporation (IBM), % Revenue Share, by Geographic Segment, 2015
Figure 8.20 International Business Machines Corporation (IBM), Revenue ($bn & AGR %) 2011-2015
Figure 8.21 Leading Companies Market Share, 2015 Big Data (Analytics) for Oil & Gas Market
Figure 9.1 Global Big Data (Analytics) for oil & Gas Market Forecast 2017-2027 (MCM, AGR %)
1010data
Accenture PLC
Actian
Actuate
Aerospike
Alteryx
Amazon Web Services (AWS)
Apache Spark
Attivio
Attunity
Basho
Booz Allen Hamilton
Cap Gemini S.A.
CenturyLink
Chevron
Cisco Systems
Cloudera
Cognizant Technology Solution Corporation
Couchbase
CSC
Datameer
DataStax
DDN
Dell
Deloitte Development LLC.
Digital Reasoning
Drillinginfo, Inc.
EMC
Fahrenheit 212 LLC
Fractal Analytics
Fusion-io
Gapso Computer Services Ltd.
Gazprom
General Electric
GoodData
Google
Guavus
Hitachi Data Systems Corporation
Hortonworks
HP
i4C Analytics
iGate Corporation
Informatica
Infosys Limited
Intel
International Business Machines Corporation (IBM)
Jabil Circuit, Inc.,
Jaspersoft
Juniper
Kognitio
KPMG International Cooperative
MapR
MarkLogic
Microsoft Corporation
Microstrategy
MongoDB
Mu Sigma
Neo Technologies
NetApp
NNPC
ODM
Oinio
Opera Solutions
Opower Inc.
Oracle Corporation
Palantir
PDVSA
Pentaho
Pentaho Corporation
Petrobras
Pivotal
PWC
Qlik
Rackspace
Rainstor
Red Hat
Revolution Analytics
Roambi
Rosneft
SAP SE
SAS Institute
Schlumberger
SGI
Shell Group
SiSense
Splunk
Sumo Logic
Syncsort
Tableau Software Inc.
Talend
TCS
Teradata Corporation
The Weather Company
Think Big Analytics
TIBCO Software Inc.
Total
Tresata
Trintech
Truven Health Analytics
Vista Equity Partners
VMware
Download sample pages
Complete the form below to download your free sample pages for Big Data Analytics for Oil & Gas Market Report 2017-2027Download sample pages
Complete the form below to download your free sample pages for Big Data Analytics for Oil & Gas Market Report 2017-2027Do you have any custom requirements we can help you with?
Any specific country, geo region, market segment or specific company information?
Email us today, we can discuss your needs and see how we can help: jamie.roberts@visiongain.com
Would you like a free report overview of the report of your choice?
If so, please drop an email to Jamie Roberts stating your chosen report title to jamie.roberts@visiongain.com
Visiongain energy reports are compiled using a broad and rich mixture of both primary and secondary information to produce an overall industry outlook. In order to provide our clients with the best product possible product, we do not rely on any one single source of information. Visiongain analysts reach out to market-leading vendors and industry experts where possible but also review a wealth of financial data and product information from a vast range of sources. To find out more about our reports methodology, please email jamie.roberts@visiongain.com
Would you like to get the latest Visiongain energy reports catalogue?
What are the dynamic growth sectors? where are the regional business opportunities?
Which technologies will prevail and who are the leading companies succeeding in these sectors and why?
If you want definitive answers to business critical questions, discover Visiongain’s full range of business intelligence reports.
If so, please email Jamie Roberts on jamie.roberts@visiongain.com or call her today on +44 207 336 6100
“The Visiongain report was extremely insightful and helped us construct our basic go-to market strategy for our solution.”
H.
“F.B has used Visiongain to prepare two separate market studies on the ceramic proppants market over the last 12 months. These reports have been professionally researched and written and have assisted FBX greatly in developing its business strategy and investment plans.”
F.B
“We just received your very interesting report on the Energy Storage Technologies (EST) Market and this is a very impressive and useful document on that subject.”
I.E.N
“Visiongain does an outstanding job on putting the reports together and provides valuable insight at the right informative level for our needs. The EOR Visiongain report provided confirmation and market outlook data for EOR in MENA with the leading countries being Oman, Kuwait and eventually Saudi Arabia.”
E.S
“Visiongain produced a comprehensive, well-structured GTL Market report striking a good balance between scope and detail, global and local perspective, large and small industry segments. It is an informative forecast, useful for practitioners as a trusted and upto-date reference.”
Y.N Ltd
Association of Dutch Suppliers in the Oil & Gas Industry
Society of Naval Architects & Marine Engineers
Association of Diving Contractors
Association of Diving Contractors International
Associazione Imprese Subacquee Italiane
Australian Petroleum Production & Exploration Association
Brazilian Association of Offshore Support Companies
Brazilian Petroleum Institute
Canadian Energy Pipeline
Diving Medical Advisory Committee
European Diving Technology Committee
French Oil and Gas Industry Council
IMarEST – Institute of Marine Engineering, Science & Technology
International Association of Drilling Contractors
International Association of Geophysical Contractors
International Association of Oil & Gas Producers
International Chamber of Shipping
International Shipping Federation
International Marine Contractors Association
International Tanker Owners Pollution Federation
Leading Oil & Gas Industry Competitiveness
Maritime Energy Association
National Ocean Industries Association
Netherlands Oil and Gas Exploration and Production Association
NOF Energy
Norsk olje og gass Norwegian Oil and Gas Association
Offshore Contractors’ Association
Offshore Mechanical Handling Equipment Committee
Oil & Gas UK
Oil Companies International Marine Forum
Ontario Petroleum Institute
Organisation of the Petroleum Exporting Countries
Regional Association of Oil and Natural Gas Companies in Latin America and the Caribbean
Society for Underwater Technology
Society of Maritime Industries
Society of Petroleum Engineers
Society of Petroleum Enginners – Calgary
Step Change in Safety
Subsea UK
The East of England Energy Group
UK Petroleum Industry Association
All the events postponed due to COVID-19.
Don’t Miss Out!
Latest Energy news
Energy as a Service (EaaS) Market
The global Energy as a Service (EaaS) market is projected to grow at a CAGR of 12.6% by 2034
25 July 2024
Synthetic Fuels Market
The global Synthetic Fuels market is projected to grow at a CAGR of 23% by 2034
18 July 2024
Power-to-X (P2X) Market
The global Power-to-X (P2X) market is projected to grow at a CAGR of 10.6% by 2034
09 July 2024
Airborne Wind Energy Market
The global Airborne Wind Energy market is projected to grow at a CAGR of 9.7% by 2034
05 June 2024


