The latest report from business intelligence provider Visiongain offers complete analysis of the global artificial lift systems market. Visiongain assesses that this market will generate revenues of $10.99bn in 2017.
The Artificial Lift Systems Market Report 2017-2027 responds to your need for definitive market data.
Read on to discover how you can exploit the future business opportunities emerging in this sector. Visiongain’s new study tells you and tells you NOW.
In this brand new report you find 120 in-Depth tables, charts and graphs all unavailable elsewhere.
The 162 page report provides clear detailed insight into the global artificial lift systems market. Discover the key drivers and challenges affecting the market.
By ordering and reading our brand new report today you stay better informed and ready to act.
Report Scope
The report delivers considerable added value by revealing:
• How is the Artificial Lift Systems market developing?
• What is driving and restraining Artificial Lift Systems market dynamics?
• How will each Artificial Lift Systems submarket segment grow over the forecast period 2027?
– Onshore
– Offshore
• Which individual artificial lift technologies will prevail and how will these shifts be responded to?
– Electric Submersible Pump (ESP)
– Progressive Cavity Pump (PCP)
– Rod Pump
– Other (Including Gas Lift, Plunger Lift, Hydraulic Piston Pump)
• How will political and regulatory factors influence regional Artificial Lift Systems markets and submarkets?
• How will regional and leading national Artificial Lift Systems markets perform over the forecast period?
North America
– US
– Canada
– Rest of North America
Europe
– UK
– Norway
– Russia
– Rest of Europe
Asia-Pacific (excluding Russia)
– China
– India
– Indonesia
– Malaysia
– Rest of Asia Pacific
Middle East
– Saudi Arabia
– Iran
– Qatar
– Res of Middle East
Africa
– Nigeria
– Algeria
– Angola
– Rest of Africa
South America
– Venezuela
– Brazil
– Rest of South America
• Who are the leading artificial lift companies and what are their prospects over the forecast period?
– Baker Hughes Inc.
– Halliburton Company
– Schlumberger Ltd.
– Weatherford International Plc.
– GE Oil & Gas
– Borets Company LLC.
– National Oilwell Varco Inc.
– Dover Artificial Lift
– Flotek Industries Inc.
• PESTLE analysis of the major political, economic, social, technological, environmental and legal aspects impacting the market
• Conclusions and recommendations which will aid decision-making
How will you benefit from this report?
• Keep your knowledge base up to speed. Don’t get left behind
• Reinforce your strategic decision-making with definitive and reliable market data
• Learn how to exploit new technological trends
• Realise your company’s full potential within the market
• Understand the competitive landscape and identify potential new business opportunities & partnerships
Who should read this report?
• Anyone within the artificial lift systems market.
• Artificial lift systems manufacturers
• Oil & Gas Companies
• Oil & Gas Engineering contractors
• Component suppliers
• Production managers
• Energy market analysts
• Competitive intelligence manager
• Business development managers
• Marketing managers
• Technologists
• Suppliers
• Investors
• Banks
• Government agencies
• Contractors
Visiongain’s study is intended for anyone requiring commercial analyses for the artificial lift systems and leading companies. You find data, trends and predictions.
Buy our report today Artificial Lift Systems Market Report 2017-2027: Forecasts ($bn) by Oil & Gas Exploration & Production (E&P) Area of Deployment (Onshore, Offshore), by Type of Installation (Electric Submersible Pump (ESP), Progressive Cavity Pump (PCP), Rod Pump, Other (Including Analysis of Gas Lift, Plunger Lift, Hydraulic Piston Pump) by Regions (North America, Europe, Asia-Pacific, Middle East, Africa, South America) Plus 17 Countries. Avoid missing out by staying informed – get our report now.
Visiongain is a trading partner with the US Federal Government
CCR Ref number: KD4R6
1. Report Overview
1.1 Global Artificial Lift Systems Market Overview
1.2 Why You Should Read This Report
1.3 How This Report Delivers
1.4 Key Questions Answered by This Analytical Report Include:
1.5 Who is This Report For?
1.6 Methodology
1.6.1 Primary Research
1.6.2 Secondary Research
1.6.3 Market Evaluation & Forecasting Methodology
1.7 Frequently Asked Questions (FAQ)
1.8 Associated Visiongain Reports
1.9 About Visiongain
2. Introduction to the Artificial Lift Market
2.1 Brief History of Artificial Lift Systems
2.2 The Role and Function of Artificial Lift Systems
2.3 What are the Factors Influencing the Market Growth
2.4 Who are the Major Players in This Industry
3. Global Artificial Lift Market Dynamics 2017-2027
3.1 Current Market Scenario
3.2 Artificial Lift Market Revenue Forecast 2017-2027
3.3 What are the Factors Influencing the Artificial Lift Market?
3.3.1 Market Drivers
3.3.1.1 Growing Oil and Gas Demand
3.3.1.2 Ageing Fields and Rapid Production Decline from Unconventional Fields
3.3.2 Market Restraints
3.3.2.1 Sustained Low Oil and Gas Prices
3.3.3 Market Opportunities
3.3.3.1 Rising Unconventional E&P Presents a Decent Opportunity
4. Global Artificial Lift Market Forecast, by Area of Deployment 2017-2027
4.1 Onshore Artificial Lift Market 2017-2027
4.1.1 Onshore Artificial Lift Market Overview
4.1.2 Onshore Artificial Lift Market Revenue Forecast in USD billion 2017-2027
4.1.3 Future Outlook of the Onshore Artificial Lift Market
4.2 Offshore Artificial Lift Market2017-2027
4.2.1 Offshore Artificial Lift Market Overview
4.2.2 Offshore Artificial Lift Market Revenue Forecast in USD billion 2017-2027
4.2.3 Future Outlook of the Offshore Artificial Lift Market
5. National Artificial Lift Market Forecast, by Region 2017-2027
5.1 North America Artificial Lift Market 2017-2027
5.1.1 North America Artificial Lift Market Introduction
5.1.2 North America Artificial Lift Market Revenue Forecast in USD billion 2017-2027
5.1.3 North America Region Artificial Lift Market Analysis
5.1.3.1 United States Artificial Lift Market 2017-2027
5.1.3.1.1 United States Artificial Lift Market Overview
5.1.3.1.2 United States Artificial Lift Market Revenue Forecast 2017-2027
5.1.3.1.3 Future Outlook of the Unites States Artificial Lift Market
5.1.3.2 Canada Artificial Lift Market 2017-2027
5.1.3.2.1 Canada Artificial Lift Market Overview
5.1.3.2.2 Canada Artificial Lift Market Revenue Forecast 2017-2027
5.1.3.2.3 Future Outlook of the Canada Artificial Lift Market
5.1.3.3 Rest of North America Artificial Lift Market 2017-2027
5.1.3.3.1 Rest of North America Market Overview
5.1.3.3.2 Mexico Artificial Lift Market Analysis
5.1.3.3.3 Rest of North America Artificial Lift Market Revenue Forecast 2017-2027
5.1.3.3.4 Future Outlook of the Rest of North America Artificial Lift Market
5.2 Europe Artificial Lift Market 2017-2027
5.2.1 Europe Artificial Lift Market Introduction
5.2.2 Europe Artificial Lift Market Revenue Forecast in USD billion2017-2027
5.2.3 Europe Region Artificial Lift Market Analysis
5.2.3.1 United Kingdom Artificial Lift Market 2017-2027
5.2.3.1.1 United Kingdom Artificial Lift Market Overview
5.2.3.1.2 United Kingdom Artificial Lift Market Revenue Forecast 2017-2027
5.2.3.1.3 Future Outlook of the United Kingdom Artificial Lift Market
5.2.3.2 Norway Artificial Lift Market 2017-2027
5.2.3.2.1 Norway Artificial Lift Market Overview
5.2.3.2.2 Norway Artificial Lift Market Revenue Forecast 2017-2027
5.2.3.2.3 Future Outlook of the Norway Artificial Lift Market
5.2.3.3 Russia Artificial Lift Market 2017-2027
5.2.3.3.1 Russia Artificial Lift Market Overview
5.2.3.3.2 Russia Artificial Lift Market Revenue Forecast 2017-2027
5.2.3.3.3 Future Outlook of the Russia Artificial Lift Market
5.2.3.4 Rest of Europe Artificial Lift Market 2017-2027
5.2.3.4.1 Rest of Europe Artificial Lift Market Overview
5.2.3.4.2 Rest of Europe Artificial Lift Market Revenue Forecast 2017-2027
5.2.3.4.3 Future Outlook of the Rest of Europe Artificial Lift Market
5.3 Asia-Pacific (excluding Russia) Artificial Lift Market 2017-2027
5.3.1 Asia-Pacific (excluding Russia) Artificial Lift Market Introduction
5.3.2 Asia-Pacific (excluding Russia) Artificial Lift Market Revenue Forecast in USD billion 2017-2027
5.3.3 Asia-Pacific (excluding Russia) Region Artificial Lift Market Analysis
5.3.3.1 China Artificial Lift Market 2017-2027
5.3.3.1.1 China Artificial Lift Market Overview
5.3.3.1.2 China Artificial Lift Market Revenue Forecast 2017-2027
5.3.3.1.3 Future Outlook of the China Artificial Lift Market
5.3.3.2 India Artificial Lift Marke t2017-2027
5.3.3.2.1 India Artificial Lift Market Overview
5.3.3.2.2 India Artificial Lift Market Revenue Forecast 2017-2027
5.3.3.2.3 Future Outlook of the India Artificial Lift Market
5.3.3.3 Indonesia Artificial Lift Market 2017-2027
5.3.3.3.1 Indonesia Artificial Lift Market Overview
5.3.3.3.2 Indonesia Artificial Lift Market Revenue Forecast 2017-2027
5.3.3.3.3 Future Outlook of the Indonesia Artificial Lift Market
5.3.3.4 Malaysia Artificial Lift Market 2017-2027
5.3.3.4.1 Malaysia Artificial Lift Market Overview
5.3.3.4.2 Malaysia Artificial Lift Market Revenue Forecast 2017-2027
5.3.3.4.3 Future Outlook of the Malaysian Artificial Lift Market
5.3.3.5 Rest of Asia-Pacific Artificial Lift Market 2017-2027
5.3.3.5.1 Rest of Asia-Pacific Artificial Lift Market Overview
5.3.3.5.2 Rest of Asia-Pacific Artificial Lift Market Revenue Forecast 2017-2027
5.3.3.5.3 Future Outlook of the Rest of Asia-Pacific Artificial Lift Market
5.4 Middle East Artificial Lift Market 2017-2027
5.4.1 Middle East Artificial Lift Market Introduction
5.4.2 Middle East Artificial Lift Market Revenue Forecast in USD billion 2017-2027
5.4.3 Middle East Region Artificial Lift Market Analysis
5.4.3.1 Saudi Arabia Artificial Lift Market 2017-2027
5.4.3.1.1 Saudi Arabia Artificial Lift Market Overview
5.4.3.1.2 Saudi Arabia Artificial Lift Market Revenue Forecast 2017-2027
5.4.3.1.3 Future Outlook of the Saudi Arabia Artificial Lift Market
5.4.3.2 Iran Artificial Lift Market 2017-2027
5.4.3.2.1 Iran Artificial Lift Market Overview
5.4.3.2.2 Iran Artificial Lift Market Revenue Forecast 2017-2027
5.4.3.2.3 Future Outlook of the Iran Artificial Lift Market
5.4.3.3 Qatar Artificial Lift Market 2017-2027
5.4.3.3.1 Qatar Artificial Lift Market Overview
5.4.3.3.2 Qatar Artificial Lift Market Revenue Forecast 2017-2027
5.4.3.3.3 Future Outlook of the Qatar Artificial Lift Market
5.4.3.4 Rest of Middle East Artificial Lift Market 2017-2027
5.4.3.4.1 Rest of Middle East Artificial Lift Market Overview
5.4.3.4.2 Rest of Middle East Artificial Lift Market Revenue Forecast 2017-2027
5.4.3.4.3 Future Outlook of the Rest of Middle East Artificial Lift Market
5.5 Africa Artificial Lift Market 2017-2027
5.5.1 Africa Artificial Lift Market Introduction
5.5.2 Africa Artificial Lift Market Revenue Forecast in USD billion 2017-2027
5.5.3 Africa Artificial Lift Market Analysis, Region
5.5.3.1 Nigeria Artificial Lift Market 2017-2027
5.5.3.1.1 Nigeria Artificial Lift Market Overview
5.5.3.1.2 Nigeria Artificial Lift Market Revenue Forecast 2017-2027
5.5.3.1.3 Future Outlook of the Nigeria Artificial Lift Market
5.5.3.2 Algeria Artificial Lift Market 2017-2027
5.5.3.2.1 Algeria Artificial Lift Market Overview
5.5.3.2.2 Algeria Artificial Lift Market Revenue Forecast 2017-2027
5.5.3.2.3 Future Outlook of the Algeria Artificial Lift Market
5.5.3.3 Angola Artificial Lift Market 2017-2027
5.5.3.3.1 Angola Artificial Lift Market Overview
5.5.3.3.2 Angola Artificial Lift Market Revenue Forecast 2017-2027
5.5.3.3.3 Future Outlook of the Angola Artificial Lift Market
5.5.3.4 Rest of Africa Artificial Lift Market 2017-2027
5.5.3.4.1 Rest of Africa Artificial Lift Market Overview
5.5.3.4.2 Rest of Africa Artificial Lift Market Revenue Forecast 2017-2027
5.5.3.4.3 Future Outlook of the Rest of Africa Artificial Lift Market
5.6 South America Artificial Lift Market 2017-2027
5.6.1 South America Artificial Lift Market Introduction
5.6.2 South America Artificial Lift Market Revenue Forecast in USD billion 2017-2027
5.6.3 South America Region Artificial Lift Market Analysis
5.6.3.1 Venezuela Artificial Lift Market 2017-2027
5.6.3.1.1 Venezuela Artificial Lift Market Overview
5.6.3.1.2 Venezuela Artificial Lift Market Revenue Forecast 2017-2027
5.6.3.1.3 Future Outlook of the Venezuela Artificial Lift Market
5.6.3.2 Brazil Artificial Lift Market 2017-2027
5.6.3.2.1 Brazil Artificial Lift Market Overview
5.6.3.2.2 Brazil Artificial Lift Market Revenue Forecast 2017-2027
5.6.3.2.3 Future Outlook of the Brazil Artificial Lift Market
5.6.3.3 Rest of South America Artificial Lift Market 2017-2027
5.6.3.3.1 Rest of South America Artificial Lift Market Overview
5.6.3.3.2 Rest of South America Artificial Lift Market Revenue Forecast 2017-2027
5.6.3.3.3 Future Outlook of the Rest of South America Artificial Lift Market
6. Global Artificial Lift Market Forecast, by Type of Installation 2017-2027
6.1 Electric Submersible Pump (ESP) Market 2017-2027
6.1.1 Introduction
6.1.2 Electric Submersible Pump (ESP) Market Revenue Forecast in USD billion 2017-2027
6.1.3 Advantages and Disadvantages
6.1.3.1 Advantages of Electric Submersible Pumps (ESP)
6.1.3.2 Disadvantages of Electric Submersible Pumps (ESP)
6.2 Progressive Cavity Pumps (PCP) Market 2017-2027
6.2.1 Introduction
6.2.2 Progressive Cavity Pumps (PCP) Market Revenue Forecast in USD billion 2017-2027
6.2.3 Advantages and Disadvantages
6.2.3.1 Advantages of Progressive Cavity Pumps (PCP)
6.2.3.2 Disadvantages of Progressive Cavity Pumps (PCP)
6.3 Rod Pumps Market 2017-2027
6.3.1 Introduction
6.3.2 Rod Pumps Market Revenue Forecast in USD billion 2017-2027
6.3.3 Advantages and Disadvantages
6.3.3.1 Advantages of Rod Pumps
6.3.3.2 Disadvantages of Rod Pumps
6.4 Other Pumps Market 2017-2027
6.4.1 Gas Lift Systems
6.4.1.1 Advantages of Gas Lift
6.4.1.2 Disadvantages of Gas Lift
6.4.2 Hydraulic Piston Pumping
6.4.2.1 Advantages of Hydraulic Piston Pumping
6.4.2.2 Disadvantages of Hydraulic Piston Pumping
6.4.3 Plunger Lift
6.4.3.1 Advantages of Plunger Lift
6.4.3.2 Disadvantages of Plunger lift
6.4.4 Other Pumps Market Revenue Forecast in USD billion 2017-2027
7. The Leading Companies in the Artificial Lift Market
7.1 Baker Hughes Inc.
7.1.1 Baker Hughes Inc. Business Overview
7.1.2 Baker Hughes Inc. Products and Services
7.1.3 Baker Hughes Inc. Financials
7.1.4 Baker Hughes Inc. SWOT Analysis
7.1.5 Baker Hughes Inc. Recent Developments
7.2 Halliburton Company
7.2.1 Halliburton Company Overview
7.2.2 Halliburton Company Products and Services
7.2.3 Halliburton Company Financials
7.2.4 Halliburton Company SWOT Analysis
7.2.5 Halliburton Company Recent Developments
7.3 Schlumberger Ltd.
7.3.1 Schlumberger Ltd. Overview
7.3.2 Schlumberger Ltd. Products and Services
7.3.3 Schlumberger Ltd. Financials
7.3.4 Schlumberger Ltd. SWOT Analysis
7.3.5 Schlumberger Ltd. Recent Developments
7.4 Weatherford International Plc.
7.4.1 Weatherford International Plc. Overview
7.4.2 Weatherford International Plc Products and Services
7.4.3 Weatherford International Plc Financials
7.4.4 Weatherford International Plc SWOT Analysis
7.4.5 Weatherford International Plc Recent Developments
7.5 GE Oil & Gas
7.5.1 GE Oil & Gas Overview
7.5.2 GE Oil & Gas Products and Services
7.5.3 GE Oil & Gas Financials
7.5.4 GE Oil & Gas SWOT Analysis
7.5.5 GE Oil & Gas Recent Developments
7.6 Borets Company LLC.
7.6.1 Borets Company LLC.Overview
7.6.2 Borets Company LLC.Financials
7.6.3 Borets Company LLC.Recent Developments
7.7 National Oilwell Varco Inc.
7.7.1 National Oilwell Varco Inc. Overview
7.7.2 National Oilwell Varco Inc. Products and Services
7.7.3 National Oilwell Varco Inc. Financials
7.7.4 National Oilwell Varco Inc. SWOT Analysis
7.7.5 National Oilwell Varco Inc. Recent Developments
7.8 Dover Artificial Lift
7.8.1 Dover Artificial Lift Overview
7.8.2 Dover Artificial Lift Financials
7.8.3 Dover Artificial Lift Recent Developments
7.9 Flotek Industries Inc.
7.9.1 Flotek Industries Inc. Overview
7.9.2 Flotek Industries Inc. Products and Services
7.9.3 Flotek Industries Inc. Financials
8. PESTLE Analysis of the Artificial Lift Market
8.1 Political
8.2 Economical
8.3 Social
8.4 Technological
8.5 Environmental
8.6 Legal
9. Conclusion
9.1 Artificial Lift Systems Market Overview
9.2 Artificial Lift Systems Market Future Outlook
10. Glossary
List of Tables
Table 1.1 Example of Artificial Lift Systems Market by Regional Market Forecast 2017-2027 (US$bn, AGR %, Cumulative)
Table 3.1 Global Artificial Lift Market Revenue Forecast 2017-2027 (US$ billion, AGR %)
Table 4.1 Global Artificial Lift Market Revenue Forecast 2017-2027, by Area of Deployment (US$ billion, AGR %, Cumulative)
Table 4.2 Global Onshore Artificial Lift Market Revenue Forecast 2017-2027 (US$ billion, AGR %, Cumulative)
Table 4.3 Global Offshore Artificial Lift Market Revenue Forecast 2017-2027 (US$ billion, AGR %, Cumulative)
Table 5.1 Global Artificial Lift Systems Market Revenue Forecast, by Region 2017-2027 (US$ billion, AGR %, Cumulative)
Table 5.2 North America Artificial Lift Systems Market Revenue Forecast, 2017-2027 (US$ billion, AGR %, Cumulative)
Table 5.3 United States Artificial Lift Systems Market Revenue Forecast, 2017-2027 (US$ billion, AGR %, Cumulative)
Table 5.4 Canada Artificial Lift Systems Market Revenue Forecast, 2017-2027 (US$ billion, AGR %, Cumulative)
Table 5.5 Rest of North America Artificial Lift Systems Market Revenue Forecast, 2017-2027 (US$ billion, AGR %)
Table 5.6 Europe Artificial Lift Systems Market Revenue Forecast 2017-2027 (US$ billion, AGR %, Cumulative)
Table 5.7 United Kingdom Artificial Lift Systems Market Revenue Forecast 2017-2027 (US$ billion, AGR %)
Table 5.8 Norway Artificial Lift Systems Market Revenue Forecast 2017-2027 (US$ billion, AGR %)
Table 5.9 Russia Artificial Lift Systems Market Revenue Forecast 2017-2027 (US$ billion, AGR %, Cumulative)
Table 5.10 Rest of Europe Artificial Lift Systems Market Revenue Forecast 2017-2027 (US$ billion, AGR %, Cumulative)
Table 5.11 Asia-Pacific Artificial Lift Systems Market Revenue Forecast 2017-2027 (US$ billion, AGR %, Cumulative)
Table 5.12 China Artificial Lift Systems Market Revenue Forecast 2017-2027 (US$ billion, AGR %, Cumulative)
Table 5.13 India Artificial Lift Systems Market Revenue Forecast 2017-2027 (US$ billion, AGR %, Cumulative)
Table 5.14 Indonesia Artificial Lift Systems Market Revenue Forecast 2017-2027 (US$ billion, AGR %, Cumulative)
Table 5.15 Malaysia Artificial Lift Systems Market Revenue Forecast 2017-2027 (US$ billion, AGR %, Cumulative)
Table 5.16 Rest of Asia-Pacific Artificial Lift Systems Market Revenue Forecast 2017-2027 (US$ billion, AGR %, Cumulative)
Table 5.17 Middle East Artificial Lift Systems Market Revenue Forecast, 2017-2027 (US$ billion, AGR %, Cumulative)
Table 5.18 Saudi Arabia Artificial Lift Systems Market Revenue Forecast, 2017-2027 (US$ billion, AGR %, Cumulative)
Table 5.19 Iran Artificial Lift Systems Market Revenue Forecast, 2017-2027 (US$ billion, AGR %, Cumulative)
Table 5.20 Qatar Artificial Lift Systems Market Revenue Forecast, 2017-2027 (US$ billion, AGR %, Cumulative)
Table 5.21 Rest of Middle East Artificial Lift Systems Market Revenue Forecast, 2017-2027 (US$ billion, AGR %, Cumulative)
Table 5.22 Africa Artificial Lift Systems Market Revenue Forecast, 2017-2027 (US$ billion, AGR %, Cumulative)
Table 5.23 Nigeria Artificial Lift Systems Market Revenue Forecast 2017-2027 (US$ billion, AGR %, Cumulative)
Table 5.24 Algeria Artificial Lift Systems Market Revenue Forecast 2017-2027 (US$ billion, AGR %, Cumulative)
Table 5.25 Angola Artificial Lift Systems Market Revenue Forecast 2017-2027 (US$ billion, AGR %, Cumulative)
Table 5.26 Rest of Africa Artificial Lift Systems Market Revenue Forecast 2017-2027 (US$ billion, AGR %, Cumulative)
Table 5.27 South America Artificial Lift Systems Market Revenue Forecast, 2017-2027 (US$ billion, AGR %, Cumulative)
Table 5.28 Venezuela Artificial Lift Systems Market Revenue Forecast 2017-2027 (US$ billion, AGR %, Cumulative)
Table 5.29 Brazil Artificial Lift Systems Market Revenue Forecast 2017-2027 (US$ billion, AGR %, Cumulative)
Table 5.30 Rest of South America Artificial Lift Systems Market Revenue Forecast 2017-2027 (US$ billion, AGR %, Cumulative)
Table 6.1 Electric Submersible Pump (ESP) Market Revenue Forecast 2017-2027 (US$ billion, AGR %, Cumulative)
Table 6.2 Progressive Cavity Pumps Market Revenue Forecast 2017-2027 (US$ billion, AGR %, Cumulative)
Table 6.3 Rod Pumps Market Revenue Forecast 2017-2027 (US$ billion, AGR %, Cumulative)
Table 6.4 Other Pumps Market Revenue Forecast 2017-2027 (US$ billion, AGR %, Cumulative)
Table 7.1 Baker Hughes Inc. Overview
Table 7.2 Financials of Baker Hughes (in USD billion)
Table 7.3 SWOT Analysis of Baker Hughes
Table 7.4 Recent Developments of Baker Hughes
Table 7.5 Halliburton Co Overview
Table 7.6 Financials of Halliburton Co (in USD billion)
Table 7.7 SWOT Analysis of Halliburton Co
Table 7.8 Recent Developments of Halliburton Co
Table 7.9 Schlumberger Ltd Overview
Table 7.10 Financials of Schlumberger Limited (in USD billion)
Table 7.11 SWOT Analysis of Schlumberger Limited
Table 7.12 Recent Developments of Schlumberger Limited
Table 7.13 Weatherford International Plc Overview
Table 7.14 Financials of Weatherford International (in USD billion)
Table 7.15 SWOT Analysis of Weatherford International
Table 7.16 Recent Developments of Weatherford International
Table 7.17 GE Oil & Gas Overview
Table 7.18 Financials of GE Oil and Gas (in USD billion)
Table 7.19 SWOT Analysis of GE Oil and Gas
Table 7.20 Recent Developments of GE Oil and Gas
Table 7.21 Borets Company Overview
Table 7.22 Financials of Borets Company LLC (in USD billion)
Table 7.23 Recent Developments of Borets Company LLC
Table 7.24 National Oilwell Varco Inc. Overview
Table 7.25 Financials of National Oilwell Varco Inc. (in USD billion)
Table 7.26 SWOT Analysis of National Oilwell Varco Inc.
Table 7.27 Recent Developments of National Oilwell Varco Inc.
Table 7.28 Dover Artificial Lift Overview
Table 7.29 Financials of Dover Corporation (in USD billion)
Table 7.30 SWOT Analysis of Dover Corporation
Table 7.31 Recent Developments of Dover Corporation
Table 7.32 Flotek Industries, Inc. Overview
Table 7.33 Financials of Flotek Industries Inc. (in USD billion)
Table 7.34 Other Prominent Companies in the Artificial Lift Systems Market
Table 9.1 Global Artificial Lift Market Revenue Forecast 2017-2027 (US$ billion, AGR %, Cumulative)
List of Figures
Figure 1.1 Example of Artificial Lift Systems Market by Regional Market Share Forecast 2017, 2022, 2027(% Share)
Figure 3.1 Global Artificial Lift Market Revenue Forecast 2017-2027 (US$ billion, AGR %)
Figure 4.1 Global Artificial Lift Market Revenue Forecast 2017-2027, by Area of Deployment (US$ billion)
Figure 4.2 Global Offshore Artificial Lift Market Revenue Forecast 2017-2027 (US$ billion, AGR %)
Figure 5.1 Global Artificial Lift Systems Market Revenue Forecast, by Region 2017-2027 (US$ billion)
Figure 5.2 North America Artificial Lift Market Share of Countries in 2016
Figure 5.3 North America Artificial Lift Systems Market Revenue Forecast, 2017-2027 (US$ billion, AGR %)
Figure 5.4 United States Artificial Lift Systems Market Revenue Forecast, 2017-2027 (US$ billion, AGR %, Cumulative)
Figure 5.5 Canada Artificial Lift Systems Market Revenue Forecast, 2017-2027 (US$ billion, AGR %)
Figure 5.6 Rest of North America Artificial Lift Systems Market Revenue Forecast, 2017-2027 (US$ billion, AGR %, Cumulative)
Figure 5.7 Europe Artificial Lift Market Share of Countries in 2016
Figure 5.8 Europe Artificial Lift Systems Market Revenue Forecast 2017-2027 (US$ billion, AGR %)
Figure 5.9 United Kingdom Artificial Lift Systems Market Revenue Forecast 2017-2027 (US$ billion, AGR %, Cumulative)
Figure 5.10 Norway Artificial Lift Systems Market Revenue Forecast 2017-2027 (US$ billion, AGR %, Cumulative)
Figure 5.11 Russia Artificial Lift Systems Market Revenue Forecast 2017-2027 (US$ billion, AGR %)
Figure 5.12 Rest of Europe Artificial Lift Systems Market Revenue Forecast 2017-2027 (US$ billion, AGR %)
Figure 5.13 Asia-Pacific Artificial Lift Market Share of Countries in 2016
Figure 5.14 Asia-Pacific Artificial Lift Systems Market Revenue Forecast 2017-2027 (US$ billion, AGR %)
Figure 5.15 China Artificial Lift Systems Market Revenue Forecast 2017-2027 (US$ billion, AGR %)
Figure 5.16 India Artificial Lift Systems Market Revenue Forecast 2017-2027 (US$ billion, AGR %)
Figure 5.17 Indonesia Artificial Lift Systems Market Revenue Forecast 2017-2027 (US$ billion, AGR %)
Figure 5.18 Malaysia Artificial Lift Systems Market Revenue Forecast 2017-2027 (US$ billion, AGR %)
Figure 5.19 Rest of Asia-Pacific Artificial Lift Systems Market Revenue Forecast 2017-2027 (US$ billion, AGR %)
Figure 5.20 Middle East Artificial Lift Market Share of Countries in 2016
Figure 5.21 Middle East Artificial Lift Systems Market Revenue Forecast, 2017-2027 (US$ billion, AGR %, Cumulative)
Figure 5.22 Saudi Arabia Artificial Lift Systems Market Revenue Forecast, 2017-2027 (US$ billion, AGR %)
Figure 5.23 Iran Artificial Lift Systems Market Revenue Forecast, 2017-2027 (US$ billion, AGR %)
Figure 5.24 Qatar Artificial Lift Systems Market Revenue Forecast, 2017-2027 (US$ billion, AGR %)
Figure 5.25 Rest of Middle East Artificial Lift Systems Market Revenue Forecast, 2017-2027 (US$ billion, AGR %)
Figure 5.26 Africa Artificial Lift Market Share of Countries in 2016
Figure 5.27 Africa Artificial Lift Systems Market Revenue Forecast, 2017-2027 (US$ billion, AGR %)
Figure 5.28 Nigeria Artificial Lift Systems Market Revenue Forecast 2017-2027 (US$ billion, AGR %)
Figure 5.29 Algeria Artificial Lift Systems Market Revenue Forecast 2017-2027 (US$ billion, AGR %)
Figure 5.30 Angola Artificial Lift Systems Market Revenue Forecast 2017-2027 (US$ billion, AGR %)
Figure 5.31 Rest of Africa Artificial Lift Systems Market Revenue Forecast 2017-2027 (US$ billion, AGR %)
Figure 5.32 South America Artificial Lift Market Share of Countries in 2016
Figure 5.33 South America Artificial Lift Systems Market Revenue Forecast, 2017-2027 (US$ billion, AGR %)
Figure 5.34 Venezuela Artificial Lift Systems Market Revenue Forecast 2017-2027 (US$ billion, AGR %)
Figure 5.35 Brazil Artificial Lift Systems Market Revenue Forecast 2017-2027 (US$ billion, AGR %)
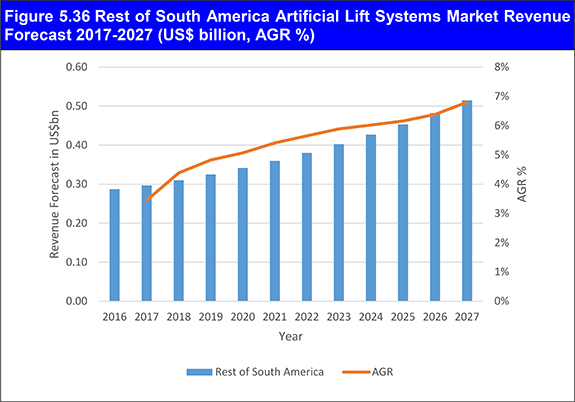
Figure 5.36 Rest of South America Artificial Lift Systems Market Revenue Forecast 2017-2027 (US$ billion, AGR %)
Figure 6.1 Electric Submersible Pump (ESP) Market Revenue Forecast 2017-2027 (US$ billion, AGR %)
Figure 6.2 Progressive Cavity Pumps Market Revenue Forecast 2017-2027 (US$ billion, AGR %)
Figure 6.3 Rod Pumps Market Revenue Forecast 2017-2027 (US$ billion, AGR %)
Figure 6.4 Other Pumps Market Revenue Forecast 2017-2027 (US$ billion, AGR %)
Figure 9.1 Global Artificial Lift Market Revenue Forecast 2017-2027 (US$ billion, AGR %)
ABB
Accelerated Companies LLC
Amec Foster Wheeler
Anadarko Petroleum
Archer Limited
Baker Hughes Inc.
Basic Energy Services Inc.
BHP Billion Ltd
Borets Company LLC
BP
Calfrac Well Services Ltd
Cameron
Canadian Natural Resources
Chevron
CNOOC
ConocoPhillips
Dover Artificial Lift
Dover Corporation
Ekual Tech
EOG Resources
Expro International Group
Exxon Mobil
Flotek Chemical Ecuador Cia. Ltd
Flotek Ecuador Investments, LLC.
Flotek Gulf Research, LLC
Flotek Industries FZE
Flotek Industries Holdings Limited
Flotek Industries UK Limited
Flotek Industries, Inc.
Flotek Technologies ULC
Franklin Electric
Fullstream Digital Industrial Services Company
GE Oil & Gas
General Electric Company
Golar LNG
Halliburton Company
Helix Energy Solutions Group, Inc.
Honeywell
Iraq National Oil Company
John Crane
Key Energy Services
Lukoil
Marathon Petroleum
Nabors Industries Ltd.
National Iranian Oil Company
National Oilwell Varco Inc.
Novomet
Occidental Petroleum Corporation
Oil and Natural Gas Corporation
OMV Group
OneSubsea
PDVSA
Pemex
Penguin Petroleum Services (P) Limited
Pertamina
Petrobras
PetroChina
Petrofac
Petrovalve, Inc.
Pioneer Energy Services
Precision Drilling Corporation
Repsol
Rimera Group
Rosneft
Royal Dutch Shell
Saipem
Saudi Aramco
Schlumberger Ltd
Schneider Electric
Seadrill
Sonatrach
Statoil
Subsea Services Alliance
Suncor Energy
Superior Energy Services Inc.
Tenaris S.A.
Torqueflow Sydex Ltd
Total S.A
Trican Well Service Ltd
Turbeco, Inc
USA Petrovalve, Inc
Weatherford International PLC
Wood Group
Organisations
Organisation of Petroleum Exporting Countries (OPEC)
International Monetary Fund (IMF)


