Visiongain has calculated that the global lubricants market will see a capital expenditure (CAPEX) of $154,951 mn in 2017. Read on to discover the potential business opportunities available.
Visiongain understands that the Lubricants Market will register strong growth. The Lubricants Market is a relatively large market with the majority of the largest revenue generating companies involved in the business, and all the factors analysed in this report illustrate that the industry will continue to exhibit significant growth in the next ten years, providing excellent commercial opportunities worldwide.
A lubricant is any substance that is introduced between relatively moving parts to reduce friction and wear rate. They are used in between two or more bodies which are in relative motion with each other to reduce heat and in turn, help in the life of the machine by reducing the wear and tear in them.
The Asia-Pacific region is an emerging region for the automotive industry and is expected to offer promising and attractive perspective for the coming years. The region presents double interest of having large populations to target with sales growth potential and developing ever-growing automotive manufacturing hubs to produce for Asia and the world. The increased demand for oils where lubricants usage for automobiles is of the essence, and the introduction of new models by automobile manufacturers with more varied and extensive usage of composites as steel reaches its limits, are driving demand for the Lubricants market.
Numerous factors will also increase the usage of lubricants in automotive industries such as; the increasing demands of transportation in the 21st century, approaching their end of life, and the new, upgrades, and restoration of residential, and institutional infrastructures.
Visiongain’s The Global Lubricants Market 2017-2027 report can keep you informed and up to date with the developments in the market, across five different regions: North America, Europe, Asia Pacific, Latin America and the Middle East and Africa.
With reference to this report, it details the key investments trend in the global market, subdivided by regions, capital and volume. Through extensive secondary research. visiongain has identified a series of market trends that will impact the Lubricant market over the forecast timeframe.
The report will answer questions such as:
– How is the lubricants market evolving?
– What is driving and restraining lubricants market dynamics?
– How will each lubricant submarket segment grow over the forecast period and how much Sales will these submarkets account for in 2027?
– How will market shares of each lubricants submarket develop from 2017-2027?
– Which individual technologies will prevail and how will these shifts be responded to?
– Which lubricants submarket will be the main driver of the overall market from 2017-2027?
– How will political and regulatory factors influence regional lubricants markets and submarkets?
– Will leading national lubricants markets broadly follow macroeconomic dynamics, or will individual country sectors outperform the rest of the economy?
– How will market shares of the national markets change by 2027 and which nation will lead the market in 2027?
– Who are the leading players and what are their prospects over the forecast period?
– How will the sector evolve as alliances form during the period between 2017 and 2027?
Five Reasons Why You Must Order and Read This Report Today:
1) The Report provides Analysis and Forecasts for the Global Lubricants Markets by
– CAPEX
– Volume
2) The report provides forecasts for the Global Lubricants Market by, for the period 2017-2027
– Mineral Oil
– Synthetic Lubricants
– Semi-Synthetic Lubricants
– Bio-Based Lubricants
3) The report also forecasts and analyses Lubricants Market by application from 2017-2027
– Engine Oil Forecast 2017-2027
– Gear and Brake Oil Forecast 2017-2027
– Transmission Fluids Forecast 2017-2027
– Greases Forecast 2017-2027
– Process Oils Forecast 2017-2027
– Metal Working Fluids Forecast 2017-2027
– Industrial Engine Oils Forecast 2017-2027
– Others (Such as Polytetrafluoroethylene (PTFE)) Forecast 2017-2027
4) The report provides forecasts for the Global Lubricants Market by Geography, for the period 2017-2027
North America Lubricants Market
– US Lubricants Forecast 2017-2027
– Canada Lubricants Forecast 2017-2027
– Mexico Lubricants Forecast 2017-2027
Europe Lubricants Market Forecast
– France Lubricants Forecast 2017-2027
– Germany Lubricants Forecast 2017-2027
– UK Lubricants Forecast 2017-2027
– Spain Lubricants Forecast 2017-2027
– Italy Lubricants Forecast 2017-2027
– Rest of Europe Lubricants Forecast 2017-2027
Asia-Pacific Lubricants Market
– India Lubricants Forecast 2017-2027
– China Lubricants Forecast 2017-2027
– Japan Lubricants Forecast 2017-2027
– South Korea Lubricants Forecast 2017-2027
– Australia Lubricants Forecast 2017-2027
– Rest of Asia-Pacific Lubricants Forecast 2017-2027
Latin America Lubricants Market
– Brazil Lubricants Forecast 2017-2027
– Argentina Lubricants Forecast 2017-2027
– Chile Lubricants Forecast 2017-2027
– Rest of Latin America Lubricants Forecast 2017-2027
Middle East and Africa Lubricants Market
– GCC (Saudi Arabia, Kuwait, the United Arab Emirates, Qatar, Bahrain, and Oman) Lubricants Forecast 2017-2027
– South Africa Lubricants Forecast 2017-2027
– Turkey Lubricants Forecast 2017-2027
– Rest of Middle East & Africa Lubricants Forecast 2017-2027
5) The report provides detailed profiles of the leading companies operating within the Global Lubricants market:
– ExxonMobil Corporation
– Royal Dutch Shell PLC
– British Petroleum
– Chevron Corporation
– FUCHS Lubricants
– IndianOil Corporation
– PetroChina Company Limited
– Valvoline Cummins Limited
– Castrol Limited
– Total S. A.
This independent 184-page report guarantees you will remain better informed than your competitors. With 163 tables and figures examining the Lubricants market space, the report gives you a direct, detailed breakdown of the market. PLUS, Capital expenditure AND Volume are broken down into the Type, Application and Geography. This report that will keep your knowledge that one step ahead of your rivals.
This report is essential reading for you or anyone in the Lubricants sector. Purchasing this report today will help you to recognise those important market opportunities and understand the possibilities there. I look forward to receiving your order.
Visiongain is a trading partner with the US Federal Government
CCR Ref number: KD4R6
1. Report Overview
1.1 Global Lubricants Market Overview
1.2 Why You Should Read This Report
1.3 How This Report Delivers
1.4 Key Questions Answered by This Analytical Report Include:
1.5 Who is This Report For?
1.6 Methodology
1.6.1 Primary Research
1.6.2 Secondary Research
1.6.3 Market Evaluation & Forecasting Methodology
1.7 Frequently Asked Questions (FAQ)
1.8 Associated Visiongain Reports
1.9 About Visiongain
2. Introduction to the Lubricants Market
2.1 Lubricants Market Structure
2.2 What are Lubricants?
2.3 Types of Lubricants
2.4 Major End-User Industries of Lubricants
2.5 The Benefits of using Synthetic Lubricant
2.6 Mineral Oil VS Bio Based Lubricants
2.7 Properties of Lubricants
2.8 Where are Lubricants Used?
3. The Global Lubricants Market Forecast 2017-2027
3.1 Global Lubricants Market Forecast 2017-2027
3.2 Global Lubricants Market Drivers & Restraints
3.3 Global Lubricants Market Analysis
3.4 Global Lubricants Market Dynamics
3.4.1 Drivers
3.4.1.1 Positive Outlook for the Automotive Industry in Asia-Pacific
3.4.1.2 Growth of Industries in Asia-Pacific and African region Opens New Markets for Lubricant Utilization
3.4.1.3 Emergence of Bio-Based Lubricants
3.4.2 Restraints
3.4.2.1 Increasing Popularity of Hybrid Electric Vehicles Expected to Lead to Decline in Demand for Lubricants
3.4.2.2 Stringent Environment Regulations
3.4 Porter’s Five Forces Model
3.4.1 Threat of New Entrants
3.4.2 Threat of Substitutes
3.4.3 Bargaining Power of Suppliers
3.4.4 Bargaining Power of Buyers
3.4.5 Competitive Rivalry
4. The Global Lubricants Market, By Type 2017-2027
4.1 Global Lubricants Submarket, By Type Overview
4.2. Mineral Oil
4.2.1. Mineral Oil Overview
4.2.2. Mineral Oil Market Size and Forecast 2017-2027
4.3. Synthetic Lubricant
4.3.1. Synthetic Lubricant Overview
4.3.2. Synthetic Lubricant Market Size and Forecast 2017-2027
4.3. Semi-Synthetic Lubricant
4.3.1. Semi-Synthetic Lubricant Overview
4.3.2. Semi-Synthetic Lubricant Market Size and Forecast 2017-2027
4.4. Bio-Based Lubricant
4.4.1. Bio-Based Lubricant Overview
4.4.2. Bio-Based Lubricant Market Size and Forecast 2017-2027
5. The Global Lubricants Market, By Application 2017-2027
5.1 Global Lubricants Submarket, By Application Overview
5.2 Engine Oil
5.2.1 Engine Oil Overview
5.2.2 Engine Oil Market Size and Forecast 2017-2027
5.3 Gear and Brake Oil
5.3.1 Gear and Brake Oil Overview
5.3.2 Gear and Brake Oil Market Size and Forecast 2017-2027
5.4 Transmission Fluid
5.4.1 Transmission Fluid Overview
5.4.2 Transmission Fluid Market Size and Forecast 2017-2027
5.5 Grease
5.5.1 Grease Overview
5.5.2 Grease Market Size and Forecast 2017-2027
5.6 Process Oils
5.6.1 Process Oils Overview
5.6.2 Process Oils Market Size and Forecast 2017-2027
5.7 Metal Working Fluids
5.7.1 Metal Working Fluids Overview
5.7.2 Metal Working Fluids Market Size and Forecast 2017-2027
5.8 Industrial Engine Oils
5.8.1 Industrial Engine Oils Overview
5.8.2 Industrial Engine Oils Market Size and Forecast 2017-2027
5.9 Others
5.9.1 Others Overview
5.9.2 Others Market Size and Forecast 2017-2027
6. The Global Lubricants Market By Geography 2017-2027
6.1 Global Lubricants Submarket By Geography Overview
6.1.1 Global Lubricants Market Size and Forecast 2017-2027
6.2 North America Lubricants Market 2017-2027
6.2.1 North America Overview
6.2.2 North America Market Size and Forecast 2017-2027
6.3 Europe Lubricants Market 2017-2027
6.3.1 Europe Overview
6.3.2 Europe Market Size and Forecast 2017-2027
6.4 Asia-Pacific Lubricants Market 2017-2027
6.4.1 Asia-Pacific Overview
6.4.2 Asia-Pacific Market Size and Forecast 2017-2027
6.5 Latin America Lubricants Market 2017-2027
6.5.1 Latin America Overview
6.5.2 Latin America Market Size and Forecast 2017-2027
6.6 Middle East and Africa Lubricants Market 2017-2027
6.6.1 Middle East and Africa Overview
6.6.2 Middle East and Africa Market Size and Forecast 2017-2027
7. The Leading Companies in the Global Lubricants Market
7.1. Leading Lubricant Companies
7.2 ExxonMobil Corporation Company Overview
7.2.1 ExxonMobil Corporation Historic Revenue
7.2.2 ExxonMobil Corporation Brands and Products
7.2.3 ExxonMobil Corporation Brands and Products Description
7.3 Royal Dutch Shell PLC Overview
7.3.1 Royal Dutch Shell PLC Historic Revenue
7.3.2 Royal Dutch Shell PLC Regional Emphasis/Focus
7.3.3 Royal Dutch Shell PLC Mergers & Acquisitions
7.4 BP P.L.C. Overview
7.4.1 BP P.L.C. Historic Revenue
7.4.2 BP P.L.C. Regional Emphasis/Focus
7.5 Chevron Corporation Overview
7.5.1 Chevron Corporation Historic Revenue
7.5.2 Chevron Corporation Lubricants Business Analysis
7.6 FUCHS Lubricants Overview
7.6.1 FUCHS Lubricants Historic Revenue
7.6.2 FUCHS Lubricants Products Analysis
7.7 IndianOil Corporation Limited Overview
7.7.1 IndianOil Corporation Historic Revenue
7.7.2 IndianOil Corporation Key Developments
7.8 PetroChina Company Limited Overview
7.8.1 PetroChina Company Limited Historic Revenue
7.8.2 PetroChina Company Limited Regional Emphasis/Focus
7.8.3 PetroChina Company Limited Key Developments
7.9 Valvoline Cummins Limited Overview
7.9.1 Valvoline Cummins Limited Products Analysis
7.10 Castrol Limited Overview
7.10.1 Castrol Limited Historic Revenue
7.10.2 Castrol Limited Lubricants Business Analysis
7.11 Total S.A. Global Overview
7.11.1 Total S.A. Historic Revenue
7.11.2 Total S.A. Key Developments
7.12. Other Leading Companies in the Global Lubricants Market
8. Conclusion
8.1 Global Lubricants Outlook 2017-2027
8.1.1 National Lubricants Outlook 2017-2027
8.1.2 Lubricants Market Outlook by Application 2017-2027
8.2 Key Findings
9. Glossary
Appendix
Associated Visiongain Reports
Visiongain Report Sales Order Form
Appendix A
Appendix B
Visiongain Report Evaluation Form
List of Tables
Table 3.1 Global Lubricants Market Forecast 2017-2027 (US$m, AGR %, CAGR%)
Table 3.2 Global Lubricants Market Drivers & Restraints
Table 4.1 Global Lubricants Submarket Type Forecast Market 2017-2027 (US$m, CAGR %)
Table 4.2 Global Lubricants Submarket Type Forecast by Volume Market 2017-2027 (Kilotons, CAGR %)
Table 4.3 Mineral Oil Submarket Forecast 2017-2027 (US$m, AGR %, CAGR %)
Table 4.4 Mineral Oil Submarket Forecast, by Volume, 2017-2027 (Kilotons, AGR %, CAGR %)
Table 4.5 Synthetic Lubricant Submarket Forecast, 2017-2027 (US$m, AGR %, CAGR %)
Table 4.6 Synthetic Lubricant Submarket Forecast, by Volume, 2017-2027 (Kilotons, AGR %, CAGR %)
Table 4.7 Semi-Synthetic Lubricant Submarket Forecast, 2017-2027 (US$m, AGR %, CAGR %)
Table 4.8 Semi-Synthetic Lubricant Submarket Forecast, by Volume, 2017-2027 (Kilotons, AGR %, CAGR %)
Table 4.9 Bio-based Lubricant Submarket Forecast, 2017-2027 (US$m, AGR %, CAGR %)
Table 4.10 Bio-based Lubricant Submarket Forecast, by Volume, 2017-2027 (Kilotons, AGR %, CAGR %)
Table 5.1 Global Lubricants Submarket Application Forecast Market 2017-2027 (US$m, AGR %, CAGR %)
Table 5.2 Global Lubricants Submarket Application Forecast by Volume Market 2017-2027 (Kilotons, AGR %, CAGR %)
Table 5.3 Engine Oil Submarket Forecast, 2017-2027 (US$m, AGR %, CAGR %)
Table 5.4 Engine Oil Submarket Forecast, by Volume, 2017-2027 (Kilotons, AGR %, CAGR %)
Table 5.5 Gear and Brake Oil Submarket Forecast, 2017-2027 (US$m, AGR %, CAGR %)
Table 5.6 Gear and Brake Oil Submarket Forecast, by Volume, 2017-2027 (Kilotons, AGR %, CAGR %)
Table 5.7 Transmission Fluid Submarket Forecast, 2017-2027 (US$m, AGR %, CAGR %)
Table 5.8 Transmission Fluid Submarket Forecast, by Volume, 2017-2027 (Kilotons, AGR %, CAGR %)
Table 5.9 Grease Submarket Forecast, 2017-2027 (US$m, AGR %, CAGR %)
Table 5.10 Greases Submarket Forecast, by Volume, 2017-2027 (Kilotons, AGR %, CAGR %)
Table 5.11 Process Oil Submarket Forecast, 2017-2027 (US$m, AGR %, CAGR %)
Table 5.12 Process Oils Submarket Forecast, by Volume, 2017-2027 (Kilotons, AGR %, CAGR %)
Table 5.13 Metal Working Fluids Submarket Forecast, 2017-2027 (US$m, AGR %, CAGR %)
Table 5.14 Metal Working Fluids Submarket Forecast, by Volume, 2017-2027 (Kilotons, AGR %, CAGR %)
Table 5.15 Industrial Engine Oil Submarket Forecast, 2017-2027 (US$m, AGR %, CAGR %)
Table 5.16 Industrial Engine Oil Submarket Forecast, by Volume, 2017-2027 (Kilotons, AGR %, CAGR %)
Table 5.17 Others Submarket Forecast, 2017-2027 (US$m, AGR %, CAGR %)
Table 5.18 Others Submarket Forecast, by Volume, 2017-2027 (Kilotons, AGR %, CAGR %)
Table 6.1 Global Lubricants Market Forecast, by Country, 2017-2027 (US$m, AGR %, CAGR %)
Table 6.2 Global Lubricants Market Forecast, by Country, 2017-2027 (Kilotons, AGR %, CAGR %)
Table 6.3 North America Lubricants Market Forecast, 2017-2027 (US$m, AGR %, CAGR %)
Table 6.4 North America Lubricants Market Forecast, by Volume, 2017-2027 (Kilotons, AGR %, CAGR %)
Table 6.5 Europe Lubricants Market Forecast, 2017-2027 (US$m, AGR %, CAGR %)
Table 6.6 Europe Lubricants Market Forecast, by Country, 2017-2027 (Kilotons, AGR %, CAGR %)
Table 6.7 Asia-Pacific Lubricants Market Forecast, 2017-2027 (US$m, AGR %, CAGR %)
Table 6.8 Asia-Pacific Lubricants Market Forecast, by Volume, 2017-2027 (Kilotons, AGR %, CAGR %)
Table 6.9 Latin America Lubricants Market Forecast, 2017-2027 (US$m, AGR %, CAGR %)
Table 6.10 Latin America Lubricants Market Forecast, by Volume, 2017-2027 (Kilotons, AGR %, CAGR %)
Table 6.11 Middle East and Africa Lubricants Market Forecast, 2017-2027 (US$m, AGR %, CAGR %)
Table 6.12 Middle East and Africa Lubricants Market Forecast, by Volume, 2017-2027 (Kilotons, AGR %, CAGR %)
Table 7.1 ExxonMobil Corporation Company Overview (Total Revenue $m), Revenue From the lubricants market ($m), Revenue from the lubricants market (%), Key Executives, HQ, IR Contact, Website), 2016
Table 7.2 ExxonMobil Corporation Business Segments, Revenue From Segments ($m, % Share), 2016
Table 7.3 ExxonMobil Corporation Historic Revenue ($m, AGR%), 2012-2015
Table 7.4 ExxonMobil Corporation Product Lines and Products, 2016
Table 7.5 Royal Dutch Shell PLC Overview (Total Revenue $m), Revenue From the lubricants market ($m), Revenue from the lubricants market (%), Key Executives, HQ, IR Contact, Website), 2016
Table 7.6 Royal Dutch Shell PLC Business Segments, Revenue From Segments ($m, % Share), 2016
Table 7.7 Royal Dutch Shell PLC Historic Revenue ($m, AGR%), 2012-2015
Table 7.8 Royal Dutch Shell PLC Lubricants Product Brands and Product Lines, 2016
Table 7.9 Royal Dutch Shell PLC Recent M&A (Company, Business Focus, Completion Date, Currency, Acquisition Price)
Table 7.10 BP P.L.C. Overview (Total Revenue $m), Revenue From the lubricants market ($m), Revenue from the lubricants market (%), Key Executives, HQ, IR Contact, Website), 2016
Table 7.11 BP P.L.C. Business Segments, Revenue From Segments ($m, % Share), 2016
Table 7.12 Royal Dutch Shell PLC Historic Revenue ($m, AGR%), 2010-2014
Table 7.13 BP P.L.C. Lubricants Product Brands and Product Lines, 2015
Table 7.14 Chevron Corporation Overview (Total Revenue $m), Revenue From the lubricants market ($m), Revenue from the lubricants market (%), Key Executives, HQ, IR Contact, Website), 2016
Table 7.15 Chevron Corporation Business Segments, Revenue From Segments ($m, % Share), 2015
Table 7.16 Chevron Corporation Historic Revenue ($m, AGR%), 2012-2015
Table 7.17 Chevron Corporation Lubricants Product Brands and Product Lines, 2015
Table 7.18 FUCHS Lubricants Overview (Total Revenue $m), Revenue From the lubricants market ($m), Revenue from the lubricants market (%), Key Executives, HQ, IR Contact, Website), 2016
Table 7.19 FUCHS Lubricants Historic Revenue ($m, AGR%), 2012-2015
Table 7.20 FUCHS Lubricants Products, 2015
Table 7.21 IndianOil Corporation Overview (Total Revenue $m), Revenue From the lubricants market ($m), Revenue from the lubricants market (%), Key Executives, HQ, IR Contact, Website), 2016
Table 7.22 IndianOil Corporation Historic Revenue ($m, AGR%), 2012-2015
Table 7.24 IndianOil Corporation Lubricants Product Brands and Product Lines, 2015
Table 7.25 IndianOil Corporation Recent M&A (Company, Business Focus, Completion Date, Currency, Acquisition Price)
Table 7.26 PetroChina Company Limited Overview (Total Revenue $m), Revenue From the lubricants market ($m), Revenue from the lubricants market (%), Key Executives, HQ, IR Contact, Website), 2016
Table 7.27 PetroChina Company Business Segments, Revenue From Segments ($m, % Share), 2016
Table 7.28 PetroChina Company Limited Historic Revenue ($m, AGR%), 2012-2015
Table 7.29 PetroChina Company Limited Recent M&A (Company, Business Focus, Completion Date, Currency, Acquisition Price)
Table 7.30 Valvoline Cummins Limited Overview (Total Revenue $m), Revenue From the lubricants market ($m), Revenue from the lubricants market (%), Key Executives, HQ, IR Contact, Website), 2016
Table 7.31 Valvoline Cummins Limited Business Segments, Volume From Segments (m, % Share), 2016
Table 7.32 Valvoline Cummins Limited Lubricants Product Brands and Product Lines, 2016
Table 7.33 Valvoline Regional Revenue From Segments (% Share), 2016
Table 7.34 Castrol Limited Overview (Total Revenue $m), Revenue From the lubricants market ($m), Revenue from the lubricants market (%), Key Executives, HQ, Website), 2016
Table 7.35 Castrol Ltd. Lubricants Product Brands and Product Lines, 2016
Table 7.36 Castrol Limited Historic Revenue ($m, AGR%), 2011-2015
Table 7.37 Total S. A. (Total Revenue $m), Revenue From the lubricants market ($m), Revenue from the lubricants market (%), Key Executives, HQ, IR Contact, Website), 2016
Table 7.38 Total S.A. Historic Revenue ($m, AGR%), 2011-2015
Table 7.39 Total S.A. Recent M&A (Company, Business Focus, Completion Date, Currency, Acquisition Price)
Table 7.40 Other Leading Companies in the Global Lubricants Market
Table 8.1 Global Lubricants Market Forecast Summary 2017, 2022, 2027 ($bn, AGR %, CAGR %)
Table 8.2 Leading National CFRP Composite Markets Forecast Summary 2017, 2022, 2027 ($bn, AGR %, CAGR %)
Table 8.3 Global CFRP Composites Market by Application Forecast Summary 2017, 2022, 2027 ($bn, AGR %, CAGR %)
List of Figures
Figure 1.1 Germany Lubricants Market Forecast ($m), 2017-2027
Figure 1.2 Global Lubricants Market Segmentation
Figure 1.3 Example of Lubricants Market by Regional Market Share Forecast 2017, 2022, 2027 (% Share)
Figure 1.4 Example of Leading National Lubricants Market Forecast by Submarket 2017-2027 (US$m)
Figure 1.5 Example of Leading National Lubricants Market Forecast by Submarket 2017-2027 (US$m, AGR %)
Figure 1.6 Example of National vs Global Lubricants Market CAGR Forecast 2017-2027, 2017-2022, 2022-2027 (CAGR %)
Figure 2.1 Global Lubricants Market Segmentation Overview
Figure 2.2 Types of Lubricants
Figure 3.1 Global Lubricants Market Forecast 2017-2027 (US$m, AGR%)
Figure 3.2 Environmentally Acceptable Lubricants (EAL)
Figure 4.1 Global Lubricants Submarket by Type Forecasts (US$m) 2017-2027
Figure 4.2 Global Lubricants Submarket by Type Forecast (AGR %) 2017-2027
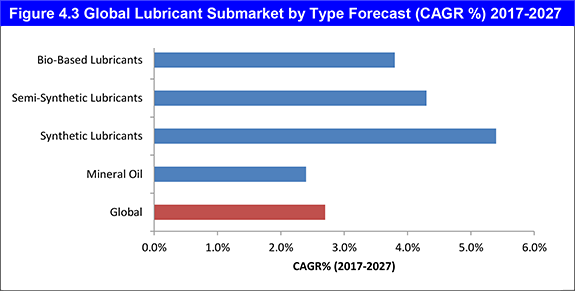
Figure 4.3 Global Lubricant Submarket by Type Forecast (CAGR %) 2017-2027
Figure 5.1 Global Lubricants Submarket by Application Forecasts 2017-2027 (US$m)
Figure 5.2 Global Lubricants Submarket by Application Forecast (AGR %) 2017-2027
Figure 5.3 Global Lubricant Submarket by Application Forecast (CAGR%) 2017-2027
Figure 6.1 Global Lubricants Submarket by Country Forecasts (US$m) 2017-2027
Figure 6.2 Global Lubricants Submarket by Country Forecast (AGR %) 2017-2027
Figure 6.3 Global Lubricant Submarket by Application Forecast (CAGR %) 2017-2027
Figure 6.4 North America Lubricants Submarket by Type Forecasts (US$m) 2017-2027 (US$m)
Figure 6.5 North America Lubricants Submarket by Type Forecast (AGR %) 2017-2027
Figure 6.6 North America Lubricants Submarket by Type Forecast (CAGR %) 2017-2027
Figure 6.7 North America Lubricants Submarket by Application Forecasts (US$m) 2017-2027
Figure 6.8 North America Lubricants Submarket by Application Forecast (AGR %) 2017-2027
Figure 6.9 North America Lubricants Submarket by Application Forecast (CAGR %) 2017-2027
Figure 6.10 North America Lubricants Submarket by Country Forecasts (US$m) 2017-2027
Figure 6.11 North America Lubricants Submarket by Country Forecast (AGR %) 2017-2027
Figure 6.13 Europe Lubricants Submarket by Type Forecasts (US$m) 2017-2027
Figure 6.14 Europe Lubricants Submarket by Type Forecast (AGR %) 2017-2027
Figure 6.15 Europe Lubricants Submarket by Type Forecast (CAGR %) 2017-2027
Figure 6.16 Europe Lubricants Submarket by Application Forecasts (US$m) 2017-2027
Figure 6.17 Europe Lubricants Submarket by Application Forecast (AGR %) 2017-2027
Figure 6.18 Europe Lubricants Submarket by Application Forecast (CAGR %) 2017-2027
Figure 6.19 Europe Lubricants Submarket by Country Forecasts (US$m) 2017-2027
Figure 6.20 Europe Lubricants Submarket by Country Forecast (AGR %) 2017-2027
Figure 6.21 Europe Lubricant Submarket by Country Forecast (CAGR %) 2017-2027
Figure 6.22 Asia-Pacific Lubricants Submarket by Type Forecasts (US$m) 2017-2027
Figure 6.23 Asia-Pacific Lubricants Submarket by Type Forecast (AGR %) 2017-2027
Figure 6.24 Asia-Pacific Lubricants Submarket by Type Forecast (CAGR %) 2017-2027
Figure 6.25 Asia-Pacific Lubricants Submarket by Application Forecasts (US$m) 2017-2027
Figure 6.26 Asia-Pacific Lubricants Submarket by Application Forecast (AGR %) 2017-2027
Figure 6.27 Asia-Pacific Lubricants Submarket by Application Forecast (CAGR %) 2017-2027
Figure 6.28 Asia-Pacific Lubricants Submarket by Country Forecasts (US$m) 2017-2027
Figure 6.29 Asia-Pacific Lubricants Submarket by Country Forecast (AGR %) 2017-2027
Figure 6.30 Asia-Pacific Lubricant Submarket by Country Forecast (CAGR %) 2017-2027
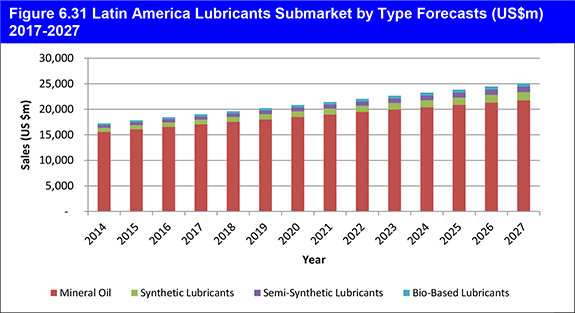
Figure 6.31 Latin America Lubricants Submarket by Type Forecasts (US$m) 2017-2027
Figure 6.32 Latin America Lubricants Submarket by Type Forecast (AGR %) 2017-2027
Figure 6.33 Latin America Lubricants Submarket by Type Forecast (CAGR %) 2017-2027
Figure 6.34 Latin America Lubricants Submarket by Application Forecasts (US$m) 2017-2027
Figure 6.35 Latin America Lubricants Submarket by Application Forecast (AGR %) 2017-2027
Figure 6.36 Latin America Lubricants Submarket by Application Forecast (CAGR %) 2017-2027
Figure 6.37 Latin America Lubricants Submarket by Country Forecasts (US$m) 2017-2027
Figure 6.38 Latin America Lubricants Submarket by Country Forecast (AGR %) 2017-2027
Figure 6.39 Latin America Lubricant Submarket by Country Forecast (CAGR %) 2017-2027
Figure 6.40 Middle East and Africa Lubricants Submarket by Type Forecasts (US$m) 2017-2027
Figure 6.41 Middle East and Africa Lubricants Submarket by Type Forecast (AGR %) 2017-2027
Figure 6.42 Middle East and Africa Lubricants Submarket by Type Forecast (CAGR %) 2017-2027
Figure 6.43 Middle East and Africa Lubricants Submarket by Application Forecasts (US$m) 2017-2027
Figure 6.44 Middle East and Africa Lubricants Submarket by Application Forecast (AGR %) 2017-2027
Figure 6.45 Middle East and Africa Lubricants Submarket by Application Forecast (CAGR %) 2017-2027
Figure 6.46 Middle East and Africa Lubricants Submarket by Country Forecasts (US$m) 2017-2027
Figure 6.47 Middle East and Africa Lubricants Submarket by Country Forecast (AGR %) 2017-2027
Figure 6.48 Middle East and Africa Lubricant Submarket by Country Forecast (CAGR %) 2017-2027
Figure 7.1 ExxonMobil Corporation Business Segments Revenue Chart (%), 2016
Figure 7.2 ExxonMobil Corporation Historic Revenue ($m, AGR%), 2012-2015
Figure 7.3 Royal Dutch Shell PLC Business Segments Revenue Chart (%), 2016
Figure 7.4 Royal Dutch Shell PLC Historic Revenue ($m, AGR%), 2012-2015
Figure 7.5 Royal Dutch Shell PLC Regional Emphasis/ Focus (% Share), 2016
Figure 7.6 BP P.L.C. Business Segments Revenue Chart (%), 2016
Figure 7.7 BP P.L.C. Historic Revenue ($m, AGR%), 2010-2014
Figure 7.8 BP P.L.C. Regional Emphasis/ Focus (% Share), 2016
Figure 7.9 Chevron Corporation Historic Revenue ($m, AGR%), 2012-2015
Figure 7.10 FUCHS Lubricants Historic Revenue ($m, AGR%), 2012-2015
Figure 7.11 IndianOil Corporation Historic Revenue ($m, AGR%), 2012-2015
Figure 7.12 PetroChina Company Limited Historic Revenue ($m, AGR%), 2012-2015
Figure 7.13 PetroChina Company Limited Regional Emphasis/ Focus (% Share), 2016
Figure 7.14 Valvoline Cummins Limited Regional Emphasis/ Focus (% Share), 2016
Figure 7.15 Castrol Limited Historic Revenue ($m, AGR%), 2011-2015
Figure 7.16 Total S.A. Historic Revenue ($m, AGR%), 2011-2015


