Bleeding Disorder Treatment – our new study reveals trends, R&D progress, and predicted revenues
Where is the Bleeding Disorder Treatment market heading? If you are involved in this sector you must read this newly updated report. Visiongain’s report shows you the potential revenues streams to 2027, assessing data, trends, opportunities and business prospects there.
Discover how to stay ahead
Our 172-page report provides 153 tables, charts, and graphs. Read on to discover the most lucrative areas in the industry and the future market prospects. Our new study lets you assess forecasted sales at overall world market and regional level. See financial results, trends, opportunities, and revenue predictions. Much opportunity remains in this growing Bleeding Disorder Treatment market. See how to exploit the opportunities.
Forecasts to 2027 and other analyses reveal the commercial prospects
• In addition to revenue forecasting to 2027, our new study provides you with recent results, growth rates, and market shares.
• You find original analyses, with business outlooks and developments.
• Discover qualitative analyses (including market dynamics, drivers, opportunities, restraints and challenges), product profiles and commercial developments.
Discover sales predictions for the world market and submarkets
Along with revenue prediction for the overall world market, there are forecasts for 7 Bleeding Disorder Treatment Types, each forecasted at a global and regional level.
Bleeding Disorder Treatments, by Indication
• Haemophilia A
• Haemophilia B
• Von Willebrand Disease (VWD)
• Other Bleeding Disorders
Bleeding Disorder Treatments, by Drug Class
• Plasma-derived Coagulation Factor Concentrates
• Factor VIII
• Factor IX
• Von Willebrand Disease Factor
• Prothrombin Complex Concentrate Factor
• Recombinant Coagulation Factor Concentrates:
– Factor VIII
– Factor IX
– Von Willebrand Disease Factor
• Desmopressin
• Antifibrinolytics
• Fibrin Sealants
• Others
In addition to the revenue predictions for the overall world market and segments, you will also find revenue forecasts for 5 regional and 19 leading national markets:
• North America:
• The U.S.
• Canada
• Mexico
• South America:
• Brazil
• Argentina
• Paraguay
• Bolivia
• Rest of South America
• Europe:
• Germany
• France
• The UK
• Italy
• Spain
• Rest of Europe
• Asia-Pacific:
• Japan
• China
• India
• Australia
• Thailand
• Rest of Asia
• Rest of World (RoW):
• Middle East
• Africa
• Other Countries
The report also includes profiles and for some of the leading companies in the Bleeding Disorder Treatment market, with a focus on this segment of these companies’ operations.
There will be growth in both established and in developing countries. Our analyses show that the both developed and developing markets, China, India and Australia in particular, will continue to achieve high revenue growth to 2027.
Leading companies and the potential for market growth
Overall world revenue for Bleeding Disorder Treatment will surpass $6bn in 2017, our work calculates. We predict strong revenue growth through to 2027.
Our work identifies which organisations hold the greatest potential. Discover their capabilities, progress, and commercial prospects, helping you stay ahead.
How the Bleeding Disorder Treatment Market report helps you
In summary, our 172-page report provides you with the following knowledge:
• Revenue forecasts to 2027 for the Bleeding Disorder Treatment market with forecasts for 4 Indications and 5 Drug Classes – discover the industry’s prospects, finding the most lucrative places for investments and revenues
• Revenue forecasts to 2027 for 5 regional and 19 key national markets – see forecasts for the Bleeding Disorder treatment market in North America, South America, Europe, Asia-Pacific and the rest of the world. Also analysed are the national markets in the US, Canada, Mexico, Brazil, Argentina, Paraguay, Bolivia, Germany, France, the UK, Italy, Spain, Japan, China, India, Australia, Thailand, the Middle East and Africa.
• Discussion of what stimulates and restrains companies and the market
• Prospects for established firms and those seeking to enter the market – including company profiles for 10 of the major companies involved in the Bleeding Disorder Treatment market
Find quantitative and qualitative analyses with independent predictions. Receive information that only our report contains, staying informed with this invaluable business intelligence.
Information found nowhere else
With our newly updated report title, you are less likely to fall behind in knowledge or miss out on opportunities. See how our work could benefit your research, analyses, and decisions.
Visiongain’s study is for everybody needing commercial analyses for the Bleeding Disorder Treatment market and leading companies. You will find data, trends and predictions.
Get our report today World Bleeding Disorders Treatment Market 2017-2027: Forecast and Analysis by Indication (Haemophilia A, Haemophilia B, Von Willebrand Disease), Drug Class (Plasma-Derived Coagulation Factor Concentrates, Recombinant Coagulation Factor Concentrates, Desmopressin, Antifibrinolytics, Fibrin Sealants) and Geography.
Visiongain is a trading partner with the US Federal Government
CCR Ref number: KD4R6
1. Report Overview
1.1 Global Bleeding Disorders Treatment Market Overview
1.2 Market Definition
1.3 Research Methodology
1.3.1 Primary Research
1.3.2 Secondary Research
1.3.3 Market Evaluation & Forecasting Methodology
1.4 Global Bleeding Disorders Treatment Market Segmentation
1.5 Structure of the Report
1.6 Why You Should Read This Report
1.7 How this Report Delivers
1.8 Key Questions Answered by This Analytical Report
1.9 Frequently Asked Questions (FAQ)
1.10 Who is This Report For?
1.11 Associated Visiongain Reports
1.12 About Visiongain
2. Introduction to Bleeding Disorders Treatment Market
3. Global Bleeding Disorders Treatment Market Forecast to 2027
4. Global Bleeding Disorders Treatment Market by Indication Forecast to 2027
4.1 Overview
4.2 Haemophilia A
4.3 Haemophilia B
4.4 Von Willebrand Disease (VWD)
4.5 Others
5. Global Bleeding Disorders Treatment Market by Drug Class: Market Forecast to 2027
5.1 Overview
5.2 Plasma-derived Coagulation Factor Concentrates
5.2.1 Factor VIII
5.2.2 Factor IX
5.2.3 Von Willebrand Disease Factor
5.2.4 Factor Prothrombin Complex Concentrate
5.3 Recombinant Coagulation Factor Concentrates
5.3.1 Factor VIII
5.3.2 Factor IX
5.3.3 Von Willebrand Disease Factor
5.4 Desmopressin
5.5 Antifibrinolytics
5.6 Fibrin Sealants
5.7 Others
6. Regional Bleeding Disorders Treatment Market Forecasts to 2027
6.1 Regional Bleeding Disorders Treatment Market Forecast Overview
6.2 North American Bleeding Disorders Treatment Market Forecast 2016-2027
6.2.1 USA Bleeding Disorders Treatment Market Forecast 2016-2027
6.2.2 Canada Bleeding Disorders Treatment Market Forecast 2016-2027
6.2.3 Mexico Bleeding Disorders Treatment Market Forecast 2016-2027
6.3 South American Bleeding Disorders Treatment Market Forecast 2016-2027
6.3.1 Brazil Bleeding Disorders Treatment Market Forecast 2016-2027
6.3.2 Argentina Bleeding Disorders Treatment Market Forecast 2016-2027
6.3.3 Paraguay Bleeding Disorders Treatment Market Forecast 2016-2027
6.3.4 Bolivia Bleeding Disorders Treatment Market Forecast 2016-2027
6.3.5 Rest of South America Bleeding Disorders Treatment Market Forecast 2016-2027
6.4 European Bleeding Disorders Treatment Market Forecast 2016-2027
6.4.1 France Bleeding Disorders Treatment Market Forecast 2016-2027
6.4.2 Germany Bleeding Disorders Treatment Market Forecast 2016-2027
6.4.3 UK Bleeding Disorders Treatment Market Forecast 2016-2027
6.4.4 Spain Bleeding Disorders Treatment Market Forecast 2016-2027
6.4.5 Italy Bleeding Disorders Treatment Market Forecast 2016-2027
6.4.6 Rest of Europe Bleeding Disorders Treatment Market Forecast 2016-2027
6.5 Asia-Pacific Bleeding Disorders Treatment Market Forecast 2016-2027
6.5.1 China Bleeding Disorders Treatment Market Forecast 2016-2027
6.5.2 Japan Bleeding Disorders Treatment Market Forecast 2016-2027
6.5.3 India Bleeding Disorders Treatment Market Forecast 2016-2027
6.5.4 Australia Bleeding Disorders Treatment Market Forecast 2016-2027
6.5.5 Thailand Bleeding Disorders Treatment Market Forecast 2016-2027
6.5.6 Rest of Asia-Pacific Bleeding Disorders Treatment Market Forecast 2016-2027
6.6 Rest of World Bleeding Disorders Treatment Market Forecast 2016-2027
6.6.1 Middle East Bleeding Disorders Treatment Market Forecast 2016-2027
6.6.2 Africa Cancer Bleeding Disorders Treatment Forecast 2016-2027
6.6.3 Other Countries Bleeding Disorders Treatment Market Forecast 2016-2027
7. Bleeding Disorders Treatment Market, Qualitative Analysis, 2016-2027
7.1 Porter’s Five Forces Analysis of the Bleeding Disorders Treatment Market 2016-2027
7.1.1 Bargaining Power of Buyers (Low)
7.1.2 Bargaining Power of Suppliers (Medium)
7.1.3 Threat of New Entrants (Low)
7.1.4 Threat of Substitute Products (Low)
7.1.5 Intensity of Competitive Rivalry (High)
7.2 Drivers, Restrains & Opportunities
7.2.1 Drivers
7.2.2 Restraints
7.2.3 Opportunities
8. Leading Companies in Bleeding Disorders Treatment Market
8.1 Novo Nordisk A/S (Novo Nordisk)
8.1.1 Novo Nordisk: Company Overview
8.1.2 Novo Nordisk: Financial Overview
8.1.3 Novo Nordisk: Product Portfolio
8.1.4 Novo Nordisk: Recent Developments
8.2 Bristol-Myers Squibb
8.2.1 Bristol-Myers Squibb: Company Overview
8.2.2 Bristol Myers Squibb: Financial Overview
8.2.3 Bristol-Myers Squibb: Product Portfolio
8.2.4 Bristol-Myers Squibb: Recent Developments
8.3 Pfizer Inc.
8.3.1 Pfizer Inc.: Company Overview
8.3.2 Pfizer, Inc.: Financial Overview
8.3.3 Pfizer Inc.: Product Portfolio
8.3.4 Pfizer Inc.: Recent Developments
8.4 Bayer AG
8.4.1 Bayer AG: Company Overview
8.4.2 Bayer AG: Financial Overview
8.4.3 Bayer AG: Product Portfolio
8.4.4 Bayer AG: Recent Developments
8.5 CSL, LTD. (CSL)
8.5.1 CSL: Company Overview
8.5.2 CSL Financial Overview
8.5.3 CSL.: Product Portfolio
8.5.4 CSL: Recent Developments
8.6 Grifols S.A. (Grifols)
8.6.1 Grifols: Company Overview
8.6.2 Grifols: Financial Overview
8.6.3 Grifols: Product Portfolio
8.6.4 Grifols: Recent Developments
8.7 Octapharma AG (Octapharma)
8.7.1 Octapharma: Company Overview
8.7.2 Octapharma: Financial Overview
8.7.3 Octapharma: Product Portfolio
8.7.4 Octapharma: Recent Developments
8.8 Shire PLC (Shire)
8.8.1 Shire: Company Overview
8.8.2 Shire: Financial Overview
8.8.3 Shire: Product Portfolio
8.8.4 Shire: Recent Developments
8.9 Sanofi
8.9.1 Sanofi: Company Overview
8.9.2 Sanofi: Financial Overview
8.9.3 Sanofi: Product Portfolio
8.9.4 Sanofi: Recent Developments
8.10 Kedrion S.P.A (Kedrion)
8.10.1 Kendrion: Company Overview
8.10.2 Kedrion: Financial Overview
8.10.3 Kedrion: Product Portfolio
8.10.4 Kedrion: Recent Developments
8.11 Other Companies in the Bleeding Disorders Treatment Market
9. Conclusions
9.1 Current Leading Segments
9.2 Leading Regional Markets
9.3 Emerging Markets
9.4 The Future of the Market?
10. Glossary
Associated Visiongain Reports
Visiongain Report Sales Order Form
Appendix A
About Visiongain
Appendix B
Visiongain report evaluation form
List of Figures
Figure 1.1. Bleeding Disorders Treatment Market Segmentation
Figure 2.1 Top winning Strategies of Market Players in Bleeding Disorders Market, 2014-2016
Figure 3.1 Bleeding Disorders Treatment, by Type, ($m), 2016-2027
Figure 3.2 Global Bleeding Disorders Treatment Market, by Drug Class, ($m), 2016-2027
Figure 4.1. Global Bleeding Disorders Treatment Market Forecast, by Type ($m) 2016-2027
Figure 4.2 Bleeding Disorders Treatment Market, by Type, Market Share (%), 2016
Figure 4.3 Global Haemophilia A for Bleeding Disorders Treatment Market Forecast, by Geography, ($m) 2016-2027
Figure 4.4 Global Haemophilia B for Bleeding Disorders Treatment Market Forecast, by Geography, ($m) 2016-2027
Figure 4.5 Global Von Willebrand Disease for Bleeding Disorders Treatment Market Forecast, by Geography, ($m) 2016-2027
Figure 4.6 Global Other Bleeding Disorders Treatment Market Forecast, by Geography, ($m) 2016-2027
Figure 5.1. Global Bleeding Disorder Treatment Market: Drug Class Segmentation
Figure 5.2. Global Bleeding Disorders Treatment Market, by Application, Market Share (%), 2016
Figure 5.3. Global Bleeding Disorders Treatment Market for Plasma-derived Coagulation Factor Concentrates Forecast, by Geography($m) 2016-2027
Figure 5.4. Global Bleeding Disorders Treatment Market for Recombinant Coagulation Factor Concentrates Forecast, by Geography($m) 2016-2027
Figure 5.5. Global Bleeding Disorders Treatment Market for Desmopressin Forecast, by Geography($m) 2016-2027
Figure 5.6. Global Bleeding Disorders Treatment Market for Antifibrinolytics Forecast, by Geography($m) 2016-2027
Figure 5.7. Global Bleeding Disorders Treatment Market for Fibrin Sealants Forecast, by Geography($m) 2016-2027
Figure 5.8. Global Bleeding Disorders Treatment Market for Other Drug Classes Forecast, by Geography($m) 2016-2027
Figure 6.1. Global Bleeding Disorders Treatment Market Forecast, by Geography, by Geography($m) 2016-2027
Figure 6.2. Global Bleeding Disorders Treatment Market Forecast, by Geography, Market Share (%), 2016
Figure 6.3. North America Bleeding Disorders Treatment Market Forecast, by Country($m) 2016-2027
Figure 6.4. North America Bleeding Disorders Treatment Market, by Country, Market Share (%), 2016
Figure 6.5. USA Bleeding Disorders Treatment Market Forecast ($m) 2016-2027
Figure 6.6 Percentage of people with Haemophilia A (Statistic, 2014)
Figure 6.7. Canada Bleeding Disorders Treatment Market Forecast ($m) 2016-2027
Figure 6.8 Mexico Bleeding Disorders Treatment Market Forecast ($m) 2016-2027
Figure 6.9 South America Bleeding Disorders Treatment Market Forecast, by Country($m) 2016-2027
Figure 6.10. South America Bleeding Disorders Treatment Market, by Country, Market Share (%), 2016
Figure 6.11. Brazil Bleeding Disorders Treatment Market Forecast ($m) 2016-2027
Figure 6.12. Argentina Bleeding Disorders Treatment Market Forecast ($m) 2016-2027
Figure 6.13. Paraguay Bleeding Disorders Treatment Market Forecast ($m) 2016-2027
Figure 6.14. Bolivia Bleeding Disorders Treatment Market Forecast ($m) 2016-2027
Figure 6.15. Rest of South America Bleeding Disorders Treatment Market Forecast ($m) 2016-2027
Figure 6.16. Europe Bleeding Disorders Treatment Market Forecast, by Country($m) 2016-2027
Figure 6.17. Europe Bleeding Disorders Treatment Market, by Country, Market Share (%), 2016
Figure 6.18. France Bleeding Disorders Treatment Market Forecast ($m) 2016-2027
Figure 6.19. Germany Bleeding Disorders Treatment Market Forecast ($m) 2016-2027
Figure 6.20. UK Bleeding Disorders Treatment Market Forecast ($m) 2016-2027
Figure 6.21. Spain Bleeding Disorders Treatment Market Forecast ($m) 2016-2027
Figure 6.22. Italy Bleeding Disorders Treatment Market Forecast ($m) 2016-2027
Figure 6.23. Rest of Europe Bleeding Disorders Treatment Market Forecast ($m) 2016-2027
Figure 6.24. Asia-Pacific Bleeding Disorders Treatment Market Forecast, by Country($m) 2016-2027
Figure 6.25. Asia-Pacific Bleeding Disorders Treatment Market, Market Share (%), 2016
Figure 6.26. China Bleeding Disorders Treatment Market Forecast ($m) 2016-2027
Figure 6.27. Japan Bleeding Disorders Treatment Market Forecast ($m) 2016-2027
Figure 6.28. India Bleeding Disorders Treatment Market Forecast ($m) 2016-2027
Figure 6.29. Australia Bleeding Disorders Treatment Market Forecast ($m) 2016-2027
Figure 6.30. Thailand Bleeding Disorders Treatment Market Forecast ($m) 2016-2027
Figure 6.31. Rest of Asia-Pacific Bleeding Disorders Treatment Market Forecast ($m) 2016-2027
Figure 6.32. RoW Bleeding Disorders Treatment Market Forecast, by Country($m) 2016-2027
Figure 6.33. Rest of World Bleeding Disorders Treatment Market, by Country, Market Share (%), 2016
Figure 6.34. Middle East Bleeding Disorders Treatment Market Forecast ($m) 2016-2027
Figure 6.35. Africa Bleeding Disorders Treatment Market Forecast ($m) 2016-2027
Figure 6.36. Other Countries Bleeding Disorders Treatment Market Forecast ($m) 2016-2027
Figure 7.1 Porter’s Five Forces Analysis of the Bleeding Disorders Treatment Market
Figure 9.1 World Bleeding Disorders Treatment, by Type, ($m), 2016-2027
Figure 9.2 World Bleeding Disorders Treatment, by Drug Type, ($m), 2016-2027
Figure 9.3. World Bleeding Disorders Treatment, by Geography, ($m), 2016-2027
List of Tables
Table 2.1 Global Demographics: People suffering from haemophilia and other bleeding disorders
Table 3.1. Global Bleeding Disorders Treatment Market Forecast ($m, AGR%, CAGR%) 2016-2027
Table 4.1 Bleeding Disorders Treatment Market, by Type, Forecast ($m, AGR%, CAGR%) 2016-2027
Table 4.2.Key Haemophilia A Drugs approved by FDA
Table 4.3. Global Haemophilia A for Bleeding Disorders Treatment Market Forecast, ($m, AGR%, CAGR%) 2016-2027
Table 4.4. Global Haemophilia A for Bleeding Disorders Treatment Market Forecast, by Geography, ($m, AGR%, CAGR%) 2016-2027
Table 4.5.Key Haemophilia B Drugs approved by FDA
Table 4.6. Global Haemophilia B for Bleeding Disorders Treatment Market Forecast, ($m, AGR%, CAGR%) 2016-2027
Table 4.7. Global Haemophilia B for Bleeding Disorders Treatment Market Forecast, by Geography ($m, AGR%, CAGR%) 2016-2027
Table 4.8. Global Von Willebrand Disease for Bleeding Disorders Treatment Market Forecast, ($m, AGR%, CAGR%) 2016-2027
Table 4.9. Global Von Willebrand Disease for Bleeding Disorders Treatment Market, by Geography ($m, AGR%, CAGR%) 2016-2027
Table 4.10. Global Other Bleeding Disorders Treatment Market Forecast, ($m, AGR%, CAGR%) 2016-2027
Table 4.11. Global Other Bleeding Disorders Treatment Market Forecast, by Geography ($m, AGR%, CAGR%) 2016-2027
Table 5.1. Global Blood Disorders Treatment Market, by Drug Class($m, AGR%, CAGR%) 2016-2027
Table 5.2. Types of Monoclonal Antibodies
Table 5.3. Global Bleeding Disorders Treatment Market for Plasma-Derived Coagulation Factor Concentrates, ($m, AGR%, CAGR%) 2016-2027
Table 5.4. Global Bleeding Disorders Treatment Market for Plasma-derived Coagulation Factor Concentrates, by Geography ($m, AGR%, CAGR%) 2016-2027
Table 5.5. Global Blood Disorders Treatment Market for Recombinant Coagulation Factor Concentrates ($m, AGR%, CAGR%) 2016-2027
Table 5.6. Global Bleeding Disorders Treatment Market for Recombinant Coagulation Factor Concentrates, by Geography ($m, AGR%, CAGR%) 2016-2027
Table 5.7. Global Blood Disorders Treatment Market for Desmopressin ($m, AGR%, CAGR%) 2016-2027
Table 5.8. Global Bleeding Disorders Treatment Market for Desmopressin, by Geography ($m, AGR%, CAGR%) 2016-2027
Table 5.9 Global Blood Disorders Treatment Market for Antifibrinolytics Concentrates ($m, AGR%, CAGR%) 2016-2027
Table 5.10. Global Bleeding Disorders Treatment Market for Antifibrinolytics by Geography ($m, AGR%, CAGR%) 2016-2027
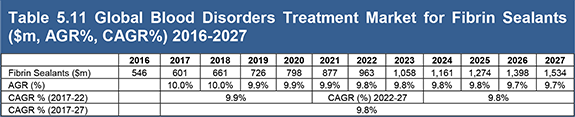
Table 5.11 Global Blood Disorders Treatment Market for Fibrin Sealants ($m, AGR%, CAGR%) 2016-2027
Table 5.12. Global Bleeding Disorders Treatment Market for Fibrin Sealants, by Geography ($m, AGR%, CAGR%) 2016-2027
Table 5.13. Global Blood Disorders Treatment Market for Others ($m, AGR%, CAGR%) 2016-2027
Table 5.14. Global Bleeding Disorders Treatment Market for Others, by Geography ($m, AGR%, CAGR%) 2016-2027
Table 6.1. Global Bleeding Disorders Treatment Market Forecast, by Geography ($m, AGR%, CAGR%) 2016-2027
Table 6.2. North America Bleeding Disorders Treatment Market Forecast, by Country ($m, AGR%, CAGR%) 2016-2027
Table 6.3. USA Bleeding Disorders Treatment Market Forecast, ($m, AGR%, CAGR%) 2016-2027
Table 6.4. Canada Bleeding Disorders Treatment Market Forecast, ($m, AGR%, CAGR%) 2016-2027
Table 6.5. Mexico Bleeding Disorders Treatment Market Forecast, ($m, AGR%, CAGR%) 2016-2027
Table 6.6. South America Bleeding Disorders Treatment Market Forecast, by Country ($m, AGR%, CAGR%) 2016-2027
Table 6.7. Brazil Bleeding Disorders Treatment Market Forecast, ($m, AGR%, CAGR%) 2016-2027
Table 6.8. Argentina Bleeding Disorders Treatment Market Forecast, ($m, AGR%, CAGR%) 2016-2027
Table 6.9. Paraguay Bleeding Disorders Treatment Market Forecast, ($m, AGR%, CAGR%) 2016-2027
Table 6.10. Bolivia Bleeding Disorders Treatment Market Forecast, ($m, AGR%, CAGR%) 2016-2027
Table 6.11. Rest of South America Bleeding Disorders Treatment Market Forecast, ($m, AGR%, CAGR%) 2016-2027
Table 6.12. European Bleeding Disorders Treatment Market Forecast, by Country ($m, AGR%, CAGR%) 2016-2027
Table 6.13. France Bleeding Disorders Treatment Market Forecast, ($m, AGR%, CAGR%) 2016-2027
Table 6.14. Germany Bleeding Disorders Treatment Market Forecast, ($m, AGR%, CAGR%) 2016-2027
Table 6.15. UK Bleeding Disorders Treatment Market Forecast, ($m, AGR%, CAGR%) 2016-2027
Table 6.16. Spain Bleeding Disorders Treatment Market Forecast, ($m, AGR%, CAGR%) 2016-2027
Table 6.17. Italy Bleeding Disorders Treatment Market Forecast, ($m, AGR%, CAGR%) 2016-2027
Table 6.18. Rest of European Bleeding Disorders Treatment Market Forecast, ($m, AGR%, CAGR%) 2016-2027
Table 6.19. Asia-Pacific Bleeding Disorders Treatment Market Forecast, by Country ($m, AGR%, CAGR%) 2016-2027
Table 6.20. China Bleeding Disorders Treatment Market Forecast, ($m, AGR%, CAGR%) 2016-2027
Table 6.21. Japan Bleeding Disorders Treatment Market Forecast, ($m, AGR%, CAGR%) 2016-2027
Table 6.22. India Bleeding Disorders Treatment Market Forecast, ($m, AGR%, CAGR%) 2016-2027
Table 6.23. Australia Bleeding Disorders Treatment Market Forecast, ($m, AGR%, CAGR%) 2016-2027
Table 6.24. Thailand Bleeding Disorders Treatment Market Forecast, ($m, AGR%, CAGR%) 2016-2027
Table 6.25. Rest of Asia-Pacific Bleeding Disorders Treatment Market Forecast, ($m, AGR%, CAGR%) 2016-2027
Table 6.26. Rest of World Bleeding Disorders Treatment Market Forecast, by Country ($m, AGR%, CAGR%) 2016-2027
Table 6.27. Middle East Bleeding Disorders Treatment Market Forecast, ($m, AGR%, CAGR%) 2016-2027
Table 6.28. Africa Bleeding Disorders Treatment Market Forecast, ($m, AGR%, CAGR%) 2016-2027
Table 6.29. Other Countries Bleeding Disorders Treatment Market Forecast, ($m, AGR%, CAGR%) 2016-2027
Table 8.1. Novo Nordisk: Financial Overview
Table 8.2. Novo Nordisk: Financial Overview
Table 8.3. Novo Nordisk: Product Portfolio
Table 8.4. Novo Nordisk: Recent Developments
Table 8.5. Bristol-Myers Squibb: Company Overview
Table 8.6. Bristol Myers Squibb: Financial Overview
Table 8.7. Bristol-Myers Squibb: Product Portfolio
Table 8.8. Pfizer Inc.: Company Overview
Table 8.9. Pfizer, Inc.: Financial Overview
Table 8.10. Pfizer Inc.: Product Portfolio
Table 8.11. Pfizer Inc.: Recent Development
Table 8.12. Bayer AG: Company Overview
Table 8.13. Bristol Myers Squibb: Financial Overview
Table 8.14. Bayer AG: Product Portfolio
Table 8.15. Bayer AG: Recent Development
Table 8.16. CSL Company Overview
Table 8.17. CSL: Financial Overview
Table 8.18. CSl: Product Portfolio
Table 8.19. CSL: Recent Development
Table 8.20. Grifols: Company Overview
Table 8.21. Grifols: Financial Overview
Table 8.22 Grifols: Product Portfolio
Table 8.23. Octapharma: Company Overview
Table 8.24. Octapharma: Financial Overview
Table 8.25 Octapharma: Product Portfolio
Table 8.26. Octapharma: Recent Development
Table 8.27. Shire: Company Overview
Table 8.28. Shire: Financial Overview
Table 8.29. Shire: Product Portfolio
Table 8.30. Shire: Recent Development
Table 8.31. Sanofi: Company Overview
Table 8.32. Sanofi: Financial Overview
Table 8.33. Sanofi: Product Portfolio
Table 8.34. Kedrion: Company Overview
Table 8.35. Kedrion: Financial Overview
Table 8.36. Kedrion: Product Portfolio
Table 8.37. Kedrion: Recent Development
Table 8.38 Other Companies for Bleeding Disorders Treatment Market
Table 9.1 Global Demographics: People suffering from haemophilia and other bleeding disorders
Abbott Laboratories
AbbVie, Inc.
Aetna, Inc.
Alkermes Plc
Amarin Corp. Plc
Amgen, Inc.
Array BioPharma, Inc.
Associates Of Cape Cod Inc.
Astex Pharmaceuticals Inc.
AstraZeneca Plc
Bayer AG
Bayer Corporation
Bayer HealthCare AG
Bayer Schering Pharma Aktiengesellschaft
BioMarin Pharmaceutical, Inc.
Biotest AG
Bristol-Myers Squibb Co.
Cardax, Inc.
Cardinal Health, Inc.
Ceapro, Inc.
Celgene Corp.
Centene Corp.
Cephalon, Inc.
Chugai Pharmaceutical Co., Ltd.
CK Life Sciences International (Holdings), Inc.
Cornerstone Research & Development Inc.
CTI BioPharma Corp.
Domain Therapeutics SA
Emd Millipore Corporation
Emd Serono Inc.
Endo International Plc
Evotec AG
GlaxoSmithKline Plc
Janssen Biotech, Inc.
JHL Biotech, Inc.
Johnson & Johnson
Laboratoire Theramex
Lonza Group AG
McKesson Corp.
Merck KGaA
MorphoSys AG
Motif Bio Plc
Myrexis, Inc.
NBTY, Inc.
Neptune Technologies & Bioresources, Inc.
Nexvet Biopharma PLC
Nordion Inc
Novartis AG
Opexa Therapeutics, Inc.
Otsuka Pharmaceutical Co. Ltd.
Owens & Minor, Inc.
Panacos Pharmaceuticals, Inc.
Pfizer Inc.
Pharma Mar SA
Premier Healthcare Alliance L.P.
Quanterix Corp.
Samsung BioLogics Co., Ltd.
Sangers (Northern Ireland) Limited
Sanofi
Spectrum Pharmaceuticals, Inc.
Taiho Pharmaceutical Co. Ltd.
Takeda Pharmaceutical Co., Ltd.
UnitedHealth Group, Inc.
Verastem, Inc.
Vertex Pharmaceuticals, Inc.
Windtree Therapeutics, Inc.
Zogenix, Inc.
Organizations Mentioned in the Report
American College of Nutrition
Australian Institute of Health and Welfare
European Medicines Agency
Health Canada
International Medical Corps
National Cancer Institute
National Health Service
The American Society of Clinical Oncology Inc
The Feinstein Institute for Medical Research
The National Institute for Health and Clinical Excellence
United States Department of Health & Human Services
World Health Organization


