Bio-MEMS and Microfluidics – our new study reveals trends, R&D progress, and predicted revenues
Where is the Bio-MEMS and Microfluidics market heading? If you are involved in this sector you must read this brand new report. Visiongain’s report shows you the potential revenues streams to 2027, assessing data, trends, opportunities and business prospects there.
Discover how to stay ahead
Our 206-page report provides 204 tables, charts, and graphs. Read on to discover the most lucrative areas in the industry and the future market prospects. Our new study lets you assess forecasted sales at overall world market and regional level. See financial results, trends, opportunities, and revenue predictions. Much opportunity remains in this growing market. See how to exploit the opportunities.
Forecasts to 2027 and other analyses reveal the commercial prospects
• In addition to revenue forecasting to 2027, our new study provides you with recent results, growth rates, and market shares.
• You find original analyses, with business outlooks and developments.
• Discover qualitative analyses (including market dynamics, drivers, opportunities, restraints and challenges), product profiles and commercial developments.
Discover sales predictions for the world market and submarkets
Along with revenue prediction for the overall world market, there are forecasts for 13 Product Types, 3 Applications and 3 End Users.
Global Bio-MEMS & Microfluidics Market segments, by Type
• Implantable Bio-MEMS
• Biosensors:
• Gyroscopes
• Stents
• Drug Delivery Devices
• Biochips
• Accelerometers
• Injectable Bio-MEMS:
• Microneedles
• Micromodules
• Other Devices:
• Inhalers
• Catheters
• Micro motors
Global Bio-MEMS & Microfluidics Market segments, by Application
• Diagnostics
• Therapeutics
• Tissue Engineering
• Others
Global Bio-MEMS & Microfluidics Market segments, by End-User
• Pharmaceutical Industry
• Hospitals
• Research Centres
• Others
In addition to the revenue predictions for the overall world market and segments, you will also find revenue forecasts for 7 Regional & 17 leading national markets:
• North America:
• The US
• Mexico
• Canada
• South America:
• Brazil
• Argentina
• Paraguay
• Bolivia
• Rest of South America
• Europe:
• Germany
• France
• The UK
• Italy
• Spain
• Rest of Europe
• Asia-Pacific:
• Japan
• China
• India
• Australia
• Thailand
• Rest of Asia-Pacific
• Rest of the World:
• Middle East
• Africa
• Other Countries
The report also includes profiles and forecasts for some of the leading companies in the Bio-MEMS and Microfluidics market, with a focus on these segments of the companies’ operations.
There will be growth in both established and in developing countries. Our analyses show that the developing markets, China and India in particular, will continue to achieve high revenue growth to 2027. Developments worldwide in medical device regulation, especially in the US and Japan will influence the market.
Leading companies and the potential for market growth
Overall world revenue for Bio-MEMS and Microfluidics will surpass $2.8bn in 2017, our work calculates. We predict strong revenue growth through to 2027. The increasing prevalence of neurological conditions, increase in diagnostic procedures in emerging economies and increasing ageing population will increase sales to 2027.
Our work identifies which organisations hold the greatest potential. Discover their capabilities, progress, and commercial prospects, helping you stay ahead.
How the Bio-MEMS and Microfluidics Market report helps you
In summary, our 206-page report provides you with the following knowledge:
• Revenue forecasts to 2027 for the world Bio-MEMS and Microfluidics market and 2 different segmentations, with 13 product categories, 3 applications and 3 end users – discover the industry’s prospects, finding the most lucrative places for investments and revenues
• Revenue forecasts to 2027 for 17 of the leading national markets – US, Mexico, Canada, Brazil, Argentina, Paraguay, Bolivia, Germany, UK, France, Italy, Spain, Japan, China, India, Australia, Thailand
• Discussion of what stimulates and restrains companies and the market
• Prospects for established firms and those seeking to enter the market
Find quantitative and qualitative analyses with independent predictions. Receive information that only our report contains, staying informed with this invaluable business intelligence.
Information found nowhere else
With our survey you are less likely to fall behind in knowledge or miss opportunity. See how you could benefit your research, analyses, and decisions. Also see how you can save time and receive recognition for commercial insight.
Visiongain’s study is for everybody needing commercial analyses for the Bio-MEMS and Microfluidics market and leading companies. You find data, trends and predictions.
Get our report today World Bio-MEMS & Microfluidics Market Forecasts 2017-2027 Revenue Prospects by Type (Implantable, Biosensors, Stents, Drug Delivery, Biochips, Accelerometers, Injectable, Microneedles, Micromodules, Inhalers, Catheters, Micro Motors), Application (Diagnostic, Therapeutic, Tissue Engineering), End-User (Pharmaceutical Industry, Hospitals, Research Centres) and Geography. Avoid missing out – get our report now.
Visiongain is a trading partner with the US Federal Government
CCR Ref number: KD4R6
1 Report Overview
1.1 Global Bio-MEMS & Microfluidics Overview
1.2 Research Methodology
1.2.1 Primary Research
1.2.2 Secondary Research
1.3 Market Evaluation & Forecasting Methodology
1.4 Global Bio-MEMS & Microfluidics Market Segmentation
1.5 Overview of Findings
1.6 Why You Should Read This Report
1.7 How this report delivers?
1.8 Key Questions Answered by This Analytical Report
1.9 Frequently Asked Questions (FAQ)
1.10 Who is This Report For?
1.11 Associated Visiongain Reports
1.12 About Visiongain
2 Introduction to Bio-MEMS & Microfluidics
2.1 Applications of Bio-MEMS & Microfluidics
2.1.1 Therapeutics
2.1.2 Diagnostics
2.1.3 Tissue Engineering
3 Global Bio-MEMS & Microfluidics Market Forecast to 2027
4 Global Bio-MEMS & Microfluidics Market by Type: Market Forecast to 2027
4.1 Overview
4.2 Implantable Bio-MEMS & Microfluidics
4.2.1 Biosensors
4.2.2 Gyroscopes
4.2.3 Stents
4.2.4 Drug Delivery Devices
4.2.5 Biochips
4.2.6 Accelerometers
4.3 Injectable Bio-MEMS & Microfluidics
4.3.1 Microneedles
4.3.2 Micromodules
4.4 Others Devices Bio-MEMS & Microfluidics
4.4.1 Inhalers
4.4.2 Catheters
4.4.3 Micro motors
5 Global Bio-MEMS & Microfluidics Market by Application: Market Forecast to 2027
5.1 Overview
5.2 Diagnostic
5.3 Therapeutics
5.4 Tissue Engineering
5.5 Others
6 Global Bio-MEMS & Microfluidics Market by End-User: Market Forecast to 2027
6.1 Overview
6.2 Pharmaceutical Industry
6.3 Hospitals
6.4 Research Centres
6.5 Other Applications
7 Regional Bio-MEMS & Microfluidics Market Forecasts to 2027
7.1 Regional Bio-MEMS & Microfluidics Market Forecast 2017-2027
7.2 North American Bio-MEMS & Microfluidics Market Forecast 2017-2027
7.2.1 USA Bio-MEMS & Microfluidics Market Forecast 2017-2027
7.2.2 Canada Bio-MEMS & Microfluidics Market Forecast 2017-2027
7.2.3 Mexico Bio-MEMS & Microfluidics Market Forecast 2017-2027
7.3 South American Bio-MEMS & Microfluidics Market Forecast 2017-2027
7.3.1 Brazil Bio-MEMS & Microfluidics Market Forecast 2017-2027
7.3.2 Argentina Bio-MEMS & Microfluidics Market Forecast 2017-2027
7.3.3 Paraguay Bio-MEMS & Microfluidics Market Forecast 2017-2027
7.3.4 Bolivia Bio-MEMS & Microfluidics Market Forecast 2017-2027
7.3.5 Rest of South America Bio-MEMS & Microfluidics Market Forecast 2016-2027
7.4 European Bio-MEMS & Microfluidics Market Forecast 2017-2027
7.4.1 France Bio-MEMS & Microfluidics Market Forecast 2017-2027
7.4.2 Germany Bio-MEMS & Microfluidics Market Forecast 2016-2027
7.4.3 UK Bio-MEMS & Microfluidics Market Forecast 2017-2027
7.4.4 Spain Bio-MEMS & Microfluidics Market Forecast 2017-2027
7.4.5 Italy Bio-MEMS & Microfluidics Market Forecast 2017-2027
7.4.6 Rest of Europe Bio-MEMS & Microfluidics Market Forecast 2017-2027
7.5 Asia-Pacific Bio-MEMS & Microfluidics Market Forecast 2017-2027
7.5.1 China Bio-MEMS & Microfluidics Market Forecast 2017-2027
7.5.2 Japan Bio-MEMS & Microfluidics Market Forecast 2017-2027
7.5.3 India Bio-MEMS & Microfluidics Market Forecast 2017-2027
7.5.4 Australia Bio-MEMS & Microfluidics Market Forecast 2017-2027
7.5.5 Thailand Bio-MEMS & Microfluidics Market Forecast 2017-2027
7.5.6 Rest of Asia-Pacific Bio-MEMS & Microfluidics Market Forecast 2017-2027
7.6 Rest of World Bio-MEMS & Microfluidics Market Forecast 2017-2027
7.6.1 Middle East Bio-MEMS & Microfluidics Market Forecast 2017-2027
7.6.2 Africa Bio-MEMS & Microfluidics Market Forecast 2017-2027
7.6.3 Other Countries Bio-MEMS & Microfluidics Market Forecast 2017-2027
8. Bio-MEMS & Microfluidics Market, Qualitative Analysis, 2017-2027
8.1 Porter’s Five Forces Analysis
8.1.1 Bargaining Power of Buyers (High)
8.1.2 Bargaining Power of Suppliers (Medium)
8.1.3 Threat of New Entrants (Medium)
8.1.4 Threat of Substitute Products (High)
8.1.5 Intensity of Competitive Rivalry (High)
8.2 Drivers & Restrains
8.2.1 Application of Bio-MEMS in drug delivery
8.2.2 Increase in geriatric population and surge in incidence and prevalence of chronic diseases
8.2.3 Increase in government expenditure in the healthcare sector
8.2.4 Complex regulatory framework
8.2.5 Lucrative opportunities from emerging economies
9 Leading Companies in Bio-MEMS & Microfluidics Market
9.1 Abbott Diagnostics (A Business Division Abbott Laboratories Inc.)
9.1.1 Abbott Diagnostics: Company Overview
9.1.2 Abbott Diagnostics: Product Portfolio
9.1.3 Abbott Diagnostics: Recent Developments
9.2 Nova Biomedical
9.2.1 Nova Biomedical: Company Overview
9.2.2 Nova Biomedical: Product Portfolio
9.2.3 Nova Biomedical: Recent Developments
9.3 Danaher Corporation (Pall ForteBio)
9.3.1 Danaher Corporation: Company Overview
9.3.2 Danaher Corporation: Product Portfolio
9.3.3 Danaher Corporation: Recent Developments
9.4 Thermo Fisher Scientific Inc. (Affymetrix)
9.4.1 Thermo Fisher Scientific Inc.: Company Overview
9.4.2 Thermo Fisher Scientific Inc.: Product Portfolio
9.4.3 Thermo Fisher Scientific Inc.: Recent Developments
9.5 Fraunhofer-IMS
9.5.1 Fraunhofer-IMS: Company Overview
9.5.2 Fraunhofer-IMS: Product Portfolio
9.6 Medtronic PLC
9.6.1 Medtronic PLC: Company Overview
9.6.2 Medtronic PLC: Product Portfolio
9.6.3 Medtronic PLC: Recent Developments
9.7 Boston Scientific Corporation
9.7.1 Boston Scientific Corporation: Company Overview
9.7.2 Boston Scientific Corporation: Product Portfolio
9.7.3 Boston Scientific Corporation: Recent Developments
9.8 F. HOFFMANN-LA ROCHE AG
9.8.1 F. Hoffmann-La Roche: Company Overview
9.8.2 F. Hoffmann-La Roche: Product Portfolio
9.8.3 F. Hoffmann-La Roche: Recent Developments
9.9 Johnson & Johnson
9.9.1 Johnson & Johnson: Company Overview
9.9.2 Johnson & Johnson: Product Portfolio
9.9.3 Johnson & Johnson: Recent Developments
9.10 Becton, Dickinson and Company
9.10.1 Becton, Dickinson and Company: Company Overview
9.10.2 Becton, Dickinson and Company: Product Portfolio
9.10.3 Becton, Dickinson and Company: Recent Developments
10 Conclusions
10.1 Current Leading Segments
10.2 Leading Regional Markets
10.3 Emerging Markets
10.4 The Future of the Market?
Visiongain Report Sales Order Form
Appendix A
About Visiongain
Appendix B
Visiongain report evaluation form
List of Figures
Figure 3.1. Global Bio-MEMS & Microfluidics Market, by Type, ($bn), 2017-2027
Figure 3.2. Global Bio-MEMS & Microfluidics Market, by Application, ($bn), 2017-2027
Figure 3.3. Global Bio-MEMS & Microfluidics Market, by End-User, ($bn), 2017-2027
Figure 4.1. Global Bio-MEMS & Microfluidics Market, by Type, Market Share (%), 2016
Figure 4.2. Global Bio-MEMS & Microfluidics Market, by Type, Forecast ($bn) 2017-2027
Figure 4.3. Global Implantable Market for Bio-MEMS & Microfluidics Market Forecast, by Geography, ($bn) 2017-2027
Figure 4.4. Global Implantable Bio-MEMS & Microfluidics Market, by Type ($bn, AGR%, CAGR%) 2017-2027
Figure 4.5. Global Bio-MEMS & Microfluidics Market for Implantable, by Type, Market Share (%), 2016
Figure 4.6. Global Implantable Bio-MEMS & Microfluidics Market for Biosensors, ($bn, AGR%, CAGR%) 2017-2027
Figure 4.7. Global Implantable Bio-MEMS & Microfluidics Market for Gyroscopes, ($bn, AGR%, CAGR%) 2017-2027
Figure 4.8. Global Implantable Bio-MEMS & Microfluidics Market for Stents, by Type, ($bn, AGR%, CAGR%) 2017-2027
Figure 4.9. Global Implantable Bio-MEMS & Microfluidics Market for Drug Delivery Devices, ($bn, AGR%, CAGR%) 2017-2027
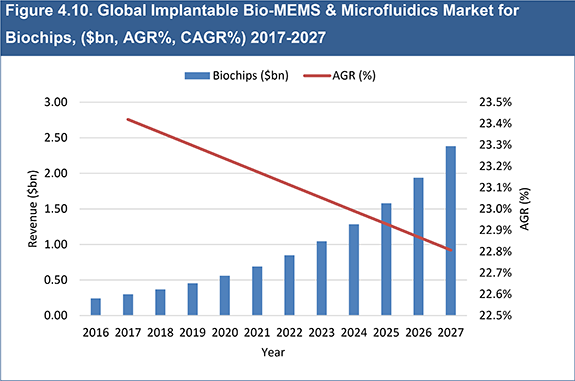
Figure 4.10. Global Implantable Bio-MEMS & Microfluidics Market for Biochips, ($bn, AGR%, CAGR%) 2017-2027
Figure 4.11. Global Implantable Bio-MEMS & Microfluidics Market for Accelerometers, ($bn, AGR%, CAGR%) 2017-2027
Figure 4.12. Global Injectable Market for Bio-MEMS & Microfluidics Market Forecast, by Geography, ($bn) 2017-2027
Figure 4.13. Global Injectable Bio-MEMS & Microfluidics Market, by Type ($bn, AGR%, CAGR%) 2017-2027
Figure 4.14. Global Bio-MEMS & Microfluidics Market for Injectable, by Type, Market Share (%), 2016
Figure 4.15. Global Injectable Bio-MEMS & Microfluidics Market for Microneedles, ($bn, AGR%, CAGR%) 2017-2027
Figure 4.16. Global Injectable Bio-MEMS & Microfluidics Market for Micromodules, ($bn, AGR%, CAGR%) 2017-2027
Figure 4.17. Global Other Devices Market for Bio-MEMS & Microfluidics Market Forecast, by Geography, ($bn) 2017-2027
Figure 4.18. Global Others Devices Bio-MEMS & Microfluidics Market, by Type ($bn, AGR%, CAGR%) 2017-2027
Figure 4.19. Global Bio-MEMS & Microfluidics Market for Others Devices, by Type, Market Share (%), 2016
Figure 4.20. Global Other Devices Bio-MEMS & Microfluidics Market for Inhalers, ($bn, AGR%, CAGR%) 2017-2027
Figure 4.21. Global Other Devices Bio-MEMS & Microfluidics Market for Catheters, ($bn, AGR%, CAGR%) 2017-2027
Figure 4.22. Global Other Devices Bio-MEMS & Microfluidics Market for Micro Motors, ($bn, AGR%, CAGR%) 2017-2027
Figure 5.1. Global Bio-MEMS & Microfluidics Market, by Application, Market Share (%), 2016
Figure 5.2. Global Bio-MEMS & Microfluidics Market, by Application, Forecast ($bn) 2017-2027
Figure 5.3. Global Bio-MEMS & Microfluidics Market for Diagnostic Forecast, by Geography, ($bn) 2017-2027
Figure 5.4. Global Bio-MEMS & Microfluidics Market for Therapeutics Forecast, by Geography, ($bn) 2017-2027
Figure 5.5. Global Bio-MEMS & Microfluidics Market for Tissue Engineering Forecast, by Geography, ($bn) 2017-2027
Figure 5.6. Global Bio-MEMS & Microfluidics Market for Others Applications Forecast, by Geography, ($bn) 2017-2027
Figure 6.1. Global Bio-MEMS & Microfluidics Market, by End-User, Market Share (%), 2016
Figure 6.2. Global Bio-MEMS & Microfluidics Market, by End-User, Forecast ($bn) 2017-2027
Figure 6.3. Global Bio-MEMS & Microfluidics Market for Pharmaceuticals Forecast, by Geography, ($bn) 2017-2027
Figure 6.4. Global Bio-MEMS & Microfluidics Market for Hospitals Forecast, by Geography, ($bn) 2017-2027
Figure 6.5. Global Bio-MEMS & Microfluidics Market for Research Centres Forecast, by Geography, ($bn) 2017-2027
Figure 6.6. Global Bio-MEMS & Microfluidics Market for Others Applications Forecast, by Geography, ($bn) 2017-2027
Figure 7.1. Global Bio-MEMS & Microfluidics Market, by Geography, ($bn) 2017-2027
Figure 7.2. Global Bio-MEMS & Microfluidics Market Forecast, by Geography, Market Share (%), 2016
Figure 7.3. North America Bio-MEMS & Microfluidics Market Forecast, by Country($bn) 2017-2027
Figure 7.4. North America Bio-MEMS & Microfluidics Market, by Country, Market Share (%), 2016
Figure 7.5. USA Bio-MEMS & Microfluidics Market Forecast ($bn) 2017-2027
Figure 7.6. Canada Bio-MEMS & Microfluidics Market Forecast ($bn) 2017-2027
Figure 7.7 Mexico Bio-MEMS & Microfluidics Market Forecast ($bn) 2017-2027
Figure 7.8 South America Bio-MEMS & Microfluidics Market Forecast, by Country($bn) 2017-2027
Figure 7.9. South America Bio-MEMS & Microfluidics Market, by Country, Market Share (%), 2016
Figure 7.10. Brazil Bio-MEMS & Microfluidics Market Forecast ($bn) 2017-2027
Figure 7.11. Argentina Bio-MEMS & Microfluidics Market Forecast ($bn) 2017-2027
Figure 7.12. Paraguay Bio-MEMS & Microfluidics Market Forecast ($bn) 2017-2027
Figure 7.13. Bolivia Bio-MEMS & Microfluidics Market Forecast ($bn) 2017-2027
Figure 7.14. Rest of South America Bio-MEMS & Microfluidics Market Forecast ($bn) 2017-2027
Figure 7.15. Europe Bio-MEMS & Microfluidics Market Forecast, by Country($bn) 2017-2027
Figure 7.16. Europe Bio-MEMS & Microfluidics Market, by Country, Market Share (%), 2016
Figure 7.17. France Bio-MEMS & Microfluidics Market Forecast ($bn) 2017-2027
Figure 7.18. Germany Bio-MEMS & Microfluidics Market Forecast ($bn) 2017-2027
Figure 7.19. UK Bio-MEMS & Microfluidics Market Forecast ($bn) 2017-2027
Figure 7.20. Spain Bio-MEMS & Microfluidics Market Forecast ($bn) 2017-2027
Figure 7.21. Italy Bio-MEMS & Microfluidics Market Forecast ($bn) 2017-2027
Figure 7.22. Rest of Europe Bio-MEMS & Microfluidics Market Forecast ($bn) 2017-2027
Figure 7.23. Asia-Pacific Bio-MEMS & Microfluidics Market Forecast, by Country ($bn) 2017-2027
Figure 7.24. Asia-Pacific Bio-MEMS & Microfluidics Market, Market Share (%), 2016
Figure 7.25. China Bio-MEMS & Microfluidics Market Forecast ($bn) 2017-2027
Figure 7.26. Japan Bio-MEMS & Microfluidics Market Forecast ($bn) 2017-2027
Figure 7.27. India Bio-MEMS & Microfluidics Market Forecast ($bn) 2017-2027
Figure 7.28. Australia Bio-MEMS & Microfluidics Market Forecast ($bn) 2017-2027
Figure 7.29. Thailand Bio-MEMS & Microfluidics Market Forecast ($bn) 2017-2027
Figure 7.30. Rest of Asia-Pacific Bio-MEMS & Microfluidics Market Forecast ($bn) 2017-2027
Figure 7.31. RoW Bio-MEMS & Microfluidics Market, by Country($bn) 2017-2027
Figure 7.32. Rest of World Bio-MEMS & Microfluidics Market, by Country, Market Share (%), 2016
Figure 7.33. Middle East Bio-MEMS & Microfluidics Market Forecast ($bn) 2017-2027
Figure 7.34. Africa Bio-MEMS & Microfluidics Market Forecast ($bn) 2017-2027
Figure 7.35. Other Countries Bio-MEMS & Microfluidics Market Forecast ($bn) 2017-2027
Figure 8.1 Porter’s Five Forces Analysis of the Bio-MEMS & Microfluidics Market
Figure 8.2 Incidence Rate of Chronic Diseases
Figure 8.3 USA Healthcare Expenditure per Person
Figure 8.4 Rising GDP of Countries
Figure 9.1 Abbott Diagnostics , Revenue, ($million), 2012-2016
Figure 9.2 Abbott Diagnostics (Segment) , Revenue, ($million), 2012-2016
Figure 9.3 Abbott Diagnostics, Product Segments Share (%), 2016
Figure 9.4 Abbott Diagnostics, Geographic Presence Share (%), 2016
Figure 9.5 Danaher Corporation, Revenue, ($million), 2012-2016
Figure 9.6 Danaher Corporation, Product Segments Share (%), 2016
Figure 9.7 Danaher Corporation, Geographical Presence Share (%), 2016
Figure 9.8 Thermo Fisher Scientific Inc., Revenue, ($million), 2012-2016
Figure 9.9 Thermo Fisher Scientific Inc., Product Segments Share (%), 2016
Figure 9.10 Thermo Fisher Scientific Inc., Geographical Presence Share (%), 2016
Figure 9.11 Medtronic PLC, Revenue, ($million), 2012-2016
Figure 9.12 Medtronic PLC, Product Segments Share (%), 2016
Figure 9.13 Medtronic PLC, Geographical Presence Share (%), 2016
Figure 9.14 Boston Scientific Corporation, Revenue, ($million), 2012-2016
Figure 9.15 Boston Scientific Corporation, Product Segments Share (%), 2016
Figure 9.16 Boston Scientific Corporation, Geographical Presence Share (%), 2016
Figure 9.17 F. Hoffmann-La Roche, Revenue, ($million), 2012-2016
Figure 9.18 F. Hoffmann-La Roche, Product Segments Share (%), 2016
Figure 9.19 F. Hoffmann-La Roche, Geographical Presence Share (%), 2016
Figure 9.20 Johnson & Johnson, Revenue, ($million), 2012-2016
Figure 9.21 Johnson & Johnson, Product Segments Share (%), 2016
Figure 9.22 Johnson & Johnson, Geographical Presence Share (%), 2016
Figure 9.23 Becton, Dickinson and Company, Revenue, ($million), 2012-2016
Figure 9.24 Becton, Dickinson and Company, Product Segments Share (%), 2016
Figure 9.25 Becton, Dickinson and Company, Geographical Presence Share (%), 2016
Figure 10.1 Global Bio-MEMS & Microfluidics Market, by Type, ($bn), 2017-2027
Figure 10.2 Global Bio-MEMS & Microfluidics Market, by Application, ($bn), 2017-2027
Figure 10.3 Global Bio-MEMS & Microfluidics Market, by End-User, ($bn), 2017-2027
Figure 10.4 Global Bio-MEMS & Microfluidics Market, by Geography, ($bn), 2017-2027
List of Tables
Table 3.1. Global Bio-MEMS & Microfluidics Forecast ($bn, AGR%, CAGR%) 2017-2027
Table 4.1. Global Bio-MEMS & Microfluidics Market Forecast, by Type ($bn, AGR%, CAGR%) 2017-2027
Table 4.2. Global Implantable Bio-MEMS & Microfluidics Market Forecast ($bn, AGR%, CAGR%) 2017-2027
Table 4.3. Global Implantable Bio-MEMS & Microfluidics Market Forecast, by Geography, ($bn, AGR%, CAGR%) 2017-2027
Table 4.4. Global Implantable Bio-MEMS & Microfluidics Market, by Type ($bn, AGR%, CAGR%) 2017-2027
Table 4.5. Global Implantable Bio-MEMS & Microfluidics Market for Biosensors, ($bn, AGR%, CAGR%) 2017-2027
Table 4.6. Global Implantable Bio-MEMS & Microfluidics Market for Gyroscopes, ($bn, AGR%, CAGR%) 2017-2027
Table 4.7. Global Implantable Bio-MEMS & Microfluidics Market for Stents, ($bn, AGR%, CAGR%) 2017-2027
Table 4.8. Global Implantable Bio-MEMS & Microfluidics Market for Drug Delivery Devices, ($bn, AGR%, CAGR%) 2017-2027
Table 4.9. Global Implantable Bio-MEMS & Microfluidics Market for biochips, ($bn, AGR%, CAGR%) 2017-2027
Table 4.10. Global Implantable Bio-MEMS & Microfluidics Market for Accelerometers, ($bn, AGR%, CAGR%) 2017-2027
Table 4.11. Global Injectable Bio-MEMS & Microfluidics Market Forecast, ($bn, AGR%, CAGR%) 2017-2027
Table 4.12. Global Injectable Bio-MEMS & Microfluidics Market Forecast, by Geography, ($bn, AGR%, CAGR%) 2017-2027
Table 4.13. Global Injectable Bio-MEMS & Microfluidics Market, by Type ($bn, AGR%, CAGR%) 2017-2027
Table 4.14. Global Injectable Bio-MEMS & Microfluidics Market for Microneedles, ($bn, AGR%, CAGR%) 2017-2027
Table 4.15. Global Injectable Bio-MEMS & Microfluidics Market for Micromodules, ($bn, AGR%, CAGR%) 2017-2027
Table 4.16. Global Other Bio-MEMS & Microfluidics Devices Market Forecast, ($bn, AGR%, CAGR%) 2017-2027
Table 4.17. Global Others Devices Bio-MEMS & Microfluidics Market Forecast, by Geography, ($bn, AGR%, CAGR%) 2017-2027
Table 4.18. Global Others Devices Bio-MEMS & Microfluidics Market, by Type ($bn, AGR%, CAGR%) 2017-2027
Table 4.19. Global Other Devices Bio-MEMS & Microfluidics Market for Inhalers, ($bn, AGR%, CAGR%) 2017-2027
Table 4.20. Global Other Devices Bio-MEMS & Microfluidics Market for Catheters, ($bn, AGR%, CAGR%) 2017-2027
Table 4.21. Global Other Devices Bio-MEMS & Microfluidics Market for Micro Motors, ($bn, AGR%, CAGR%) 2017-2027
Table 5.1. Global Bio-MEMS & Microfluidics Market Forecast, by Application ($bn, AGR%, CAGR%) 2017-2027
Table 5.2. Global Bio-MEMS & Microfluidics Market for Diagnostic Forecast, by Application, ($bn, AGR%, CAGR%) 2017-2027
Table 5.3. Global Bio-MEMS & Microfluidics Market for Diagnostic Forecast, by Geography, ($bn, AGR%, CAGR%) 2017-2027
Table 5.4. Global Bio-MEMS & Microfluidics Market for Therapeutics Forecast, by Application, ($bn, AGR%, CAGR%) 2017-2027
Table 5.5. Global Bio-MEMS & Microfluidics Market for Therapeutics Forecast, by Geography, ($bn, AGR%, CAGR%) 2017-2027
Table 5.6. Global Bio-MEMS & Microfluidics Market for Tissue Engineering Forecast, by Application, ($bn, AGR%, CAGR%) 2017-2027
Table 5.7. Global Bio-MEMS & Microfluidics Market for Tissue Engineering Forecast, by Geography, ($bn, AGR%, CAGR%) 2017-2027
Table 5.8. Global Bio-MEMS & Microfluidics Market for Others Applications Forecast, by Application, ($bn, AGR%, CAGR%) 2017-2027
Table 5.9. Global Bio-MEMS & Microfluidics Market for Others Applications Forecast, by Geography, ($bn, AGR%, CAGR%) 2017-2027
Table 6.1. Global Bio-MEMS & Microfluidics Market Forecast, by End-User ($bn, AGR%, CAGR%) 2017-2027
Table 6.2. Global Bio-MEMS & Microfluidics Market for Pharmaceuticals Forecast, by End-User, ($bn, AGR%, CAGR%) 2017-2027
Table 6.3. Global Bio-MEMS & Microfluidics Market for Pharmaceuticals Forecast, by Geography, ($bn, AGR%, CAGR%) 2017-2027
Table 6.4. Global Bio-MEMS & Microfluidics Market for Hospitals Forecast, by End-User, ($bn, AGR%, CAGR%) 2017-2027
Table 6.5. Global Bio-MEMS & Microfluidics Market for Hospitals Forecast, by Geography, ($bn, AGR%, CAGR%) 2017-2027
Table 6.6. Global Bio-MEMS & Microfluidics Market for Research Centres Forecast, by End-User, ($bn, AGR%, CAGR%) 2017-2027
Table 6.7. Global Bio-MEMS & Microfluidics Market for Research Centres Forecast, by Geography, ($bn, AGR%, CAGR%) 2017-2027
Table 6.8. Global Bio-MEMS & Microfluidics Market for Others Applications Forecast, by End-User, ($bn, AGR%, CAGR%) 2017-2027
Table 6.9. Global Bio-MEMS & Microfluidics Market for Others Applications Forecast, by Geography, ($bn, AGR%, CAGR%) 2017-2027
Table 7.1. Global Bio-MEMS & Microfluidics Market, by Geography ($bn, AGR%, CAGR%) 2017-2027
Table 7.2. North America Bio-MEMS & Microfluidics Market Forecast, by Country ($bn, AGR%, CAGR%) 2017-2027
Table 7.3. USA Bio-MEMS & Microfluidics Market Forecast, ($bn, AGR%, CAGR%) 2017-2027
Table 7.4. Canada Bio-MEMS & Microfluidics Market Forecast, ($bn, AGR%, CAGR%) 2017-2027
Table 7.5. Mexico Bio-MEMS & Microfluidics Market Forecast, ($bn, AGR%, CAGR%) 2017-2027
Table 7.6. South America Bio-MEMS & Microfluidics Market Forecast, by Country ($bn, AGR%, CAGR%) 2017-2027
Table 7.7. Brazil Bio-MEMS & Microfluidics Market Forecast, ($bn, AGR%, CAGR%) 2017-2027
Table 7.8. Argentina Bio-MEMS & Microfluidics Market Forecast, ($bn, AGR%, CAGR%) 2016-2027
Table 7.9. Paraguay Bio-MEMS & Microfluidics Market Forecast, ($bn, AGR%, CAGR%) 2017-2027
Table 7.10. Bolivia Bio-MEMS & Microfluidics Market Forecast, ($bn, AGR%, CAGR%) 2017-2027
Table 7.11. Rest of South America Bio-MEMS & Microfluidics Market Forecast, ($bn, AGR%, CAGR%) 2017-2027
Table 7.12. European Bio-MEMS & Microfluidics Market Forecast, by Country ($bn, AGR%, CAGR%) 2017-2027
Table 7.13. France Bio-MEMS & Microfluidics Market Forecast, ($bn, AGR%, CAGR%) 2017-2027
Table 7.14. Germany Bio-MEMS & Microfluidics Market Forecast, ($bn, AGR%, CAGR%) 2017-2027
Table 7.15. UK Bio-MEMS & Microfluidics Market Forecast, ($bn, AGR%, CAGR%) 2017-2027
Table 7.16. Spain Bio-MEMS & Microfluidics Market Forecast, ($bn, AGR%, CAGR%) 2017-2027
Table 7.17. Italy Bio-MEMS & Microfluidics Market Forecast, ($bn, AGR%, CAGR%) 2017-2027
Table 7.18. Rest of European Bio-MEMS & Microfluidics Market Forecast, ($bn, AGR%, CAGR%) 2017-2027
Table 7.19. Asia-Pacific Bio-MEMS & Microfluidics Market Forecast, by Country ($bn, AGR%, CAGR%) 2017-2027
Table 7.20. China Bio-MEMS & Microfluidics Market Forecast, ($bn, AGR%, CAGR%) 2017-2027
Table 7.21. Japan Bio-MEMS & Microfluidics Market Forecast, ($bn, AGR%, CAGR%) 2017-2027
Table 7.22. India Bio-MEMS & Microfluidics Market Forecast, ($bn, AGR%, CAGR%) 2017-2027
Table 7.23. Australia Bio-MEMS & Microfluidics Market Forecast, ($bn, AGR%, CAGR%) 2017-2027
Table 7.24. Thailand Bio-MEMS & Microfluidics Market Forecast, ($bn, AGR%, CAGR%) 2017-2027
Table 7.25. Rest of Asia-Pacific Bio-MEMS & Microfluidics Market Forecast, ($bn, AGR%, CAGR%) 2017-2027
Table 7.26. Rest of World Bio-MEMS & Microfluidics Market Forecast, by Country ($bn, AGR%, CAGR%) 2017-2027
Table 7.27. Middle East Bio-MEMS & Microfluidics Market Forecast, ($bn, AGR%, CAGR%) 2017-2027
Table 7.28. Africa Bio-MEMS & Microfluidics Market Forecast, ($bn, AGR%, CAGR%) 2017-2027
Table 7.29. Other Countries Bio-MEMS & Microfluidics Market Forecast, ($bn, AGR%, CAGR%) 2017-2027
Table 8.1 Global Incidence Rate of Diseases
Table 9.1 Abbott Diagnostics: Company Overview
Table 9.2 Abbott Diagnostics: Product Portfolio
Table 9.3 Abbott Diagnostics: Recent Developments
Table 9.4 Nova Biomedical: Company Overview
Table 9.5 Nova Biomedical: Product Portfolio
Table 9.6 Nova Biomedical: Recent Developments
Table 9.7 Danaher Corporation: Company Overview
Table 9.8 Danaher Corporation: Product Portfolio
Table 9.9 Danaher Corporation: Recent Developments
Table 9.10 Thermo Fisher Scientific Inc.: Company Overview
Table 9.11 Thermo Fisher Scientific Inc.: Product Portfolio
Table 9.12 Thermo Fisher Scientific Inc.: Recent Developments
Table 9.13 Fraunhofer-IMS: Company Overview
Table 9.14 Fraunhofer-IMS: Product Portfolio
Table 9.15 Medtronic PLC: Company Overview
Table 9.16 Medtronic PLC.: Product Portfolio
Table 9.17 Medtronic PLC: Recent Developments
Table 9.18 Boston Scientific Corporation: Company Overview
Table 9.19 Boston Scientific Corporation: Product Portfolio
Table 9.20 Boston Scientific Corporation: Recent Developments
Table 9.21 F. Hoffmann-La Roche : Company Overview
Table 9.22 F. Hoffmann-La Roche : Product Portfolio
Table 9.23 F. Hoffmann-La Roche : Recent Developments
Table 9.24 Johnson & Johnson: Company Overview
Table 9.25 Johnson & Johnson: Product Portfolio
Table 9.26 Johnson & Johnson: Recent Developments
Table 9.27 Becton, Dickinson and Company: Company Overview
Table 9.28 Becton, Dickinson and Company: Product Portfolio
Table 9.29 Becton, Dickinson and Company: Recent Developments


