The Well Intervention Market 2022-2032: the report aims to provide exhaustive details about the well intervention market. The report will provide vital information to the existing companies as to how to generate more new pockets and generate revenues in less captured markets. For the new entrants in the market report will shed light on market dynamics and factors for market growth along with market restraints.
Increasing Demand for Oil & Gas in Asia Pacific Region
Asia Pacific is expected to be the largest consumer of oil & gas in the years to come. The regional market is witnessing rapid growth in the demand for oil & gas in past years due to the growing population, increase per capita income, urbanization, and growth in the number of petrochemical refineries. The region accounted on an average for about two-third of global oil & gas demand between 2011 and 2019. China and India are the leading Oil & gas consumers in the region, as the economies of these nations are expanding aggressively.
China and India accounted for about xx% of the global oil & gas consumption in 2021. However, China and India contributed only x% and x% respectively, to the global production of oil & gas in 2021. Therefore, oil & gas are imported to meet the increasing demand in these countries. Maturing fields in Indonesia, Myanmar, Australia, the South China Sea, offshore fields in the Gulf of Thailand as well as geopolitical challenges will further propel the growth of well intervention services in Asia Pacific region.
Implementation of Artificial Life Services in Horizontal Wells
Mature oil fields require an artificial lift to enhance the liquid hydrocarbons production and/or dewatering of the gas wells. Horizontal drilling of well is critical to access hydrocarbons that are locked away in unconventional reservoirs. Horizontal wells are recognized by their steep declining curves, turbulent fluid production, and irregular wellbore geometries. These complex characteristics, especially in formulations that are unconventional, pose a formidable challenge for traditional artificial lift technologies and related intervention services.
Low reservoir pressure of mature wells and a low liquid inflow rates. Hence, artificial methods are extensively used in oil recovery and other liquids from these wells. However, plungers and other types of artificial lifts may no longer be viable, and new artificial methods are required to lift relatively low volumes of liquid from deep wells.
What Are These Questions You Should Ask Before Buying a Market Research Report?
• How is the well intervention market evolving?
• What is driving and restraining the well intervention market?
• How will each well intervention submarket segment grow over the forecast period and how much revenue will these submarkets account for in 2032?
• How will the market shares for each well intervention submarket develops from 2021 to 2032?
• What will be the main driver for the overall market from 2021 to 2032?
• Will leading well intervention markets broadly follow the macroeconomic dynamics, or will individual national markets outperform others?
• How will the market shares of the national markets change by 2032 and which geographical region will lead the market in 2032?
• Who are the leading players and what are their prospects over the forecast period?
• How will the industry evolve during the period between 2022 and 2032?
• Where is the well intervention market heading? And how can you ensure you are at the forefront of the market?
• What can be the best investment options for new product and service lines?
• What are the key prospects for moving companies into a new growth path? C-suite?
You need to discover how this will impact the drug discovery informatics market today, and over the next 10 years:
• Our 408-page report provides 308 tables and 330 charts/graphs exclusively to you.
• The report highlights key lucrative areas in the industry so you can target them – NOW.
• Contains in-depth analyse of global, regional and national sales and growth
• Highlights for you the key successful trends, changes and revenue projections made by your competitors
This report tells you TODAY how the well intervention market will develop in the next 10 years, and in-line with the variations in COVID-19 economic recession and bounce. This market is more critical now than at any point over the last 10 years.
Delivers exclusive COVID-19 variations economic data specific to your market.
To access the data contained in this document please email contactus@visiongain.com
Forecasts to 2032 and other analyses reveal the commercial prospects
• In addition to revenue forecasting to 2032, our new study provides you with recent results, growth rates, and market shares.
• You find original analyses, with business outlooks and developments.
• Discover qualitative analyses (including market dynamics, drivers, opportunities, restraints and challenges), cost structure, impact of rising pharmaceutical spray dryer prices and recent developments.
This report includes data analysis and invaluable insight into how COVID-19 will affect the industry and your company. Four COVID-19 recovery patterns and their impact, namely, V, L, W and U are discussed in this report.
Global Well Intervention Market (COVID Impact Analysis) by Service Type
• Logging and Bottomhole Survey
• Stimulation
• Tubing/Packer Failure and Repair
• Remedial Cementing
• Sand Control
• Zonal Isolation
• Others
Global Well Intervention Market (COVID Impact Analysis) by Well Type
• Horizontal
• Vertical
Global Well Intervention Market (COVID Impact Analysis) by Application
• Onshore
• Offshore

In addition to the revenue predictions for the overall world market and segments, you will also find revenue forecasts for 5 regional and 22 leading national markets:
North America Well Intervention Market, 2021 to 2032 Market Outlook
• U.S. Well Intervention Market, 2021 to 2032 Market Forecast & COVID Impact Analysis
• Canada Well Intervention Market, 2021 to 2032 Market Forecast & COVID Impact Analysis
Europe Well Intervention Market, 2021 to 2032 Market Outlook
• Russia Well Intervention Market, 2021 to 2032 Market Forecast & COVID Impact Analysis
• The UK Well Intervention Market, 2021 to 2032 Market Forecast & COVID Impact Analysis
• Norway Well Intervention Market, 2021 to 2032 Market Forecast & COVID Impact Analysis
• Denmark Well Intervention Market, 2021 to 2032 Market Forecast & COVID Impact Analysis
• Italy Well Intervention Market, 2021 to 2032 Market Forecast & COVID Impact Analysis
• Germany Well Intervention Market, 2021 to 2032 Market Forecast & COVID Impact Analysis
• Rest of Europe Market Forecast & COVID Impact Analysis
Asia Pacific Well Intervention Market, 2021 to 2032 Market Outlook
• China Well Intervention Market, 2021 to 2032 Market Forecast & COVID Impact Analysis
• India Well Intervention Market, 2021 to 2032 Market Forecast & COVID Impact Analysis
• Australia Well Intervention Market, 2021 to 2032 Market Forecast & COVID Impact Analysis
• Indonesia Well Intervention Market, 2021 to 2032 Market Forecast & COVID Impact Analysis
• Malaysia Well Intervention Market, 2021 to 2032 Market Forecast & COVID Impact Analysis
• Thailand Well Intervention Market, 2021 to 2032 Market Forecast & COVID Impact Analysis
• Rest of Asia Pacific Market Forecast & COVID Impact Analysis
Latin America Well Intervention Market, 2021 to 2032 Market Outlook
• Brazil Well Intervention Market, 2021 to 2032 Market Forecast & COVID Impact Analysis
• Mexico Well Intervention Market, 2021 to 2032 Market Forecast & COVID Impact Analysis
• Argentina Well Intervention Market, 2021 to 2032 Market Forecast & COVID Impact Analysis
• Venezuela Well Intervention Market, 2021 to 2032 Market Forecast & COVID Impact Analysis
• Rest of Latin America Market Forecast & COVID Impact Analysis
Middle East and Africa Well Intervention Market, 2021 to 2032 Market Outlook
• GCC Well Intervention Market, 2021 to 2032 Market Forecast & COVID Impact Analysis
• Iraq Well Intervention Market, 2021 to 2032 Market Forecast & COVID Impact Analysis
• Nigeria Well Intervention Market, 2021 to 2032 Market Forecast & COVID Impact Analysis
• Angola Well Intervention Market, 2021 to 2032 Market Forecast & COVID Impact Analysis
• Rest of MEA Market Forecast & COVID Impact Analysis
Need industry data? Please contact us today.
Leading companies in the global market for Well Intervention:
• Altus Intervention
• Archer
• Baker Hughes
• Basic Energy Services
• Expro Group
• Hallirburton
• Key Energy Services
• NexTier Oilfield Solutions
• Nine Energy Services
• Oceaneering International
• Pioneer Energy Services
• Schlumberger
• Trican Well Services
• Weatherford International
• Welltec
Overall world revenue for Well Intervention Market, 2021 to 2032 in terms of value the market will surpass US$xx million in 2021, our work calculates. We predict strong revenue growth through to 2032. Our work identifies which organizations hold the greatest potential. Discover their capabilities, progress, and commercial prospects, helping you stay ahead.
How the Well Intervention Market, 2021 to 2032 report helps you?
In summary, our 408-page report provides you with the following knowledge:
• Revenue forecasts to 2032 for Well Intervention Market, 2021 to 2032 Market, with forecasts for service type, well type, application each forecasted at a global and regional level– discover the industry’s prospects, finding the most lucrative places for investments and revenues
• Revenue forecasts to 2032 for 5 regional and 22 key national markets – See forecasts for the Clinical Trial Supplies Market, 2021 to 2032 market in North America, Europe, Asia-Pacific, Latin America and MEA. Also forecasted is the market in the US, Canada, Mexico, Brazil, Argentina, Venezuela, Russia, Germany, Norway, UK, Italy, China, India, Thailand, Indonesia, and Australia among other prominent economies.
• Prospects for established firms and those seeking to enter the market– including company profiles for 15 of the major companies involved in the Well Intervention Market, 2021 to 2032 Market.
Find quantitative and qualitative analyses with independent predictions. Receive information that only our report contains, staying informed with this invaluable business intelligence.
Information found nowhere else
With our newly report title, you are less likely to fall behind in knowledge or miss out on opportunities. See how our work could benefit your research, analyses, and decisions. Visiongain’s study is for everybody needing commercial analyses for the Well Intervention Market, 2021 to 2032 Market and leading companies. You will find data, trends and predictions.
To access the data contained in this document please email contactus@visiongain.com
Buy our report today Well Intervention Market Report 2022-2032: Forecasts by Service Type (Logging and Bottomhole Survey, Stimulation, Tubing/Packer Failure and Repair, Remedial Cementing, Sand Control, Zonal Isolation, Others), by Well Type (Onshore, Offshore), by Application (Onshore, Offshore) AND Regional and Leading National Market Analysis PLUS Analysis of Leading Companies AND COVID-19 Recovery Scenarios. Avoid missing out by staying informed – order our report now.
Visiongain is a trading partner with the US Federal Government
CCR Ref number: KD4R6
Do you have any custom requirements we can help you with? Any need for a specific country, geo region, market segment or specific company information? Contact us today, we can discuss your needs and see how we can help: sara.peerun@visiongain.com
1. Report Overview
1.1 Introduction to Well Intervention Market
1.2 Well Intervention Market Definition
1.3 Why You Should Read This Report
1.4 What This Report Delivers
1.5 Key Questions Answered by This Analytical Report Include:
1.6 Who is This Report For?
1.7 Methodology
1.7.1 Primary Research
1.7.2 Secondary Research
1.7.3 Market Evaluation & Forecasting Methodology
1.8 Frequently Asked Questions (FAQs)
1.9 Associated Visiongain Reports
1.10 About Visiongain
2 Executive Summary
3 Market Dynamics
3.1 Drivers
3.1.1 Rising need for enhancing production efficiency of mature oil & gas fields
3.1.2 Increasing Demand for Oil & Gas in Asia Pacific Region
3.1.3 Continuous development in the shale reservoirs
3.2 Restraints
3.2.1 Fluctuation in Oil Prices and Decline in Upstream CAPEX
3.2.2 Stringent Government Regulations
3.3 Opportunities
3.3.1 Rise in number of oil & gas discoveries
3.3.2 Rising Digitalization and Automation of Well Intervention Services
3.4 Challenges
3.4.1 Implementation of Artificial Life Services in Horizontal Wells
3.4.2 Supply Chain Disruptions and Decline in Demand due to COVID-19 Pandemic
3.5 SWOT Analysis
3.5.1 Strengths
3.5.2 Weaknesses
3.5.3 Opportunities
3.5.4 Threats
3.6 Porter’s Five Forces Analysis
3.6.1 Threat of Substitutes
3.6.2 Bargaining Power of Suppliers
3.6.3 Bargaining Power of Buyers
3.6.4 Threat of New Entrants
3.6.5 Intensity of Competitive Rivalry
3.7 PEST Analysis
3.7.1 Political Factors Impacting Well Intervention Market
3.7.2 Economic Factors Impacting Well Intervention Market
3.7.3 Social Factors Impacting Well Intervention Market
3.7.4 Technological Factors Impacting Well Intervention Market
4 Well Intervention Market by Service Type Forecast, 2021-2032
4.1 Logging and Bottomhole Survey Segment Market Forecast, 2021-2032
4.1.1 Logging and bottomhole survey has gained more importance in recent years with increased production of unconventional resources in complex reservoirs.
4.1.2 Recovery Scenarios (V, U, W, L)
4.2 Stimulation Segment Market Forecast, 2021-2032
4.2.1 Growing demand for hydraulic fracturing in North America to offer lucrative opportunities to stimulation service providers
4.2.2 Recovery Scenarios (V, U, W, L)
4.3 Tubing/Packer Failure and Repair Segment Market Forecast, 2021-2032
4.3.1 Europe to be the second largest tubing/packing failure and repair service market
4.3.2 Recovery Scenarios (V, U, W, L)
4.4 Remedial Cementing Segment Market Forecast, 2021-2032
4.4.1 Complexities in carrying out exploration and production activities in unconventional reserves to drive growth of remedial cementing segment
4.4.2 Recovery Scenarios (V, U, W, L)
4.5 Sand Control Segment Market Forecast, 2021-2032
4.5.1 Redevelopment of aging reservoirs to provide lucrative opportunities for players in sand control segment
4.5.2 Recovery Scenarios (V, U, W, L)
4.6 Zonal Isolation Segment Market Forecast, 2021-2032
4.6.1 Increase in oil & gas production from mature and horizontal wells to drive growth of zonal isolation segment
4.6.2 Recovery Scenarios (V, U, W, L)
4.7 Others Segment Market Forecast, 2021-2032
4.7.1 Recovery Scenarios (V, U, W, L)
5 Well Intervention Market by Well Type Forecast, 2021-2032
5.1 Horizontal Segment Market Forecast, 2021-2032
5.1.1 Shale developments to boost growth of horizontal well segment across the globe
5.1.2 Recovery Scenarios (V, U, W, L)
5.2 Vertical Segment Market Forecast, 2021-2032
5.2.1 Asia Pacific to dominate market for vertical wells owing to increasing count of mature conventional fields
5.2.2 Recovery Scenarios (V, U, W, L)
6 Well Intervention Market by Application Forecast, 2021-2032
6.1 Onshore Segment Market Forecast, 2021-2032
6.1.1 Increasing number of onshore oil & gas and mature fields to drive growth of well intervention market
6.1.2 Recovery Scenarios (V, U, W, L)
6.2 Offshore Segment Market Forecast, 2021-2032
6.2.1 Increasing deep and ultra-deepwater drilling and production activities and number of maturing subsea wells to drive the market growth
6.2.2 Recovery Scenarios (V, U, W, L)
7 Global Well Intervention Market Forecast, 2021-2032
7.1 Global Well Intervention Market by Region Forecast 2021-2032
7.2 Recovery Scenarios (V, U, W, L)
8 North America Well Intervention Market, 2021-2032
8.1 Growing need to increase production from mature fields is propelling the demand of North American market
8.2 North America Well Intervention Market by Country, Forecast 2021-2032
8.3 North America Well Intervention Market Forecast by Service Type
8.3.1 Recovery Scenarios (V, U, W, L): North America Well Intervention Market Forecast by Service Type, 2021-2032
8.4 North America Well Intervention Market Forecast by Well Type
8.4.1 Recovery Scenarios (V, U, W, L): North America Well Intervention Market Forecast by Well Type, 2021-2032
8.5 North America Well Intervention Market Forecast by Application
8.5.1 Recovery Scenarios (V, U, W, L): North America Well Intervention Market Forecast by Application, 2021-2032
8.6 U.S. Well Intervention Market Forecast, 2021-2032
8.6.1 Increasing production from mature shale and tight oil reserves in the US to drive growth of well intervention market
8.6.2 Recovery Scenarios (V, U, W, L): U.S. Well Intervention Market Forecast, 2021-2032
8.7 Canada Well Intervention Market Forecast, 2021-2032
8.7.1 Potential drilling of oil sands and increase in onshore oil production to boost demand for well intervention services
8.7.2 Recovery Scenarios (V, U, W, L): Canada Well Intervention Market Forecast, 2021-2032
9 Europe Well Intervention Market, 2021-2032
9.1 Presence of gas reserves and increasing production of oil is driving the market growth in Europe
9.2 Europe Well Intervention Market by Country, Forecast 2021-2032
9.3 Europe Well Intervention Market Forecast by Service Type
9.3.1 Recovery Scenarios (V, U, W, L): Europe Well Intervention Market Forecast by Service Type, 2021-2032
9.4 Europe Well Intervention Market Forecast by Well Type
9.4.1 Recovery Scenarios (V, U, W, L): Europe Well Intervention Market Forecast by Well Type, 2021-2032
9.5 Europe Well Intervention Market Forecast by Application
9.5.1 Recovery Scenarios (V, U, W, L): Europe Well Intervention Market Forecast by Application, 2021-2032
9.6 Russia Well Intervention Market Forecast, 2021-2032
9.6.1 Increasing exploration and production activities in Russia’s far east region to drive the growth of well intervention market
9.6.2 Recovery Scenarios (V, U, W, L): Russia Well Intervention Market Forecast, 2021-2032
9.7 UK Well Intervention Market Forecast, 2021-2032
9.7.1 Maximizing production potential in Brownfields to fuel growth of well intervention market in the UK during the forecast period
9.7.2 Advancements in the well intervention technology in the past few years driving the market growth
9.7.3 Recovery Scenarios (V, U, W, L): UK Well Intervention Market Forecast, 2021-2032
9.8 Norway Well Intervention Market Forecast, 2021-2032
9.8.1 Rapidly depleting mature oil and gas fields offers lucrative market opportunities in the Norway
9.8.2 Recovery Scenarios (V, U, W, L): Norway Well Intervention Market Forecast, 2021-2032
9.9 Denmark Well Intervention Market Forecast, 2021-2032
9.9.1 Redevelopment of mature offshore fields is projected to support growth of well intervention market
9.9.2 Recovery Scenarios (V, U, W, L): Denmark Well Intervention Market Forecast, 2021-2032
9.10 Italy Well Intervention Market Forecast, 2021-2032
9.10.1 Roust growth in the natural gas sector will drive the growth of well intervention market
9.10.2 Recovery Scenarios (V, U, W, L): Italy Well Intervention Market Forecast, 2021-2032
9.11 Germany Well Intervention Market Forecast, 2021-2032
9.11.1 Shift towards renewable energy is projected to slower the growth of well intervention market
9.11.2 Recovery Scenarios (V, U, W, L): Germany Well Intervention Market Forecast, 2021-2032
9.12 Rest of Europe Well Intervention Market Forecast, 2021-2032
9.12.1 Rising oil production activities in the CIS countries
9.12.2 Recovery Scenarios (V, U, W, L): Rest of Europe Well Intervention Market Forecast, 2021-2032
10 Asia Pacific Well Intervention Market, 2021-2032
10.1 Rapid expansion in the demand for oil and gas in recent years owing to various factors driving the growth of Asia Pacific well intervention market
10.2 Asia Pacific Well Intervention Market by Country, Forecast 2021-2032
10.3 Asia Pacific Well Intervention Market Forecast by Service Type
10.3.1 Recovery Scenarios (V, U, W, L): Asia Pacific Well Intervention Market Forecast by Service Type, 2021-2032
10.4 Asia Pacific Well Intervention Market Forecast by Well Type
10.4.1 Recovery Scenarios (V, U, W, L): Asia Pacific Well Intervention Market Forecast by Well Type, 2021-2032
10.5 Asia Pacific Well Intervention Market Forecast by Application
10.5.1 Recovery Scenarios (V, U, W, L): Asia Pacific Well Intervention Market Forecast by Application, 2021-2032
10.6 China Well Intervention Market Forecast, 2021-2032
10.6.1 Increasing exploration and production from unconventional resources to fuel growth of Chinese well intervention market
10.6.2 Recovery Scenarios (V, U, W, L): China Well Intervention Market Forecast, 2021-2032
10.7 India Well Intervention Market Forecast, 2021-2032
10.7.1 Redevelopment of legacy oilfields to drive growth of well interventional market
10.7.2 Recovery Scenarios (V, U, W, L): India Well Intervention Market Forecast, 2021-2032
10.8 Australia Well Intervention Market Forecast, 2021-2032
10.8.1 Development of unconventional shale resources to create growth opportunities for well intervention market in Australia
10.8.2 Recovery Scenarios (V, U, W, L): Australia Well Intervention Market Forecast, 2021-2032
10.9 Indonesia Well Intervention Market Forecast, 2021-2032
10.9.1 Steep decline in production from mature fields to fuel demand for well intervention
10.9.2 Recovery Scenarios (V, U, W, L): Indonesia Well Intervention Market Forecast, 2021-2032
10.10 Malaysia Well Intervention Market Forecast, 2021-2032
10.10.1 Increasing capital expenditures in exploration and drilling activities to boost the market growth
10.10.2 Recovery Scenarios (V, U, W, L): Malaysia Well Intervention Market Forecast, 2021-2032
10.11 Thailand Well Intervention Market Forecast, 2021-2032
10.11.1 Recovery Scenarios (V, U, W, L): Thailand Well Intervention Market Forecast, 2021-2032
10.12 Rest of Asia Pacific Well Intervention Market Forecast, 2021-2032
10.12.1 Recovery Scenarios (V, U, W, L): Rest of Asia Pacific Well Intervention Market Forecast, 2021-2032
11 Latin America Well Intervention Market, 2021-2032
11.1 Latin America Well Intervention Market by Country, Forecast 2021-2032
11.2 Latin America Well Intervention Market Forecast by Service Type
11.2.1 Recovery Scenarios (V, U, W, L): Latin America Well Intervention Market Forecast by Service Type, 2021-2032
11.3 Latin America Well Intervention Market Forecast by Well Type
11.3.1 Recovery Scenarios (V, U, W, L): Latin America Well Intervention Market Forecast by Well Type, 2021-2032
11.4 Latin America Well Intervention Market Forecast by Application
11.4.1 Recovery Scenarios (V, U, W, L): Latin America Well Intervention Market Forecast by Application, 2021-2032
11.5 Mexico Well Intervention Market Forecast, 2021-2032
11.5.1 Increasing investments in maximizing production from aging fields and shale developments to boost market growth
11.5.2 Recovery Scenarios (V, U, W, L): Mexico Well Intervention Market Forecast, 2021-2032
11.6 Brazil Well Intervention Market Forecast, 2021-2032
11.6.1 Increasing offshore exploration and production activities to boost well intervention market growth
11.6.2 Recovery Scenarios (V, U, W, L): Brazil Well Intervention Market Forecast, 2021-2032
11.7 Venezuela Well Intervention Market Forecast, 2021-2032
11.7.1 Government initiatives to revitalize oil production activities to fuel growth of Venezuelan well intervention market
11.7.2 Recovery Scenarios (V, U, W, L): Venezuela Well Intervention Market Forecast, 2021-2032
11.8 Argentina Well Intervention Market Forecast, 2021-2032
11.8.1 Shale developments to create potential demand for well intervention services in Argentina
11.8.2 Recovery Scenarios (V, U, W, L): Argentina Well Intervention Market Forecast, 2021-2032
11.9 Rest of Latin America Well Intervention Market Forecast, 2021-2032
11.9.1 Major regulatory reforms to attract overseas oil & gas companies propelling the market growth
11.9.2 Recovery Scenarios (V, U, W, L): Rest of Latin America Well Intervention Market Forecast, 2021-2032
12 Middle East & Africa Well Intervention Market, 2021-2032
12.1 Middle East & Africa Well Intervention Market by Country, Forecast 2021-2032
12.2 Middle East & Africa Well Intervention Market Forecast by Service Type
12.2.1 Recovery Scenarios (V, U, W, L): Middle East & Africa Well Intervention Market Forecast by Service Type, 2021-2032
12.3 Middle East & Africa Well Intervention Market Forecast by Well Type
12.3.1 Recovery Scenarios (V, U, W, L): Middle East & Africa Well Intervention Market Forecast by Well Type, 2021-2032
12.4 Middle East & Africa Well Intervention Market Forecast by Application
12.4.1 Recovery Scenarios (V, U, W, L): Middle East & Africa Well Intervention Market Forecast by Application, 2021-2032
12.5 GCC Well Intervention Market Forecast, 2021-2032
12.5.1 Enhanced crude oil production from onshore fields and surge in offshore exploration to drive the well intervention market growth
12.5.2 Recovery Scenarios (V, U, W, L): GCC Well Intervention Market Forecast, 2021-2032
12.6 Iraq Well Intervention Market Forecast, 2021-2032
12.6.1 Increasing onshore well drilling activities in Iraq to create growth opportunities for well intervention market
12.6.2 Recovery Scenarios (V, U, W, L): Iraq Well Intervention Market Forecast, 2021-2032
12.7 Nigeria Well Intervention Market Forecast, 2021-2032
12.7.1 Rise in exploration activities and developments in mature oil and gas fields to boost market growth
12.7.2 Recovery Scenarios (V, U, W, L): Nigeria Well Intervention Market Forecast, 2021-2032
12.8 Angola Well Intervention Market Forecast, 2021-2032
12.8.1 Deepwater and ultra-deepwater developments to create growth opportunities
12.8.2 Recovery Scenarios (V, U, W, L): Angola Well Intervention Market Forecast, 2021-2032
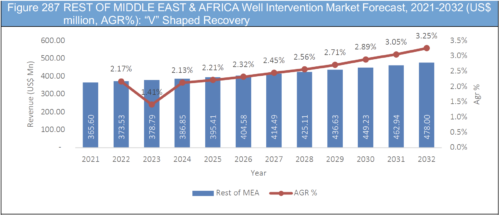
12.9 Rest of Middle East & Africa Well Intervention Market Forecast, 2021-2032
12.9.1 Increasing investments done by governments and private sector companies will drive the market growth
12.9.2 Recovery Scenarios (V, U, W, L): Rest of Middle East & Africa Well Intervention Market Forecast, 2021-2032
13 Company Profiles
13.1 Company Share Analysis
13.2 Recent Developments
13.3 Halliburton
13.3.1 Company Snapshot
13.3.2 Company Overview
13.3.3 Future Outlook
13.3.4 Financial Analysis
13.3.4.1 Net Revenue, 2016-2020
13.3.4.2 Regional Revenue/Market Shares, 2018-2020
13.3.4.3 Segmental Revenue/Market Shares, 2018-2020
13.3.4.4 R&D, 2018-2020
13.3.5 Product Benchmarking
13.3.6 Recent Developments, 2017-2020
13.4 Schlumberger
13.4.1 Company Snapshot
13.4.2 Company Overview
13.4.3 Future Outlook
13.4.4 Financial Analysis
13.4.4.1 Net Revenue, 2016-2020
13.4.4.2 Regional Revenue/Market Shares, 2018-2020
13.4.4.3 Segmental Revenue/Market Shares, 2018-2020
13.4.4.4 Gross Profit, 2018-2020
13.4.4.5 R&D, 2018-2020
13.4.5 Product Benchmarking
13.4.6 Recent Developments, 2017-2020
13.5 Baker Hughes
13.5.1 Company Snapshot
13.5.2 Company Overview
13.5.3 Future Outlook
13.5.4 Financial Analysis
13.5.4.1 Net Revenue, 2016-2020
13.5.4.2 Regional Revenue/Market Shares, 2018-2020
13.5.4.3 Segmental Revenue/Market Shares, 2018-2020
13.5.4.4 R&D, 2018-2020
13.5.5 Product Benchmarking
13.5.6 Recent Developments, 2017-2020
13.6 Weatherford International
13.6.1 Company Snapshot
13.6.2 Company Overview
13.6.3 Future Outlook
13.6.4 Financial Analysis
13.6.4.1 Net Revenue, 2016-2020
13.6.4.2 Regional Revenue/Market Shares, 2018-2020
13.6.4.3 Segmental Revenue/Market Shares, 2018-2020
13.6.4.4 R&D, 2018-2020
13.6.5 Product Benchmarking
13.6.6 Recent Developments, 2017-2020
13.7 NexTier Oilfield Solutions
13.7.1 Company Snapshot
13.7.2 Company Overview
13.7.3 Future Outlook
13.7.4 Financial Analysis
13.7.4.1 Net Revenue, 2016-2020
13.7.4.2 Regional Revenue/Market Shares, 2018-2020
13.7.4.3 Segmental Revenue/Market Shares, 2018-2020
13.7.4.4 Gross Profit, 2018-2020
13.7.4.5 R&D, 2018-2020
13.7.5 Product Benchmarking
13.7.6 Recent Developments, 2017-2020
13.8 Archer
13.8.1 Company Snapshot
13.8.2 Company Overview
13.8.3 Future Outlook
13.8.4 Financial Analysis
13.8.4.1 Net Revenue, 2016-2020
13.8.4.2 Regional Revenue/Market Shares, 2018-2020
13.8.5 Product Benchmarking
13.8.6 Recent Developments, 2017-2020
13.9 Expro Group
13.9.1 Company Snapshot
13.9.2 Company Overview
13.9.3 Future Outlook
13.9.4 Financial Analysis
13.9.4.1 Net Revenue, 2016-2020
13.9.4.2 Regional Revenue/Market Shares, 2018-2020
13.9.4.3 Segmental Revenue/Market Shares, 2018-2020
13.9.4.4 Gross Profit, 2018-2020
13.9.5 Product Benchmarking
13.9.6 Recent Developments, 2017-2020
13.10 Trican Well Service
13.10.1 Company Snapshot
13.10.2 Company Overview
13.10.3 Financial Analysis
13.10.3.1 Net Revenue, 2016-2020
13.10.3.2 Segmental Revenue/Market Shares, 2018-2020
13.10.4 Product Benchmarking
13.10.5 Recent Developments, 2017-2020
13.11 Pioneer Energy Services
13.11.1 Company Snapshot
13.11.2 Company Overview
13.11.3 Product Benchmarking
13.12 Basic Energy Services
13.12.1 Company Snapshot
13.12.2 Company Overview
13.12.3 Product Benchmarking
13.12.4 Recent Developments, 2017-2020
13.13 Nine Energy Services
13.13.1 Company Snapshot
13.13.2 Company Overview
13.13.3 Financial Analysis
13.13.3.1 Net Revenue, 2016-2020
13.13.3.2 Regional Revenue/Market Shares, 2018-2020
13.13.3.3 Segmental Revenue/Market Shares, 2018-2020
13.13.4 Product Benchmarking
13.13.5 Recent Developments, 2017-2020
13.14 Key Energy Services
13.14.1 Company Snapshot
13.14.2 Company Overview
13.14.3 Financial Analysis
13.14.3.1 Net Revenue, 2016-2020
13.14.3.2 Segmental Revenue/Market Shares, 2018-2020
13.14.3.3 Gross Profit, 2018-2020
13.14.4 Product Benchmarking
13.15 Altus Intervention
13.15.1 Company Snapshot
13.15.2 Company Overview
13.15.3 Product Benchmarking
13.15.4 Recent Developments, 2017-2020
13.16 Welltec
13.16.1 Company Snapshot
13.16.2 Company Overview
13.16.3 Product Benchmarking
13.17 Oceaneering International
13.17.1 Company Snapshot
13.17.2 Company Overview
13.17.3 Financial Analysis
13.17.3.1 Net Revenue, 2016-2020
13.17.3.2 Regional Revenue/Market Shares, 2018-2020
13.17.3.3 Segmental Revenue/Market Shares, 2018-2020
13.17.3.4 R&D, 2018-2020
13.17.4 Product Benchmarking
13.17.5 Recent Developments, 2017-2020
14 Conclusion and Recommendations
14.1 Concluding Remarks from Visiongain
14.2 Recommendations for Market Players
14.3 Rising need to increase production from mature oil fields is propelling the growth of North American market
List of Tables
Table 1 Global Well Intervention Market Snapshot, 2021 & 2032 (US$ billion, CAGR %)
Table 2 Recoverable oil & gas resources in major countries (2020)
Table 3 Global Well Intervention Market by Service Type Forecast, 2021-2032 (US$ Mn, AGR%, CAGR%)
Table 4 Global Well Intervention Market by Service Type Forecast, 2021-2032 (US$ Mn, AGR%, CAGR%)
Table 5 Global Well Intervention Market by Service Type Forecast, 2021-2032 (US$ Mn, AGR%, CAGR%)
Table 6 Global Well Intervention Market by Service Type Forecast, 2021-2032 (US$ Mn, AGR%, CAGR%)
Table 7 Global Well Intervention Market by Service Type Forecast, 2021-2032 (US$ Mn, AGR%, CAGR%)
Table 8 Global Well Intervention Market by Service Type Forecast, 2021-2032 (US$ Mn, AGR%, CAGR%)
Table 9 Global Well Intervention Market by Service Type Forecast, 2021-2032 (US$ Mn, AGR%, CAGR%)
Table 10 Global Well Intervention Market by Service Type Forecast, 2021-2032 (US$ Mn, AGR%, CAGR%)
Table 1 Global Well Intervention Market by Service Type Forecast, 2021-2032 (US$ Mn, AGR%, CAGR%)
Table 11 Global Well Intervention Market by Service Type Forecast, 2021-2032 (US$ Mn, AGR%, CAGR%)
Table 2 Global Well Intervention Market by Service Type Forecast, 2021-2032 (US$ Mn, AGR%, CAGR%)
Table 3 Global Well Intervention Market by Service Type Forecast, 2021-2032 (US$ Mn, AGR%, CAGR%)
Table 4 Global Well Intervention Market by Service Type Forecast, 2021-2032 (US$ Mn, AGR%, CAGR%)
Table 5 Global Well Intervention Market by Service Type Forecast, 2021-2032 (US$ Mn, AGR%, CAGR%)
Table 6 Global Well Intervention Market by Service Type Forecast, 2021-2032 (US$ Mn, AGR%, CAGR%)
Table 7 Global Well Intervention Market by Service Type Forecast, 2021-2032 (US$ Mn, AGR%, CAGR%)
Table 8 Global Well Intervention Market by Service Type Forecast, 2021-2032 (US$ Mn, AGR%, CAGR%)
Table 9 Global Well Intervention Market by Service Type Forecast, 2021-2032 (US$ Mn, AGR%, CAGR%)
Table 10 Global Well Intervention Market by Service Type Forecast, 2021-2032 (US$ Mn, AGR%, CAGR%)
Table 11 Global Well Intervention Market by Service Type Forecast, 2021-2032 (US$ Mn, AGR%, CAGR%)
Table 12 Global Well Intervention Market by Service Type Forecast, 2021-2032 (US$ Mn, AGR%, CAGR%)
Table 13 Global Well Intervention Market by Service Type Forecast, 2021-2032 (US$ Mn, AGR%, CAGR%)
Table 14 Global Well Intervention Market by Service Type Forecast, 2021-2032 (US$ Mn, AGR%, CAGR%)
Table 15 Global Well Intervention Market by Service Type Forecast, 2021-2032 (US$ Mn, AGR%, CAGR%)
Table 16 Global Well Intervention Market by Service Type Forecast, 2021-2032 (US$ Mn, AGR%, CAGR%)
Table 17 Global Well Intervention Market by Service Type Forecast, 2021-2032 (US$ Mn, AGR%, CAGR%)
Table 18 Global Well Intervention Market by Service Type Forecast, 2021-2032 (US$ Mn, AGR%, CAGR%)
Table 19 Global Well Intervention Market by Service Type Forecast, 2021-2032 (US$ Mn, AGR%, CAGR%)
Table 20 Global Well Intervention Market by Service Type Forecast, 2021-2032 (US$ Mn, AGR%, CAGR%)
Table 21 Global Well Intervention Market by Service Type Forecast, 2021-2032 (US$ Mn, AGR%, CAGR%)
Table 22 Global Well Intervention Market by Service Type Forecast, 2021-2032 (US$ Mn, AGR%, CAGR%)
Table 23 Global Well Intervention Market by Service Type Forecast, 2021-2032 (US$ Mn, AGR%, CAGR%)
Table 24 Global Well Intervention Market by Service Type Forecast, 2021-2032 (US$ Mn, AGR%, CAGR%)
Table 25 Global Well Intervention Market by Service Type Forecast, 2021-2032 (US$ Mn, AGR%, CAGR%)
Table 26 Global Well Intervention Market by Service Type Forecast, 2021-2032 (US$ Mn, AGR%, CAGR%)
Table 27 Global Well Intervention Market by Service Type Forecast, 2021-2032 (US$ Mn, AGR%, CAGR%)
Table 28 Global Well Intervention Market by Well Type Forecast, 2021-2032 (US$ Mn, AGR%, CAGR%)
Table 29 Global Well Intervention Market by Well Type Forecast, 2021-2032 (US$ Mn, AGR%, CAGR%)
Table 30 Global Well Intervention Market by Well Type Forecast, 2021-2032 (US$ Mn, AGR%, CAGR%)
Table 31 Global Well Intervention Market by Well Type Forecast, 2021-2032 (US$ Mn, AGR%, CAGR%)
Table 32 Global Well Intervention Market by Well Type Forecast, 2021-2032 (US$ Mn, AGR%, CAGR%)
Table 33 Global Well Intervention Market by Well Type Forecast, 2021-2032 (US$ Mn, AGR%, CAGR%)
Table 34 Global Well Intervention Market by Well Type Forecast, 2021-2032 (US$ Mn, AGR%, CAGR%)
Table 35 Global Well Intervention Market by Well Type Forecast, 2021-2032 (US$ Mn, AGR%, CAGR%)
Table 36 Global Well Intervention Market by Well Type Forecast, 2021-2032 (US$ Mn, AGR%, CAGR%)
Table 37 Global Well Intervention Market by Well Type Forecast, 2021-2032 (US$ Mn, AGR%, CAGR%)
Table 38 Global Well Intervention Market by Well Type Forecast, 2021-2032 (US$ Mn, AGR%, CAGR%)
Table 39 Global Well Intervention Market by Application Forecast, 2021-2032 (US$ Mn, AGR%, CAGR%)
Table 40 Global Well Intervention Market by Application Forecast, 2021-2032 (US$ Mn, AGR%, CAGR%)
Table 41 Global Well Intervention Market by Application Forecast, 2021-2032 (US$ Mn, AGR%, CAGR%)
Table 42 Global Well Intervention Market by Application Forecast, 2021-2032 (US$ Mn, AGR%, CAGR%)
Table 43 Global Well Intervention Market by Application Forecast, 2021-2032 (US$ Mn, AGR%, CAGR%)
Table 44 Global Well Intervention Market by Application Forecast, 2021-2032 (US$ Mn, AGR%, CAGR%)
Table 45 Global Well Intervention Market by Application Forecast, 2021-2032 (US$ Mn, AGR%, CAGR%)
Table 46 Global Well Intervention Market by Application Forecast, 2021-2032 (US$ Mn, AGR%, CAGR%)
Table 47 Global Well Intervention Market by Application Forecast, 2021-2032 (US$ Mn, AGR%, CAGR%)
Table 48 Global Well Intervention Market by Application Forecast, 2021-2032 (US$ Mn, AGR%, CAGR%)
Table 49 Global Well Intervention Market by Application Forecast, 2021-2032 (US$ Mn, AGR%, CAGR%)
Table 50 Global Well Intervention Market by Region Forecast, 2021-2032 (US$ Mn, AGR%, CAGR%)
Table 51 Global Well Intervention Market by Region Forecast, 2021-2032 (US$ Mn, AGR%, CAGR%)
Table 52 Global Well Intervention Market by Region Forecast, 2021-2032 (US$ Mn, AGR%, CAGR%)
Table 53 Global Well Intervention Market by Region Forecast, 2021-2032 (US$ Mn, AGR%, CAGR%)
Table 54 Global Well Intervention Market by Region Forecast, 2021-2032 (US$ Mn, AGR%, CAGR%)
Table 55 North America Well Intervention Market by Country Forecast, 2021-2032 (US$ Mn, AGR%, CAGR%)
Table 56 North America Well Intervention Market by Service Type Forecast, 2021-2032 (US$ Mn, AGR%, CAGR%)
Table 57 North America Well Intervention Market by Service Type Forecast, 2021-2032 (US$ Mn, AGR%, CAGR%)
Table 58 North America Well Intervention Market by Service Type Forecast, 2021-2032 (US$ Mn, AGR%, CAGR%)
Table 59 North America Well Intervention Market by Service Type Forecast, 2021-2032 (US$ Mn, AGR%, CAGR%)
Table 60 North America Well Intervention Market by Service Type Forecast, 2021-2032 (US$ Mn, AGR%, CAGR%)
Table 61 North America Well Intervention Market by Well Type Forecast, 2021-2032 (US$ Mn, AGR%, CAGR%)
Table 62 North America Well Intervention Market by Well Type Forecast, 2021-2032 (US$ Mn, AGR%, CAGR%)
Table 63 North America Well Intervention Market by Well Type Forecast, 2021-2032 (US$ Mn, AGR%, CAGR%)
Table 64 North America Well Intervention Market by Well Type Forecast, 2021-2032 (US$ Mn, AGR%, CAGR%)
Table 65 North America Well Intervention Market by Well Type Forecast, 2021-2032 (US$ Mn, AGR%, CAGR%)
Table 66 North America Well Intervention Market by Application Forecast, 2021-2032 (US$ Mn, AGR%, CAGR%)
Table 67 North America Well Intervention Market by Application Forecast, 2021-2032 (US$ Mn, AGR%, CAGR%)
Table 68 North America Well Intervention Market by Application Forecast, 2021-2032 (US$ Mn, AGR%, CAGR%)
Table 69 North America Well Intervention Market by Application Forecast, 2021-2032 (US$ Mn, AGR%, CAGR%)
Table 70 North America Well Intervention Market by Application Forecast, 2021-2032 (US$ Mn, AGR%, CAGR%)
Table 71 U.S. Well Intervention Market Forecast, 2021-2032 (US$ bn, AGR%, CAGR%)
Table 72 The US Well Intervention Market by Country Forecast, 2021-2032 (US$ Mn, AGR%, CAGR%)
Table 73 The US Well Intervention Market by Country Forecast, 2021-2032 (US$ Mn, AGR%, CAGR%)
Table 74 The US Well Intervention Market by Country Forecast, 2021-2032 (US$ Mn, AGR%, CAGR%)
Table 75 The US Well Intervention Market by Country Forecast, 2021-2032 (US$ Mn, AGR%, CAGR%)
Table 76 Canada Well Intervention Market Forecast, 2021-2032 (US$ bn, AGR%, CAGR%)
Table 77 Canada Well Intervention Market by Country Forecast, 2021-2032 (US$ Mn, AGR%, CAGR%)
Table 78 Canada Well Intervention Market by Country Forecast, 2021-2032 (US$ Mn, AGR%, CAGR%)
Table 79 Canada Well Intervention Market by Country Forecast, 2021-2032 (US$ Mn, AGR%, CAGR%)
Table 80 Canada Well Intervention Market by Country Forecast, 2021-2032 (US$ Mn, AGR%, CAGR%)
Table 81 Europe Well Intervention Market by Country Forecast, 2021-2032 (US$ Mn, AGR%, CAGR%)
Table 82 Europe Well Intervention Market by Service Type Forecast, 2021-2032 (US$ Mn, AGR%, CAGR%)
Table 83 Europe Well Intervention Market by Service Type Forecast, 2021-2032 (US$ Mn, AGR%, CAGR%)
Table 84 Europe Well Intervention Market by Service Type Forecast, 2021-2032 (US$ Mn, AGR%, CAGR%)
Table 85 Europe Well Intervention Market by Service Type Forecast, 2021-2032 (US$ Mn, AGR%, CAGR%)
Table 86 Europe Well Intervention Market by Service Type Forecast, 2021-2032 (US$ Mn, AGR%, CAGR%)
Table 87 Europe Well Intervention Market by Well Type Forecast, 2021-2032 (US$ Mn, AGR%, CAGR%)
Table 88 Europe Well Intervention Market by Well Type Forecast, 2021-2032 (US$ Mn, AGR%, CAGR%)
Table 89 Europe Well Intervention Market by Well Type Forecast, 2021-2032 (US$ Mn, AGR%, CAGR%)
Table 90 Europe Well Intervention Market by Well Type Forecast, 2021-2032 (US$ Mn, AGR%, CAGR%)
Table 91 Europe Well Intervention Market by Well Type Forecast, 2021-2032 (US$ Mn, AGR%, CAGR%)
Table 92 Europe Well Intervention Market by Application Forecast, 2021-2032 (US$ Mn, AGR%, CAGR%)
Table 93 Europe Well Intervention Market by Application Forecast, 2021-2032 (US$ Mn, AGR%, CAGR%)
Table 94 Europe Well Intervention Market by Application Forecast, 2021-2032 (US$ Mn, AGR%, CAGR%)
Table 95 Europe Well Intervention Market by Application Forecast, 2021-2032 (US$ Mn, AGR%, CAGR%)
Table 96 Europe Well Intervention Market by Application Forecast, 2021-2032 (US$ Mn, AGR%, CAGR%)
Table 97 Russia Well Intervention Market by Country Forecast, 2021-2032 (US$ Mn, AGR%, CAGR%)
Table 98 Russia Well Intervention Market by Country Forecast, 2021-2032 (US$ Mn, AGR%, CAGR%)
Table 99 Russia Well Intervention Market by Country Forecast, 2021-2032 (US$ Mn, AGR%, CAGR%)
Table 100 Russia Well Intervention Market by Country Forecast, 2021-2032 (US$ Mn, AGR%, CAGR%)
Table 101 Russia Well Intervention Market by Country Forecast, 2021-2032 (US$ Mn, AGR%, CAGR%)
Table 102 UK Well Intervention Market by Country Forecast, 2021-2032 (US$ Mn, AGR%, CAGR%)
Table 103 UK Well Intervention Market by Country Forecast, 2021-2032 (US$ Mn, AGR%, CAGR%)
Table 104 UK Well Intervention Market by Country Forecast, 2021-2032 (US$ Mn, AGR%, CAGR%)
Table 105 UK Well Intervention Market by Country Forecast, 2021-2032 (US$ Mn, AGR%, CAGR%)
Table 106 UK Well Intervention Market by Country Forecast, 2021-2032 (US$ Mn, AGR%, CAGR%)
Table 107 Norway Well Intervention Market by Country Forecast, 2021-2032 (US$ Mn, AGR%, CAGR%)
Table 108 Norway Well Intervention Market by Country Forecast, 2021-2032 (US$ Mn, AGR%, CAGR%)
Table 109 Norway Well Intervention Market by Country Forecast, 2021-2032 (US$ Mn, AGR%, CAGR%)
Table 110 Norway Well Intervention Market by Country Forecast, 2021-2032 (US$ Mn, AGR%, CAGR%)
Table 111 Norway Well Intervention Market by Country Forecast, 2021-2032 (US$ Mn, AGR%, CAGR%)
Table 112 Denmark Well Intervention Market by Country Forecast, 2021-2032 (US$ Mn, AGR%, CAGR%)
Table 113 Denmark Well Intervention Market by Country Forecast, 2021-2032 (US$ Mn, AGR%, CAGR%)
Table 114 Denmark Well Intervention Market by Country Forecast, 2021-2032 (US$ Mn, AGR%, CAGR%)
Table 115 Denmark Well Intervention Market by Country Forecast, 2021-2032 (US$ Mn, AGR%, CAGR%)
Table 116 Denmark Well Intervention Market by Country Forecast, 2021-2032 (US$ Mn, AGR%, CAGR%)
Table 117 Italy Well Intervention Market by Country Forecast, 2021-2032 (US$ Mn, AGR%, CAGR%)
Table 118 Italy Well Intervention Market by Country Forecast, 2021-2032 (US$ Mn, AGR%, CAGR%)
Table 119 Italy Well Intervention Market by Country Forecast, 2021-2032 (US$ Mn, AGR%, CAGR%)
Table 120 Italy Well Intervention Market by Country Forecast, 2021-2032 (US$ Mn, AGR%, CAGR%)
Table 121 Italy Well Intervention Market by Country Forecast, 2021-2032 (US$ Mn, AGR%, CAGR%)
Table 122 Germany Well Intervention Market by Country Forecast, 2021-2032 (US$ Mn, AGR%, CAGR%)
Table 123 Germany Well Intervention Market by Country Forecast, 2021-2032 (US$ Mn, AGR%, CAGR%)
Table 124 Germany Well Intervention Market by Country Forecast, 2021-2032 (US$ Mn, AGR%, CAGR%)
Table 125 Germany Well Intervention Market by Country Forecast, 2021-2032 (US$ Mn, AGR%, CAGR%)
Table 126 Germany Well Intervention Market by Country Forecast, 2021-2032 (US$ Mn, AGR%, CAGR%)
Table 127 Rest of Europe Well Intervention Market by Country Forecast, 2021-2032 (US$ Mn, AGR%, CAGR%)
Table 128 Rest of Europe Well Intervention Market by Country Forecast, 2021-2032 (US$ Mn, AGR%, CAGR%)
Table 129 Rest of Europe Well Intervention Market by Country Forecast, 2021-2032 (US$ Mn, AGR%, CAGR%)
Table 130 Rest of Europe Well Intervention Market by Country Forecast, 2021-2032 (US$ Mn, AGR%, CAGR%)
Table 131 Rest of Europe Well Intervention Market by Country Forecast, 2021-2032 (US$ Mn, AGR%, CAGR%)
Table 132 Asia Pacific Well Intervention Market by Country Forecast, 2021-2032 (US$ Mn, AGR%, CAGR%)
Table 133 Asia Pacific Well Intervention Market by Service Type Forecast, 2021-2032(US$ Mn, AGR%, CAGR%)
Table 134 Asia Pacific Well Intervention Market by Service Type Forecast, 2021-2032(US$ Mn, AGR%, CAGR%)
Table 135 Asia Pacific Well Intervention Market by Service Type Forecast, 2021-2032(US$ Mn, AGR%, CAGR%)
Table 136 Asia Pacific Well Intervention Market by Service Type Forecast, 2021-2032(US$ Mn, AGR%, CAGR%)
Table 137 Asia Pacific Well Intervention Market by Service Type Forecast, 2021-2032(US$ Mn, AGR%, CAGR%)
Table 138 Asia Pacific Well Intervention Market by Well Type Forecast, 2021-2032 (US$ Mn, AGR%, CAGR%)
Table 139 Asia Pacific Well Intervention Market by Well Type Forecast, 2021-2032 (US$ Mn, AGR%, CAGR%)
Table 140 Asia Pacific Well Intervention Market by Well Type Forecast, 2021-2032 (US$ Mn, AGR%, CAGR%)
Table 141 Asia Pacific Well Intervention Market by Well Type Forecast, 2021-2032 (US$ Mn, AGR%, CAGR%)
Table 142 Asia Pacific Well Intervention Market by Well Type Forecast, 2021-2032 (US$ Mn, AGR%, CAGR%)
Table 143 Asia Pacific Well Intervention Market by Application Forecast, 2021-2032(US$ Mn, AGR%, CAGR%)
Table 144 Asia Pacific Well Intervention Market by Application Forecast, 2021-2032(US$ Mn, AGR%, CAGR%)
Table 145 Asia Pacific Well Intervention Market by Application Forecast, 2021-2032(US$ Mn, AGR%, CAGR%)
Table 146 Asia Pacific Well Intervention Market by Application Forecast, 2021-2032(US$ Mn, AGR%, CAGR%)
Table 147 Asia Pacific Well Intervention Market by Application Forecast, 2021-2032(US$ Mn, AGR%, CAGR%)
Table 148 China Well Intervention Market by Country Forecast, 2021-2032 (US$ Mn, AGR%, CAGR%)
Table 149 China Well Intervention Market by Country Forecast, 2021-2032 (US$ Mn, AGR%, CAGR%)
Table 150 China Well Intervention Market by Country Forecast, 2021-2032 (US$ Mn, AGR%, CAGR%)
Table 151 China Well Intervention Market by Country Forecast, 2021-2032 (US$ Mn, AGR%, CAGR%)
Table 152 China Well Intervention Market by Country Forecast, 2021-2032 (US$ Mn, AGR%, CAGR%)
Table 153 India Well Intervention Market by Country Forecast, 2021-2032 (US$ Mn, AGR%, CAGR%)
Table 154 India Well Intervention Market by Country Forecast, 2021-2032 (US$ Mn, AGR%, CAGR%)
Table 155 India Well Intervention Market by Country Forecast, 2021-2032 (US$ Mn, AGR%, CAGR%)
Table 156 India Well Intervention Market by Country Forecast, 2021-2032 (US$ Mn, AGR%, CAGR%)
Table 157 India Well Intervention Market by Country Forecast, 2021-2032 (US$ Mn, AGR%, CAGR%)
Table 158 India Well Intervention Market by Country Forecast, 2021-2032 (US$ Mn, AGR%, CAGR%)
Table 159 Australia Well Intervention Market by Country Forecast, 2021-2032 (US$ Mn, AGR%, CAGR%)
Table 160 Australia Well Intervention Market by Country Forecast, 2021-2032 (US$ Mn, AGR%, CAGR%)
Table 161 Australia Well Intervention Market by Country Forecast, 2021-2032 (US$ Mn, AGR%, CAGR%)
Table 162 Australia Well Intervention Market by Country Forecast, 2021-2032 (US$ Mn, AGR%, CAGR%)
Table 163 Australia Well Intervention Market by Country Forecast, 2021-2032 (US$ Mn, AGR%, CAGR%)
Table 164 Indonesia Well Intervention Market by Country Forecast, 2021-2032 (US$ Mn, AGR%, CAGR%)
Table 165 Indonesia Well Intervention Market by Country Forecast, 2021-2032 (US$ Mn, AGR%, CAGR%)
Table 166 Indonesia Well Intervention Market by Country Forecast, 2021-2032 (US$ Mn, AGR%, CAGR%)
Table 167 Indonesia Well Intervention Market by Country Forecast, 2021-2032 (US$ Mn, AGR%, CAGR%)
Table 168 Indonesia Well Intervention Market by Country Forecast, 2021-2032 (US$ Mn, AGR%, CAGR%)
Table 169 Malaysia Well Intervention Market by Country Forecast, 2021-2032 (US$ Mn, AGR%, CAGR%)
Table 170 Malaysia Well Intervention Market by Country Forecast, 2021-2032 (US$ Mn, AGR%, CAGR%)
Table 171 Malaysia Well Intervention Market by Country Forecast, 2021-2032 (US$ Mn, AGR%, CAGR%)
Table 172 Malaysia Well Intervention Market by Country Forecast, 2021-2032 (US$ Mn, AGR%, CAGR%)
Table 173 Malaysia Well Intervention Market by Country Forecast, 2021-2032 (US$ Mn, AGR%, CAGR%)
Table 174 Malaysia Well Intervention Market by Country Forecast, 2021-2032 (US$ Mn, AGR%, CAGR%)
Table 175 Thailand Well Intervention Market by Country Forecast, 2021-2032 (US$ Mn, AGR%, CAGR%)
Table 176 Thailand Well Intervention Market by Country Forecast, 2021-2032 (US$ Mn, AGR%, CAGR%)
Table 177 Thailand Well Intervention Market by Country Forecast, 2021-2032 (US$ Mn, AGR%, CAGR%)
Table 178 Thailand Well Intervention Market by Country Forecast, 2021-2032 (US$ Mn, AGR%, CAGR%)
Table 179 Rest of Asia Pacific Well Intervention Market by Country Forecast, 2021-2032 (US$ Mn, AGR%, CAGR%)
Table 180 Rest of Asia Pacific Well Intervention Market by Country Forecast, 2021-2032 (US$ Mn, AGR%, CAGR%)
Table 181 Rest of Asia Pacific Well Intervention Market by Country Forecast, 2021-2032 (US$ Mn, AGR%, CAGR%)
Table 182 Rest of Asia Pacific Well Intervention Market by Country Forecast, 2021-2032 (US$ Mn, AGR%, CAGR%)
Table 183 Rest of Asia Pacific Well Intervention Market by Country Forecast, 2021-2032 (US$ Mn, AGR%, CAGR%)
Table 184 Latin America Well Intervention Market by Country Forecast, 2021-2032 (US$ Mn, AGR%, CAGR%)
Table 185 Latin America Well Intervention Market by Service Type Forecast, 2021-2032 (US$ Mn, AGR%, CAGR%)
Table 186 Latin America Well Intervention Market by Service Type Forecast, 2021-2032 (US$ Mn, AGR%, CAGR%)
Table 187 Latin America Well Intervention Market by Service Type Forecast, 2021-2032 (US$ Mn, AGR%, CAGR%)
Table 188 Latin America Well Intervention Market by Service Type Forecast, 2021-2032 (US$ Mn, AGR%, CAGR%)
Table 189 Latin America Well Intervention Market by Service Type Forecast, 2021-2032 (US$ Mn, AGR%, CAGR%)
Table 190 Latin America Well Intervention Market by Well Type Forecast, 2021-2032 (US$ Mn, AGR%, CAGR%)
Table 191 Latin America Well Intervention Market by Well Type Forecast, 2021-2032 (US$ Mn, AGR%, CAGR%)
Table 192 Latin America Well Intervention Market by Well Type Forecast, 2021-2032 (US$ Mn, AGR%, CAGR%)
Table 193 Latin America Well Intervention Market by Well Type Forecast, 2021-2032 (US$ Mn, AGR%, CAGR%)
Table 194 Latin America Well Intervention Market by Well Type Forecast, 2021-2032 (US$ Mn, AGR%, CAGR%)
Table 195 Latin America Well Intervention Market by Application Forecast, 2021-2032 (US$ Mn, AGR%, CAGR%)
Table 196 Latin America Well Intervention Market by Application Forecast, 2021-2032 (US$ Mn, AGR%, CAGR%)
Table 197 Latin America Well Intervention Market by Application Forecast, 2021-2032 (US$ Mn, AGR%, CAGR%)
Table 198 Latin America Well Intervention Market by Application Forecast, 2021-2032 (US$ Mn, AGR%, CAGR%)
Table 199 Latin America Well Intervention Market by Application Forecast, 2021-2032 (US$ Mn, AGR%, CAGR%)
Table 200 Mexico Well Intervention Market by Country Forecast, 2021-2032 (US$ Mn, AGR%, CAGR%)
Table 201 Mexico Well Intervention Market by Country Forecast, 2021-2032 (US$ Mn, AGR%, CAGR%)
Table 202 Mexico Well Intervention Market by Country Forecast, 2021-2032 (US$ Mn, AGR%, CAGR%)
Table 203 Mexico Well Intervention Market by Country Forecast, 2021-2032 (US$ Mn, AGR%, CAGR%)
Table 204 Mexico Well Intervention Market by Country Forecast, 2021-2032 (US$ Mn, AGR%, CAGR%)
Table 205 Brazil Well Intervention Market by Country Forecast, 2021-2032 (US$ Mn, AGR%, CAGR%)
Table 206 Brazil Well Intervention Market by Country Forecast, 2021-2032 (US$ Mn, AGR%, CAGR%)
Table 207 Brazil Well Intervention Market by Country Forecast, 2021-2032 (US$ Mn, AGR%, CAGR%)
Table 208 Brazil Well Intervention Market by Country Forecast, 2021-2032 (US$ Mn, AGR%, CAGR%)
Table 209 Brazil Well Intervention Market by Country Forecast, 2021-2032 (US$ Mn, AGR%, CAGR%)
Table 210 Venezuela Well Intervention Market by Country Forecast, 2021-2032 (US$ Mn, AGR%, CAGR%)
Table 211 Venezuela Well Intervention Market by Country Forecast, 2021-2032 (US$ Mn, AGR%, CAGR%)
Table 212 Venezuela Well Intervention Market by Country Forecast, 2021-2032 (US$ Mn, AGR%, CAGR%)
Table 213 Venezuela Well Intervention Market by Country Forecast, 2021-2032 (US$ Mn, AGR%, CAGR%)
Table 214 Venezuela Well Intervention Market by Country Forecast, 2021-2032 (US$ Mn, AGR%, CAGR%)
Table 215 Argentina Well Intervention Market by Country Forecast, 2021-2032 (US$ Mn, AGR%, CAGR%)
Table 216 Argentina Well Intervention Market by Country Forecast, 2021-2032 (US$ Mn, AGR%, CAGR%)
Table 217 Argentina Well Intervention Market by Country Forecast, 2021-2032 (US$ Mn, AGR%, CAGR%)
Table 218 Argentina Well Intervention Market by Country Forecast, 2021-2032 (US$ Mn, AGR%, CAGR%)
Table 219 Argentina Well Intervention Market by Country Forecast, 2021-2032 (US$ Mn, AGR%, CAGR%)
Table 220 Rest of Latin America Well Intervention Market by Country Forecast, 2021-2032 (US$ Mn, AGR%, CAGR%)
Table 221 Rest of Latin America Well Intervention Market by Country Forecast, 2021-2032 (US$ Mn, AGR%, CAGR%)
Table 222 Rest of Latin America Well Intervention Market by Country Forecast, 2021-2032 (US$ Mn, AGR%, CAGR%)
Table 223 Rest of Latin America Well Intervention Market by Country Forecast, 2021-2032 (US$ Mn, AGR%, CAGR%)
Table 224 Rest of Latin America Well Intervention Market by Country Forecast, 2021-2032 (US$ Mn, AGR%, CAGR%)
Table 225 MEA Well Intervention Market by Country Forecast, 2021-2032 (US$ Mn, AGR%, CAGR%)
Table 226 MEA Well Intervention Market by Service Type Forecast, 2021-2032 (US$ Mn, AGR%, CAGR%)
Table 227 MEA Well Intervention Market by Service Type Forecast, 2021-2032 (US$ Mn, AGR%, CAGR%)
Table 228 MEA Well Intervention Market by Service Type Forecast, 2021-2032 (US$ Mn, AGR%, CAGR%)
Table 229 MEA Well Intervention Market by Service Type Forecast, 2021-2032 (US$ Mn, AGR%, CAGR%)
Table 230 MEA Well Intervention Market by Service Type Forecast, 2021-2032 (US$ Mn, AGR%, CAGR%)
Table 231 MEA Well Intervention Market by Well Type Forecast, 2021-2032 (US$ Mn, AGR%, CAGR%)
Table 232 MEA Well Intervention Market by Well Type Forecast, 2021-2032 (US$ Mn, AGR%, CAGR%)
Table 233 MEA Well Intervention Market by Well Type Forecast, 2021-2032 (US$ Mn, AGR%, CAGR%)
Table 234 MEA Well Intervention Market by Well Type Forecast, 2021-2032 (US$ Mn, AGR%, CAGR%)
Table 235 MEA Well Intervention Market by Well Type Forecast, 2021-2032 (US$ Mn, AGR%, CAGR%)
Table 236 MEA Well Intervention Market by Application Forecast, 2021-2032 (US$ Mn, AGR%, CAGR%)
Table 237 MEA Well Intervention Market by Application Forecast, 2021-2032 (US$ Mn, AGR%, CAGR%)
Table 238 MEA Well Intervention Market by Application Forecast, 2021-2032 (US$ Mn, AGR%, CAGR%)
Table 239 MEA Well Intervention Market by Application Forecast, 2021-2032 (US$ Mn, AGR%, CAGR%)
Table 240 Middle East & Africa Well Intervention Market by Application Forecast, 2021-2032(US$ Mn, AGR%, CAGR%)
Table 241 GCC Well Intervention Market by Country Forecast, 2021-2032 (US$ Mn, AGR%, CAGR%)
Table 242 GCC Well Intervention Market by Country Forecast, 2021-2032 (US$ Mn, AGR%, CAGR%)
Table 243 GCC Well Intervention Market by Country Forecast, 2021-2032 (US$ Mn, AGR%, CAGR%)
Table 244 GCC Well Intervention Market by Country Forecast, 2021-2032 (US$ Mn, AGR%, CAGR%)
Table 245 GCC Well Intervention Market by Country Forecast, 2021-2032 (US$ Mn, AGR%, CAGR%)
Table 246 Iraq Well Intervention Market by Country Forecast, 2021-2032 (US$ Mn, AGR%, CAGR%)
Table 247 Iraq Well Intervention Market by Country Forecast, 2021-2032 (US$ Mn, AGR%, CAGR%)
Table 248 Iraq Well Intervention Market by Country Forecast, 2021-2032 (US$ Mn, AGR%, CAGR%)
Table 249 Iraq Well Intervention Market by Country Forecast, 2021-2032 (US$ Mn, AGR%, CAGR%)
Table 250 Iraq Well Intervention Market by Country Forecast, 2021-2032 (US$ Mn, AGR%, CAGR%)
Table 251 Nigeria Well Intervention Market by Country Forecast, 2021-2032 (US$ Mn, AGR%, CAGR%)
Table 252 Nigeria Well Intervention Market by Country Forecast, 2021-2032 (US$ Mn, AGR%, CAGR%)
Table 253 Nigeria Well Intervention Market by Country Forecast, 2021-2032 (US$ Mn, AGR%, CAGR%)
Table 254 Nigeria Well Intervention Market by Country Forecast, 2021-2032 (US$ Mn, AGR%, CAGR%)
Table 255 Nigeria Well Intervention Market by Country Forecast, 2021-2032 (US$ Mn, AGR%, CAGR%)
Table 256 Angola Well Intervention Market by Country Forecast, 2021-2032 (US$ Mn, AGR%, CAGR%)
Table 257 Angola Well Intervention Market by Country Forecast, 2021-2032 (US$ Mn, AGR%, CAGR%)
Table 258 Angola Well Intervention Market by Country Forecast, 2021-2032 (US$ Mn, AGR%, CAGR%)
Table 259 Angola Well Intervention Market by Country Forecast, 2021-2032 (US$ Mn, AGR%, CAGR%)
Table 260 Angola Well Intervention Market by Country Forecast, 2021-2032 (US$ Mn, AGR%, CAGR%)
Table 261 Rest of Middle East & Africa Well Intervention Market by Country Forecast, 2021-2032 (US$ Mn, AGR%, CAGR%)
Table 262 Rest of Middle East & Africa Well Intervention Market by Country Forecast, 2021-2032 (US$ Mn, AGR%, CAGR%)
Table 263 Rest of Middle East & Africa Well Intervention Market by Country Forecast, 2021-2032 (US$ Mn, AGR%, CAGR%)
Table 264 Rest of Middle East & Africa Well Intervention Market by Country Forecast, 2021-2032 (US$ Mn, AGR%, CAGR%)
Table 265 Rest of Middle East & Africa Well Intervention Market by Country Forecast, 2021-2032 (US$ Mn, AGR%, CAGR%)
Table 266 Global Well Intervention Market Recent Developments, 2017-2020
Table 267 Halliburton: Key Details, (CEO, HQ, Revenue, Founded, No. of Employees, Company Type, Website, Business Segment)
Table 268 Halliburton: Product Benchmarking
Table 269 Global Well Intervention Market Recent Developments, 2017-2020
Table 270 Schlumberger: Key Details, (CEO, HQ, Revenue, Founded, No. of Employees, Company Type, Website, Business Segment)
Table 271 Schlumberger: Product Benchmarking
Table 272 Global Well Intervention Market Recent Developments, 2017-2020
Table 273 Baker Hughes: Key Details, (CEO, HQ, Revenue, Founded, No. of Employees, Company Type, Website, Business Segment)
Table 274 Baker Hughes: Product Benchmarking
Table 275 Global Well Intervention Market Recent Developments, 2017-2020
Table 276 Weatherford International: Key Details, (CEO, HQ, Revenue, Founded, No. of Employees, Company Type, Website, Business Segment)
Table 277 Weatherford International: Product Benchmarking
Table 278 Global Well Intervention Market Recent Developments, 2017-2020
Table 279 NexTier Oilfield Solutions: Key Details, (CEO, HQ, Revenue, Founded, No. of Employees, Company Type, Website, Business Segment)
Table 280 NexTier Oilfield Solutions: Product Benchmarking
Table 281 Global Well Intervention Market Recent Developments, 2017-2020
Table 282 Archer: Key Details, (CEO, HQ, Revenue, Founded, No. of Employees, Company Type, Website, Business Segment)
Table 283 Archer: Product Benchmarking
Table 284 Global Well Intervention Market Recent Developments, 2017-2020
Table 285 Expro Group: Key Details, (CEO, HQ, Revenue, Founded, No. of Employees, Company Type, Website, Business Segment)
Table 286 Expro Group: Product Benchmarking
Table 287 Global Well Intervention Market Recent Developments, 2017-2020
Table 288 Trican Well Service: Key Details, (CEO, HQ, Revenue, Founded, No. of Employees, Company Type, Website, Business Segment)
Table 289 Trican Well Services: Product Benchmarking
Table 290 Global Well Intervention Market Recent Developments, 2017-2020
Table 291 Pioneer Energy Services: Key Details, (CEO, HQ, Revenue, Founded, No. of Employees, Company Type, Website, Business Segment)
Table 292 Pioneer Energy Services: Product Benchmarking
Table 293 Basic Energy Services: Key Details, (CEO, HQ, Revenue, Founded, No. of Employees, Company Type, Website, Business Segment)
Table 294 Basic Energy Services: Product Benchmarking
Table 295 Global Well Intervention Market Recent Developments, 2017-2020
Table 296 Nine Energy Services: Key Details, (CEO, HQ, Revenue, Founded, No. of Employees, Company Type, Website, Business Segment)
Table 297 Nine Energy Services: Product Benchmarking
Table 298 Global Well Intervention Market Recent Developments, 2017-2020
Table 299 Key Energy Services: Key Details, (CEO, HQ, Revenue, Founded, No. of Employees, Company Type, Website, Business Segment)
Table 300 Key Energy Services: Product Benchmarking
Table 301 Altus Intervention: Key Details, (CEO, HQ, Revenue, Founded, No. of Employees, Company Type, Website, Business Segment)
Table 302 Altus Intervention: Product Benchmarking
Table 303 Global Well Intervention Market Recent Developments, 2017-2020
Table 304 Welltec: Key Details, (CEO, HQ, Revenue, Founded, No. of Employees, Company Type, Website, Business Segment)
Table 305 Welltec: Product Benchmarking
Table 306 Oceaneering International: Key Details, (CEO, HQ, Revenue, Founded, No. of Employees, Company Type, Website, Business Segment)
Table 307 Oceaneering International: Product Benchmarking
Table 308 Global Well Intervention Market Recent Developments, 2017-2020
List of Figures
Figure 1 Global Well Intervention Market Segmentation
Figure 2 Global Well Intervention Market: Market Dynamics
Figure 3 Peak oil loss from mature oilfields (2010 – 2018)
Figure 4 Oil Demand in Global Market (2016 – 2020)
Figure 5 Upstream Capital Spending in Global Oil & Gas Market (2010 – 2020)
Figure 6 Global Well Intervention Market: SWOT Analysis
Figure 7 Global Well Intervention Market: Porter’s Five Forces Analysis
Figure 8 Global Well Intervention Market: PEST Analysis
Figure 9 Global Well Intervention Market Forecast by Service Type, 2021-2032 (US$ million, AGR %)
Figure 10 Global Well Intervention Market Share Forecast by Service Type, 2021, 2026, 2032 (%)
Figure 11 Global Well Intervention Market for Logging and Bottomhole Survey Segment: Revenue Forecast 2021-2032 (US$ million, AGR%)
Figure 12 Global Well Intervention Market for Logging and Bottomhole Survey Segment, Revenue Forecast 2021-2032 (US$ million, AGR%): “V” Shaped Recovery
Figure 13 Global Well Intervention Market for Logging and Bottomhole Survey Segment, Revenue Forecast 2021-2032 (US$ million, AGR%): “U” Shaped Recovery
Figure 14 Global Well Intervention Market for Logging and Bottomhole Survey Segment, Revenue Forecast 2021-2032 (US$ million, AGR%): “W” Shaped Recovery
Figure 15 Global Well Intervention Market for Logging and Bottomhole Survey Segment, Revenue Forecast 2021-2032 (US$ million, AGR%): “L” Shaped Recovery
Figure 16 Global Well Intervention Market for Stimulation Segment: Revenue Forecast 2021-2032 (US$ million, AGR%)
Figure 17 Global Well Intervention Market for Stimulation Segment, Revenue Forecast 2021-2032 (US$ million, AGR%): “V” Shaped Recovery
Figure 18 Global Well Intervention Market for Stimulation Segment, Revenue Forecast 2021-2032 (US$ million, AGR%): “U” Shaped Recovery
Figure 19 Global Well Intervention Market for Stimulation Segment, Revenue Forecast 2021-2032 (US$ million, AGR%): “W” Shaped Recovery
Figure 20 Global Well Intervention Market for Stimulation Segment, Revenue Forecast 2021-2032 (US$ million, AGR%): “L” Shaped Recovery
Figure 21 Global Well Intervention Market for Tubing/Packer Failure and Repair Segment: Revenue Forecast 2021-2032 (US$ million, AGR%)
Figure 22 Global Well Intervention Market for Tubing/Packer Failure and Repair Segment, Revenue Forecast 2021-2032 (US$ million, AGR%): “V” Shaped Recovery
Figure 23 Global Well Intervention Market for Tubing/Packer Failure and Repair Segment, Revenue Forecast 2021-2032 (US$ million, AGR%): “U” Shaped Recovery
Figure 24 Global Well Intervention Market for Tubing/Packer Failure and Repair Segment, Revenue Forecast 2021-2032 (US$ million, AGR%): “W” Shaped Recovery
Figure 25 Global Well Intervention Market for Tubing/Packer Failure and Repair Segment, Revenue Forecast 2021-2032 (US$ million, AGR%): “L” Shaped Recovery
Figure 26 Global Well Intervention Market for Remedial Cementing Segment: Revenue Forecast 2021-2032 (US$ million, AGR%)
Figure 27 Global Well Intervention Market for Remedial Cementing Segment, Revenue Forecast 2021-2032 (US$ million, AGR%): “V” Shaped Recovery
Figure 28 Global Well Intervention Market for Remedial Cementing Segment, Revenue Forecast 2021-2032 (US$ million, AGR%): “U” Shaped Recovery
Figure 29 Global Well Intervention Market for Remedial Cementing Segment, Revenue Forecast 2021-2032 (US$ million, AGR%): “W” Shaped Recovery
Figure 30 Global Well Intervention Market for Remedial Cementing Segment, Revenue Forecast 2021-2032 (US$ million, AGR%): “L” Shaped Recovery
Figure 31 Global Well Intervention Market for Sand Control Segment: Revenue Forecast 2021-2032 (US$ million, AGR%)
Figure 32 Global Well Intervention Market for Sand Control Segment, Revenue Forecast 2021-2032 (US$ million, AGR%): “V” Shaped Recovery
Figure 33 Global Well Intervention Market for Sand Control Segment, Revenue Forecast 2021-2032 (US$ million, AGR%): “U” Shaped Recovery
Figure 34 Global Well Intervention Market for Sand Control Segment, Revenue Forecast 2021-2032 (US$ million, AGR%): “W” Shaped Recovery
Figure 35 Global Well Intervention Market for Sand Control Segment, Revenue Forecast 2021-2032 (US$ million, AGR%): “L” Shaped Recovery
Figure 36 Global Well Intervention Market for Zonal Isolation Segment: Revenue Forecast 2021-2032 (US$ million, AGR%)
Figure 37 Global Well Intervention Market for Zonal Isolation Segment, Revenue Forecast 2021-2032 (US$ million, AGR%): “V” Shaped Recovery
Figure 38 Global Well Intervention Market for Zonal Isolation Segment, Revenue Forecast 2021-2032 (US$ million, AGR%): “U” Shaped Recovery
Figure 39 Global Well Intervention Market for Zonal Isolation Segment, Revenue Forecast 2021-2032 (US$ million, AGR%): “W” Shaped Recovery
Figure 40 Global Well Intervention Market for Zonal Isolation Segment, Revenue Forecast 2021-2032 (US$ million, AGR%): “L” Shaped Recovery
Figure 41 Global Well Intervention Market for Others Segment: Revenue Forecast 2021-2032 (US$ million, AGR%)
Figure 42 Global Well Intervention Market for Others Segment, Revenue Forecast 2021-2032 (US$ million, AGR%): “V” Shaped Recovery
Figure 43 Global Well Intervention Market for Others Segment, Revenue Forecast 2021-2032 (US$ million, AGR%): “U” Shaped Recovery
Figure 44 Global Well Intervention Market for Others Segment, Revenue Forecast 2021-2032 (US$ million, AGR%): “W” Shaped Recovery
Figure 45 Global Well Intervention Market for Others Segment, Revenue Forecast 2021-2032 (US$ million, AGR%): “L” Shaped Recovery
Figure 46 Global Well Intervention Market Forecast by Well Type, 2021-2032 (US$ billion, AGR %)
Figure 47 Global Well Intervention Market Share Forecast by Well Type, 2021, 2026, 2032 (%)
Figure 48 Global Well Intervention Market for Horizontal Segment: Revenue Forecast 2021-2032 (US$ million, AGR%)
Figure 49 Global Well Intervention Market for Horizontal Segment, Revenue Forecast 2021-2032 (US$ million, AGR%): “V” Shaped Recovery
Figure 50 Global Well Intervention Market for Horizontal Segment, Revenue Forecast 2021-2032 (US$ million, AGR%): “U” Shaped Recovery
Figure 51 Global Well Intervention Market for Horizontal Segment, Revenue Forecast 2021-2032 (US$ million, AGR%): “W” Shaped Recovery
Figure 52 Global Well Intervention Market for Horizontal Segment, Revenue Forecast 2021-2032 (US$ million, AGR%): “L” Shaped Recovery
Figure 53 Global Well Intervention Market for Vertical Segment: Revenue Forecast 2021-2032 (US$ million, AGR%)
Figure 54 Global Well Intervention Market for Vertical Segment, Revenue Forecast 2021-2032 (US$ million, AGR%): “V” Shaped Recovery
Figure 55 Global Well Intervention Market for Vertical Segment, Revenue Forecast 2021-2032 (US$ million, AGR%): “U” Shaped Recovery
Figure 56 Global Well Intervention Market for Vertical Segment, Revenue Forecast 2021-2032 (US$ million, AGR%): “W” Shaped Recovery
Figure 57 Global Well Intervention Market for Vertical Segment, Revenue Forecast 2021-2032 (US$ million, AGR%): “L” Shaped Recovery
Figure 58 Global Well Intervention Market Forecast by Service Type, 2021-2032 (US$ billion, AGR %)
Figure 59 Global Well Intervention Market Share Forecast by Service Type, 2021, 2026, 2032 (%)
Figure 60 Global Well Intervention Market for Onshore Segment: Revenue Forecast 2021-2032 (US$ million, AGR%)
Figure 61 Global Well Intervention Market for Onshore Segment, Revenue Forecast 2021-2032 (US$ million, AGR%): “V” Shaped Recovery
Figure 62 Global Well Intervention Market for Onshore Segment, Revenue Forecast 2021-2032 (US$ million, AGR%): “U” Shaped Recovery
Figure 63 Global Well Intervention Market for Onshore Segment, Revenue Forecast 2021-2032 (US$ million, AGR%): “W” Shaped Recovery
Figure 64 Global Well Intervention Market for Onshore Segment, Revenue Forecast 2021-2032 (US$ million, AGR%): “L” Shaped Recovery
Figure 65 Global Well Intervention Market for Offshore Segment: Revenue Forecast 2021-2032 (US$ million, AGR%)
Figure 66 Global Well Intervention Market for Offshore Segment, Revenue Forecast 2021-2032 (US$ million, AGR%): “V” Shaped Recovery
Figure 67 Global Well Intervention Market for Offshore Segment, Revenue Forecast 2021-2032 (US$ million, AGR%): “U” Shaped Recovery
Figure 68 Global Well Intervention Market for Offshore Segment, Revenue Forecast 2021-2032 (US$ million, AGR%): “W” Shaped Recovery
Figure 69 Global Well Intervention Market for Offshore Segment, Revenue Forecast 2021-2032 (US$ million, AGR%): “L” Shaped Recovery
Figure 70 Global Well Intervention Market Forecast by Region 2021-2032 (US$ million)
Figure 71 Global Well Intervention Market Share Forecast by Region 2021, 2026, 2032 (%)
Figure 72 Global Well Intervention Market Forecast, 2021-2032 (US$ MILLION, AGR%): “V” Shaped Recovery
Figure 73 Global Well Intervention Market Forecast, 2021-2032 (US$ million, AGR%): “U” Shaped Recovery
Figure 74 Global Well Intervention Market Forecast, 2021-2032 (US$ million, AGR%): “W” Shaped Recovery
Figure 75 Global Well Intervention Market Forecast, 2021-2032 (US$ million, AGR%): “L” Shaped Recovery
Figure 76 North America Well Intervention Market Forecast by Country 2021-2032 (US$ million)
Figure 77 North America Well Intervention Market Share Forecast by Country 2021, 2026, 2032 (%)
Figure 78 North America Well Intervention Market Forecast by Service Type, 2021-2032 (US$ million, AGR%)
Figure 79 North America Well Intervention Market Forecast by Service Type, 2021-2032 (US$ million, AGR%): “V” Shaped Recovery
Figure 80 North America Well Intervention Market Forecast by Service Type, 2021-2032 (US$ million, AGR%): “U” Shaped Recovery
Figure 81 North America Well Intervention Market Forecast by Service Type, 2021-2032 (US$ million, AGR%): “W” Shaped Recovery
Figure 82 North America Well Intervention Market Forecast by Service Type, 2021-2032 (US$ million, AGR%): “L” Shaped Recovery
Figure 83 North America Well Intervention Market Forecast by Well Type, 2021-2032 (US$ million, AGR%)
Figure 84 North America Well Intervention Market Forecast by Well Type, 2021-2032 (US$ million, AGR%): “V” Shaped Recovery
Figure 85 North America Well Intervention Market Forecast by Well Type, 2021-2032 (US$ million, AGR%): “U” Shaped Recovery
Figure 86 North America Well Intervention Market Forecast by Well Type, 2021-2032 (US$ million, AGR%): “W” Shaped Recovery
Figure 87 North America Well Intervention Market Forecast by Well Type, 2021-2032 (US$ million, AGR%): “L” Shaped Recovery
Figure 88 North America Well Intervention Market Forecast by Application, 2021-2032 (US$ million, AGR%)
Figure 89 North America Well Intervention Market Forecast by Application, 2021-2032 (US$ million, AGR%): “V” Shaped Recovery
Figure 90 North America Well Intervention Market Forecast by Application, 2021-2032 (US$ million, AGR%): “U” Shaped Recovery
Figure 91 North America Well Intervention Market Forecast by Application, 2021-2032 (US$ million, AGR%): “W” Shaped Recovery
Figure 92 North America Well Intervention Market Forecast by Application, 2021-2032 (US$ million, AGR%): “L” Shaped Recovery
Figure 93 U.S. Well Intervention Market Forecast, 2021-2032 (US$ billion, AGR %)
Figure 94 U.S. Well Intervention Market Forecast, 2021-2032 (US$ million, AGR%): “V” Shaped Recovery
Figure 95 U.S. Well Intervention Market Forecast, 2021-2032 (US$ million, AGR%): “U” Shaped Recovery
Figure 96 U.S. Well Intervention Market Forecast, 2021-2032 (US$ million, AGR%): “W” Shaped Recovery
Figure 97 U.S. Well Intervention Market Forecast, 2021-2032 (US$ million, AGR%): “L” Shaped Recovery
Figure 98 Canada Well Intervention Market Forecast, 2021-2032 (US$ billion, AGR %)
Figure 99 Canada Well Intervention Market Forecast, 2021-2032 (US$ million, AGR%): “V” Shaped Recovery
Figure 100 Canada Well Intervention Market Forecast, 2021-2032 (US$ million, AGR%): “U” Shaped Recovery
Figure 101 Canada Well Intervention Market Forecast, 2021-2032 (US$ million, AGR%): “W” Shaped Recovery
Figure 102 Canada Well Intervention Market Forecast, 2021-2032 (US$ million, AGR%): “L” Shaped Recovery
Figure 103 Europe Well Intervention Market Forecast by Country 2021-2032 (US$ million)
Figure 104 Europe Well Intervention Market Share Forecast by Country 2021, 2026, 2032 (%)
Figure 105 Europe Well Intervention Market Forecast by Service Type, 2021-2032 (US$ million, AGR%)
Figure 106 Europe Well Intervention Market Forecast by Service Type, 2021-2032 (US$ million, AGR%): “V” Shaped Recovery
Figure 107 Europe Well Intervention Market Forecast by Service Type, 2021-2032 (US$ million, AGR%): “U” Shaped Recovery
Figure 108 Europe Well Intervention Market Forecast by Service Type, 2021-2032 (US$ million, AGR%): “W” Shaped Recovery
Figure 109 Europe Well Intervention Market Forecast by Service Type, 2021-2032 (US$ million, AGR%): “L” Shaped Recovery
Figure 110 Europe Well Intervention Market Forecast by Well Type, 2021-2032 (US$ million, AGR%)
Figure 111 Europe Well Intervention Market Forecast by Well Type, 2021-2032 (US$ million, AGR%): “V” Shaped Recovery
Figure 112 Europe Well Intervention Market Forecast by Well Type, 2021-2032 (US$ million, AGR%): “U” Shaped Recovery
Figure 113 Europe Well Intervention Market Forecast by Well Type, 2021-2032 (US$ million, AGR%): “W” Shaped Recovery
Figure 114 Europe Well Intervention Market Forecast by Well Type, 2021-2032 (US$ million, AGR%): “L” Shaped Recovery
Figure 115 Europe Well Intervention Market Forecast by Application, 2021-2032 (US$ million, AGR%)
Figure 116 Europe Well Intervention Market Forecast by Application, 2021-2032 (US$ million, AGR%): “V” Shaped Recovery
Figure 117 Europe Well Intervention Market Forecast by Application, 2021-2032 (US$ million, AGR%): “U” Shaped Recovery
Figure 118 Europe Well Intervention Market Forecast by Application, 2021-2032 (US$ million, AGR%): “W” Shaped Recovery
Figure 119 Europe Well Intervention Market Forecast by Application, 2021-2032 (US$ million, AGR%): “L” Shaped Recovery
Figure 120 Russia Well Intervention Market Forecast, 2021-2032 (US$ million, AGR %)
Figure 121 Russia Well Intervention Market Forecast, 2021-2032 (US$ million, AGR%): “V” Shaped Recovery
Figure 122 Russia Well Intervention Market Forecast, 2021-2032 (US$ million, AGR%): “U” Shaped Recovery
Figure 123 Russia Well Intervention Market Forecast, 2021-2032 (US$ million, AGR%): “W” Shaped Recovery
Figure 124 Russia Well Intervention Market Forecast, 2021-2032 (US$ million, AGR%): “L” Shaped Recovery
Figure 125 UK Well Intervention Market Forecast, 2021-2032 (US$ billion, AGR %)
Figure 126 UK Well Intervention Market Forecast, 2021-2032 (US$ million, AGR%): “V” Shaped Recovery
Figure 127 UK Well Intervention Market Forecast, 2021-2032 (US$ million, AGR%): “U” Shaped Recovery
Figure 128 UK Well Intervention Market Forecast, 2021-2032 (US$ million, AGR%): “W” Shaped Recovery
Figure 129 UK Well Intervention Market Forecast, 2021-2032 (US$ million, AGR%): “L” Shaped Recovery
Figure 130 Norway Well Intervention Market Forecast, 2021-2032 (US$ billion, AGR %)
Figure 131 NORWAY Well Intervention Market Forecast, 2021-2032 (US$ million, AGR%): “V” Shaped Recovery
Figure 132 Norway Well Intervention Market Forecast, 2021-2032 (US$ million, AGR%): “U” Shaped Recovery
Figure 133 Norway Well Intervention Market Forecast, 2021-2032 (US$ million, AGR%): “W” Shaped Recovery
Figure 134 NORWAY Well Intervention Market Forecast, 2021-2032 (US$ million, AGR%): “L” Shaped Recovery
Figure 135 Denmark Well Intervention Market Forecast, 2021-2032 (US$ billion, AGR %)
Figure 136 DENMARK Well Intervention Market Forecast, 2021-2032 (US$ million, AGR%): “V” Shaped Recovery
Figure 137 Denmark Well Intervention Market Forecast, 2021-2032 (US$ million, AGR%): “U” Shaped Recovery
Figure 138 Denmark Well Intervention Market Forecast, 2021-2032 (US$ million, AGR%): “W” Shaped Recovery
Figure 139 Denmark Well Intervention Market Forecast, 2021-2032 (US$ million, AGR%): “L” Shaped Recovery
Figure 140 Italy Well Intervention Market Forecast, 2021-2032 (US$ billion, AGR %)
Figure 141 ITALY Well Intervention Market Forecast, 2021-2032 (US$ million, AGR%): “V” Shaped Recovery
Figure 142 Italy Well Intervention Market Forecast, 2021-2032 (US$ million, AGR%): “U” Shaped Recovery
Figure 143 Italy Well Intervention Market Forecast, 2021-2032 (US$ million, AGR%): “W” Shaped Recovery
Figure 144 ITALY Well Intervention Market Forecast, 2021-2032 (US$ million, AGR%): “L” Shaped Recovery
Figure 145 Germany Well Intervention Market Forecast, 2021-2032 (US$ billion, AGR %)
Figure 146 GERMANY Well Intervention Market Forecast, 2021-2032 (US$ million, AGR%): “V” Shaped Recovery
Figure 147 Germany Well Intervention Market Forecast, 2021-2032 (US$ million, AGR%): “U” Shaped Recovery
Figure 148 Germany Well Intervention Market Forecast, 2021-2032 (US$ million, AGR%): “W” Shaped Recovery
Figure 149 Germany Well Intervention Market Forecast, 2021-2032 (US$ million, AGR%): “L” Shaped Recovery
Figure 150 Rest of Europe Well Intervention Market Forecast, 2021-2032 (US$ billion, AGR %)
Figure 151 REST OF EUROPE Well Intervention Market Forecast, 2021-2032 (US$ million, AGR%): “V” Shaped Recovery
Figure 152 Rest of Europe Well Intervention Market Forecast, 2021-2032 (US$ million, AGR%): “U” Shaped Recovery
Figure 153 Rest of Europe Well Intervention Market Forecast, 2021-2032 (US$ million, AGR%): “W” Shaped Recovery
Figure 154 REST OF EUROPE Well Intervention Market Forecast, 2021-2032 (US$ million, AGR%): “L” Shaped Recovery
Figure 155 Asia Pacific Well Intervention Market Forecast by Country 2021-2032 (US$ million)
Figure 156 Asia Pacific Well Intervention Market Share Forecast by Country 2021, 2026, 2032 (%)
Figure 157 Asia Pacific Well Intervention Market Forecast by Service Type, 2021-2032 (US$ million, AGR%)
Figure 158 Asia Pacific Well Intervention Market Forecast by Service Type, 2021-2032 (US$ million, AGR%): “V” Shaped Recovery
Figure 159 Asia Pacific Well Intervention Market Forecast by Service Type, 2021-2032 (US$ million, AGR%): “U” Shaped Recovery
Figure 160 Asia Pacific Well Intervention Market Forecast by Service Type, 2021-2032 (US$ million, AGR%): “W” Shaped Recovery
Figure 161 Asia Pacific Well Intervention Market Forecast by Service Type, 2021-2032 (US$ million, AGR%): “L” Shaped Recovery
Figure 162 Asia Pacific Well Intervention Market Forecast by Well Type, 2021-2032 (US$ million, AGR%)
Figure 163 Asia Pacific Well Intervention Market Forecast by Well Type, 2021-2032 (US$ million, AGR%): “V” Shaped Recovery
Figure 164 Asia Pacific Well Intervention Market Forecast by Well Type, 2021-2032 (US$ million, AGR%): “U” Shaped Recovery
Figure 165 Asia Pacific Well Intervention Market Forecast by Well Type, 2021-2032 (US$ million, AGR%): “W” Shaped Recovery
Figure 166 Asia Pacific Well Intervention Market Forecast by Well Type, 2021-2032 (US$ million, AGR%): “L” Shaped Recovery
Figure 167 Asia Pacific Well Intervention Market Forecast by Application, 2021-2032 (US$ million, AGR%)
Figure 168 Asia Pacific Well Intervention Market Forecast by Application, 2021-2032 (US$ million, AGR%): “V” Shaped Recovery
Figure 169 Asia Pacific Well Intervention Market Forecast by Application, 2021-2032 (US$ million, AGR%): “U” Shaped Recovery
Figure 170 Asia Pacific Well Intervention Market Forecast by Application, 2021-2032 (US$ million, AGR%): “W” Shaped Recovery
Figure 171 Asia Pacific Well Intervention Market Forecast by Application, 2021-2032 (US$ million, AGR%): “L” Shaped Recovery
Figure 172 China Well Intervention Market Forecast, 2021-2032 (US$ billion, AGR %)
Figure 173 CHINA Well Intervention Market Forecast, 2021-2032 (US$ million, AGR%): “V” Shaped Recovery
Figure 174 China Well Intervention Market Forecast, 2021-2032 (US$ million, AGR%): “U” Shaped Recovery
Figure 175 China Well Intervention Market Forecast, 2021-2032 (US$ million, AGR%): “W” Shaped Recovery
Figure 176 CHINA Well Intervention Market Forecast, 2021-2032 (US$ million, AGR%): “L” Shaped Recovery
Figure 177 India Well Intervention Market Forecast, 2021-2032 (US$ billion, AGR %)
Figure 178 INDIA Well Intervention Market Forecast, 2021-2032 (US$ million, AGR%): “V” Shaped Recovery
Figure 179 India Well Intervention Market Forecast, 2021-2032 (US$ million, AGR%): “U” Shaped Recovery
Figure 180 India Well Intervention Market Forecast, 2021-2032 (US$ million, AGR%): “W” Shaped Recovery
Figure 181 INDIA Well Intervention Market Forecast, 2021-2032 (US$ million, AGR%): “L” Shaped Recovery
Figure 182 Australia Well Intervention Market Forecast, 2021-2032 (US$ billion, AGR %)
Figure 183 AUSTRALIA Well Intervention Market Forecast, 2021-2032 (US$ million, AGR%): “V” Shaped Recovery
Figure 184 Australia Well Intervention Market Forecast, 2021-2032 (US$ million, AGR%): “U” Shaped Recovery
Figure 185 Australia Well Intervention Market Forecast, 2021-2032 (US$ million, AGR%): “W” Shaped Recovery
Figure 186 AUSTRALIA Well Intervention Market Forecast, 2021-2032 (US$ million, AGR%): “L” Shaped Recovery
Figure 187 Indonesia Well Intervention Market Forecast, 2021-2032 (US$ billion, AGR %)
Figure 188 INDONESIA Well Intervention Market Forecast, 2021-2032 (US$ million, AGR%): “V” Shaped Recovery
Figure 189 Indonesia Well Intervention Market Forecast, 2021-2032 (US$ million, AGR%): “U” Shaped Recovery
Figure 190 Indonesia Well Intervention Market Forecast, 2021-2032 (US$ million, AGR%): “W” Shaped Recovery
Figure 191 INDONESIA Well Intervention Market Forecast, 2021-2032 (US$ million, AGR%): “L” Shaped Recovery
Figure 192 Malaysia Well Intervention Market Forecast, 2021-2032 (US$ billion, AGR %)
Figure 193 Malaysia Well Intervention Market Forecast, 2021-2032 (US$ million, AGR%): “V” Shaped Recovery
Figure 194 Malaysia Well Intervention Market Forecast, 2021-2032 (US$ million, AGR%): “U” Shaped Recovery
Figure 195 Malaysia Well Intervention Market Forecast, 2021-2032 (US$ million, AGR%): “W” Shaped Recovery
Figure 196 Malaysia Well Intervention Market Forecast, 2021-2032 (US$ million, AGR%): “L” Shaped Recovery
Figure 197 Thailand Well Intervention Market Forecast, 2021-2032 (US$ billion, AGR %)
Figure 198 Thailand Well Intervention Market Forecast, 2021-2032 (US$ million, AGR%): “V” Shaped Recovery
Figure 199 Thailand Well Intervention Market Forecast, 2021-2032 (US$ million, AGR%): “U” Shaped Recovery
Figure 200 Thailand Well Intervention Market Forecast, 2021-2032 (US$ million, AGR%): “W” Shaped Recovery
Figure 201 Thailand Well Intervention Market Forecast, 2021-2032 (US$ million, AGR%): “L” Shaped Recovery
Figure 202 Rest of Asia Pacific Well Intervention Market Forecast, 2021-2032 (US$ billion, AGR %)
Figure 203 REST OF ASIA PACIFIC Well Intervention Market Forecast, 2021-2032 (US$ million, AGR%): “V” Shaped Recovery
Figure 204 Rest of Asia Pacific Well Intervention Market Forecast, 2021-2032 (US$ million, AGR%): “U” Shaped Recovery
Figure 205 Rest of Asia Pacific Well Intervention Market Forecast, 2021-2032 (US$ million, AGR%): “W” Shaped Recovery
Figure 206 Rest Of Asia Pacific Well Intervention Market Forecast, 2021-2032 (US$ million, AGR%): “L” Shaped Recovery
Figure 207 Latin America Well Intervention Market Forecast by Country 2021-2032 (US$ billion)
Figure 208 Latin America Well Intervention Market Share Forecast by Country 2021, 2026, 2032 (%)
Figure 209 Latin America Well Intervention Market Forecast by Service Type, 2021-2032 (US$ million, AGR%)
Figure 210 Latin America Well Intervention Market Forecast by Service Type, 2021-2032 (US$ million, AGR%): “V” Shaped Recovery
Figure 211 Latin America Well Intervention Market Forecast by Service Type, 2021-2032 (US$ million, AGR%): “U” Shaped Recovery
Figure 212 Latin America Well Intervention Market Forecast by Service Type, 2021-2032 (US$ million, AGR%): “W” Shaped Recovery
Figure 213 Latin America Well Intervention Market Forecast by Service Type, 2021-2032 (US$ million, AGR%): “L” Shaped Recovery
Figure 214 Latin America Well Intervention Market Forecast by Well Type, 2021-2032 (US$ million, AGR%)
Figure 215 Latin America Well Intervention Market Forecast by Well Type, 2021-2032 (US$ million, AGR%): “V” Shaped Recovery
Figure 216 Latin America Well Intervention Market Forecast by Well Type, 2021-2032 (US$ million, AGR%): “U” Shaped Recovery
Figure 217 Latin America Well Intervention Market Forecast by Well Type, 2021-2032 (US$ million, AGR%): “W” Shaped Recovery
Figure 218 Latin America Well Intervention Market Forecast by Well Type, 2021-2032 (US$ million, AGR%): “L” Shaped Recovery
Figure 219 Latin America Well Intervention Market Forecast by Application, 2021-2032 (US$ million, AGR%)
Figure 220 Latin America Well Intervention Market Forecast by Application, 2021-2032 (US$ million, AGR%): “V” Shaped Recovery
Figure 221 Latin America Well Intervention Market Forecast by Application, 2021-2032 (US$ million, AGR%): “U” Shaped Recovery
Figure 222 Latin America Well Intervention Market Forecast by Application, 2021-2032 (US$ million, AGR%): “W” Shaped Recovery
Figure 223 Latin America Well Intervention Market Forecast by Application, 2021-2032 (US$ million, AGR%): “L” Shaped Recovery
Figure 224 Mexico Well Intervention Market Forecast, 2021-2032 (US$ billion, AGR %)
Figure 225 MEXICO Well Intervention Market Forecast, 2021-2032 (US$ million, AGR%): “V” Shaped Recovery
Figure 226 Mexico Well Intervention Market Forecast, 2021-2032 (US$ million, AGR%): “U” Shaped Recovery
Figure 227 Mexico Well Intervention Market Forecast, 2021-2032 (US$ million, AGR%): “W” Shaped Recovery
Figure 228 MEXICO Well Intervention Market Forecast, 2021-2032 (US$ million, AGR%): “L” Shaped Recovery
Figure 229 Brazil Well Intervention Market Forecast, 2021-2032 (US$ billion, AGR %)
Figure 230 BRAZIL Well Intervention Market Forecast, 2021-2032 (US$ million, AGR%): “V” Shaped Recovery
Figure 231 Brazil Well Intervention Market Forecast, 2021-2032 (US$ million, AGR%): “U” Shaped Recovery
Figure 232 Brazil Well Intervention Market Forecast, 2021-2032 (US$ million, AGR%): “W” Shaped Recovery
Figure 233 Brazil Well Intervention Market Forecast, 2021-2032 (US$ million, AGR%): “L” Shaped Recovery
Figure 234 Venezuela Well Intervention Market Forecast, 2021-2032 (US$ billion, AGR %)
Figure 235 VENEZUELA Well Intervention Market Forecast, 2021-2032 (US$ million, AGR%): “V” Shaped Recovery
Figure 236 Venezuela Well Intervention Market Forecast, 2021-2032 (US$ million, AGR%): “U” Shaped Recovery
Figure 237 Venezuela Well Intervention Market Forecast, 2021-2032 (US$ million, AGR%): “W” Shaped Recovery
Figure 238 Venezuela Well Intervention Market Forecast, 2021-2032 (US$ million, AGR%): “L” Shaped Recovery
Figure 239 Argentina Well Intervention Market Forecast, 2021-2032 (US$ billion, AGR %)
Figure 240 ARGENTINA Well Intervention Market Forecast, 2021-2032 (US$ million, AGR%): “V” Shaped Recovery
Figure 241 Argentina Well Intervention Market Forecast, 2021-2032 (US$ million, AGR%): “U” Shaped Recovery
Figure 242 Argentina Well Intervention Market Forecast, 2021-2032 (US$ million, AGR%): “W” Shaped Recovery
Figure 243 ARGENTINA Well Intervention Market Forecast, 2021-2032 (US$ million, AGR%): “L” Shaped Recovery
Figure 244 Rest of Latin America Well Intervention Market Forecast, 2021-2032 (US$ billion, AGR %)
Figure 245 REST OF LATIN AMERICA Well Intervention Market Forecast, 2021-2032 (US$ million, AGR%): “V” Shaped Recovery
Figure 246 Rest of Latin America Well Intervention Market Forecast, 2021-2032 (US$ million, AGR%): “U” Shaped Recovery
Figure 247 Rest of Latin America Well Intervention Market Forecast, 2021-2032 (US$ million, AGR%): “W” Shaped Recovery
Figure 248 Rest Of Latin America Well Intervention Market Forecast, 2021-2032 (US$ million, AGR%): “L” Shaped Recovery
Figure 249 Middle East & Africa Well Intervention Market Forecast by Country 2021-2032 (US$ million)
Figure 250 Middle East & Africa Well Intervention Market Share Forecast by Country 2021, 2026, 2032 (%)
Figure 251 Middle East & Africa Well Intervention Market Forecast by Service Type, 2021-2032 (US$ million, AGR%)
Figure 252 Middle East & Africa Well Intervention Market Forecast by Service Type, 2021-2032 (US$ million, AGR%): “V” Shaped Recovery
Figure 253 Middle East & Africa Well Intervention Market Forecast by Service Type, 2021-2032 (US$ million, AGR%): “U” Shaped Recovery
Figure 254 Middle East & Africa Well Intervention Market Forecast by Service Type, 2021-2032 (US$ million, AGR%): “W” Shaped Recovery
Figure 255 Middle East & Africa Well Intervention Market Forecast by Service Type, 2021-2032 (US$ million, AGR%): “L” Shaped Recovery
Figure 256 Middle East & Africa Well Intervention Market Forecast by Well Type, 2021-2032 (US$ million, AGR%)
Figure 257 Middle East & Africa Well Intervention Market Forecast by Well Type, 2021-2032 (US$ million, AGR%): “V” Shaped Recovery
Figure 258 Middle East & Africa Well Intervention Market Forecast by Well Type, 2021-2032 (US$ million, AGR%): “U” Shaped Recovery
Figure 259 Middle East & Africa Well Intervention Market Forecast by Well Type, 2021-2032 (US$ million, AGR%): “W” Shaped Recovery
Figure 260 Middle East & Africa Well Intervention Market Forecast by Well Type, 2021-2032 (US$ million, AGR%): “L” Shaped Recovery
Figure 261 Middle East & Africa Well Intervention Market Forecast by Application, 2021-2032 (US$ million, AGR%)
Figure 262 Middle East & Africa Well Intervention Market Forecast by Application, 2021-2032 (US$ million, AGR%): “V” Shaped Recovery
Figure 263 Middle East & Africa Well Intervention Market Forecast by Application, 2021-2032 (US$ million, AGR%): “U” Shaped Recovery
Figure 264 Middle East & Africa Well Intervention Market Forecast by Application, 2021-2032 (US$ million, AGR%): “W” Shaped Recovery
Figure 265 Middle East & Africa Well Intervention Market Forecast by Application, 2021-2032 (US$ million, AGR%): “L” Shaped Recovery
Figure 266 GCC Well Intervention Market Forecast, 2021-2032 (US$ million, AGR %)
Figure 267 GCC Well Intervention Market Forecast, 2021-2032 (US$ million, AGR%): “V” Shaped Recovery
Figure 268 GCC Well Intervention Market Forecast, 2021-2032 (US$ million, AGR%): “U” Shaped Recovery
Figure 269 GCC Well Intervention Market Forecast, 2021-2032 (US$ million, AGR%): “W” Shaped Recovery
Figure 270 GCC Well Intervention Market Forecast, 2021-2032 (US$ million, AGR%): “L” Shaped Recovery
Figure 271 Iraq Well Intervention Market Forecast, 2021-2032 (US$ million, AGR %)
Figure 272 IRAQ Well Intervention Market Forecast, 2021-2032 (US$ million, AGR%): “V” Shaped Recovery
Figure 273 Iraq Well Intervention Market Forecast, 2021-2032 (US$ million, AGR%): “U” Shaped Recovery
Figure 274 Iraq Well Intervention Market Forecast, 2021-2032 (US$ million, AGR%): “W” Shaped Recovery
Figure 275 Iraq Well Intervention Market Forecast, 2021-2032 (US$ million, AGR%): “L” Shaped Recovery
Figure 276 Nigeria Well Intervention Market Forecast, 2021-2032 (US$ million, AGR %)
Figure 277 NIGERIA Well Intervention Market Forecast, 2021-2032 (US$ million, AGR%): “V” Shaped Recovery
Figure 278 Nigeria Well Intervention Market Forecast, 2021-2032 (US$ million, AGR%): “U” Shaped Recovery
Figure 279 Nigeria Well Intervention Market Forecast, 2021-2032 (US$ million, AGR%): “W” Shaped Recovery
Figure 280 Nigeria Well Intervention Market Forecast, 2021-2032 (US$ million, AGR%): “L” Shaped Recovery
Figure 281 Angola Well Intervention Market Forecast, 2021-2032 (US$ million, AGR %)
Figure 282 ANGOLA Well Intervention Market Forecast, 2021-2032 (US$ million, AGR%): “V” Shaped Recovery
Figure 283 Angola Well Intervention Market Forecast, 2021-2032 (US$ million, AGR%): “U” Shaped Recovery
Figure 284 Angola Well Intervention Market Forecast, 2021-2032 (US$ million, AGR%): “W” Shaped Recovery
Figure 285 Angola Well Intervention Market Forecast, 2021-2032 (US$ million, AGR%): “L” Shaped Recovery
Figure 286 Rest of Middle East & Africa Well Intervention Market Forecast, 2021-2032 (US$ million, AGR %)
Figure 287 REST OF MIDDLE EAST & AFRICA Well Intervention Market Forecast, 2021-2032 (US$ million, AGR%): “V” Shaped Recovery
Figure 288 Rest of Middle East & Africa Well Intervention Market Forecast, 2021-2032 (US$ million, AGR%): “U” Shaped Recovery
Figure 289 Rest of Middle East & Africa Well Intervention Market Forecast, 2021-2032 (US$ million, AGR%): “W” Shaped Recovery
Figure 290 Rest of Middle East & Africa Well Intervention Market Forecast, 2021-2032 (US$ million, AGR%): “L” Shaped Recovery
Figure 291 Global Well Intervention Market: Company Share Analysis, 2020
Figure 292 Halliburton: Net Revenue, 2016-2020 (US$ million, AGR%)
Figure 293 Halliburton: Regional Revenue Shares, 2018-2020
Figure 294 Halliburton: Segmental Revenue Shares, 2018-2020
Figure 295 Halliburton: R&D, 2018-2020 (US$ million, AGR%)
Figure 296 Schlumberger: Net Revenue, 2016-2020 (US$ million, AGR%)
Figure 297 Schlumberger: Regional Revenue Shares, 2018-2020
Figure 298 Schlumberger: Segmental Revenue Shares, 2018-2020
Figure 299 Schlumberger: Gross Profit, 2018-2020 (US$ million, AGR%)
Figure 300 Schlumberger: R&D, 2018-2020 (US$ million, AGR%)
Figure 301 Baker Hughes: Net Revenue, 2016-2020 (US$ million, AGR%)
Figure 302 Baker Hughes: Regional Revenue Shares, 2018-2020
Figure 303 Baker Hughes: Segmental Revenue Shares, 2018-2020
Figure 304 Baker Hughes: R&D, 2018-2020 (US$ million, AGR%)
Figure 305 Weatherford International: Net Revenue, 2016-2020 (US$ million, AGR%)
Figure 306 Weatherford International: Regional Revenue Shares, 2018-2020
Figure 307 Weatherford International: Segmental Revenue Shares, 2018-2020
Figure 308 Weatherford International: R&D, 2018-2020 (US$ million, AGR%)
Figure 309 NexTier Oilfield Solutions: Net Revenue, 2016-2020 (US$ million, AGR%)
Figure 310 NexTier Oilfield Solutions: Regional Revenue Shares, 2018-2020
Figure 311 NexTier Oilfield Solutions: Segmental Revenue Shares, 2018-2020
Figure 312 NexTier Oilfield Solutions: Gross Profit, 2018-2020 (US$ million, AGR%)
Figure 313 NexTier Oilfield Solutions: R&D, 2018-2020 (US$ million, AGR%)
Figure 314 Archer: Net Revenue, 2016-2020 (US$ million, AGR%)
Figure 315 Archer: Regional Revenue Shares, 2018-2020
Figure 316 Expro Group: Net Revenue, 2016-2020 (US$ million, AGR%)
Figure 317 Expro Group: Regional Revenue Shares, 2018-2020
Figure 318 Expro Group: Segmental Revenue Shares, 2018-2020
Figure 319 Expro Group: Gross Profit, 2018-2020 (US$ million, AGR%)
Figure 320 Trican Well Services: Net Revenue, 2016-2020 (US$ million, AGR%)
Figure 321 Trican Well Services: Segmental Revenue Shares, 2018-2020
Figure 322 Nine Energy Services: Net Revenue, 2016-2020 (US$ million, AGR%)
Figure 323 Nine Energy Services: Regional Revenue Shares, 2018-2020
Figure 324 Nine Energy Services: Segmental Revenue Shares, 2018-2020
Figure 325 Key Energy Services: Net Revenue, 2016-2020 (US$ million, AGR%)
Figure 326 Key Energy Services: Segmental Revenue Shares, 2018-2020
Figure 327 Oceaneering International: Net Revenue, 2016-2020 (US$ million, AGR%)
Figure 328 Oceaneering International: Regional Revenue Shares, 2018-2020
Figure 329 Oceaneering International: Segmental Revenue Shares, 2018-2020
Figure 330 Global Well Intervention Market Revenue, by Region from 2021 to 2032 (USD Million) and AGR %
Companies Profiled in the Report
Altus Intervention
Archer
Baker Hughes
Basic Energy Services
Expro Group
Hallirburton
Key Energy Services
NexTier Oilfield Solutions
Nine Energy Services
Oceaneering International
Pioneer Energy Services
Schlumberger
Trican Well Services
Weatherford International
Welltec
List of Companies Mentioned in the Report
Akops Offshore
Almansoori Specialized Engineering
Calfrac
ChampionX
China Oilfield Services
DistributionNOW
EnerCorp
GE Oil & Gas
Helix Energy
Hunting
Hunting Energy Services
Middle East Oilfield Services
MPC Technology
National Oilwell Varco
NESR
Newpark Resources Inc.
NGOFS
NOV Inc.
Novomet
OilServ
Petrogistix
Propell
Q2 Artificial Lift Services (ALS)
RGL Reservoir Management
SAZOIL
SIAO Petroleo
Stimline
Superior Energy Services
Tatweer Petroleum Services
TechnipFMC Plc.
Tendeka
US Well Services
Wepuko PAHNKE Engineering LP
List of Organizations
Association of Oil and Gas Operators
Baker Hughes Rig Count
BP Statistical Review of World Energy
Canadian Association of Petroleum Producers
Company Annual Reports
Company Investor Presentations
Crude Oil and Natural Gas Associations
International Energy Agency
International Well Control Forum
Intervention & Coiled Tubing Association (ICoTA)
Natural Gas Council
Petroleum Alliance
Society of Petroleum Engineers
The International Association of Oil & Gas Producers (IOGP)
US Energy Information Administration
US Oil & Gas Association
World Oil Magazines