Industries > Packaging > Top 20 Cosmetics Packaging Companies 2019
Top 20 Cosmetics Packaging Companies 2019
Albea SA, AptarGroup, Inc., Smurfit Kappa Group Plc, WestRock Co., Graphic Packaging Holding Co., Other Companies
The top 20 cosmetics packaging companies accounted for for $11,091m, or 32.6% of the total cosmetics packaging market (2017). Albea SA, a France based packaging company, accounted for the highest market share in the cosmetics packaging market.
How this report will benefit you
Read on to discover how you can exploit the future business opportunities emerging in this sector.
In this brand new 208-page report you will receive 147 tables and 87 figures– all unavailable elsewhere.
The 208-page report provides clear detailed insight into the top 20 cosmetics packaging companies. Discover the key drivers and challenges affecting the market.
By ordering and reading our brand-new report today you stay better informed and ready to act.
Report Scope
• Discussion and profiles of the leading players in the cosmetics packaging market:
• Albea SA
• AptarGroup, Inc.
• Smurfit Kappa Group Plc
• WestRock Co.
• Graphic Packaging Holding Co.
• Bemis Co., Inc.
• Crown Holdings, Inc.
• Ball Corp.
• CCL Industries, Inc.
• Ardagh Group SA
• Owens-Illinois, Inc.
• RPC Group Plc
• DS Smith Plc
• Silgan Holdings, Inc.
• Greif, Inc.
• Sonoco Products Co.
• Amcor Ltd.
• Avery Dennison Corp.
• Berry Global Group, Inc.
• Tetra Pak International Sa
• Other players
This report discuses key developments, financial information, financial outlook, primary market competitors, products/services, organisational structure, business sectors, SWOT analysis.
• Analysis of what stimulates and restrains the cosmetics packaging market: SWOT Analysis and Market Trends
• Key Questions Answered by this Report:
• Who are the leading players, where are they positioned in the market and what are their prospects?
• How is the cosmetics packaging market evolving?
• What is driving and restraining cosmetics packaging market dynamics?
• What are the market shares for each leading company in the cosmetics packaging market?
• What will be the main drivers of the overall market?
• How will the leading companies adapt their strategies to accommodate changes in market conditions?
Visiongain’s study is intended for anyone requiring commercial analyses for the leading cosmetics packaging companies. You find data, trends and predictions.
Buy our report today Top 20 Cosmetics Packaging Companies 2019: Albea SA, AptarGroup, Inc., Smurfit Kappa Group Plc, WestRock Co., Graphic Packaging Holding Co., Other Companies.
Visiongain is a trading partner with the US Federal Government
CCR Ref number: KD4R6
1.1 Global Cosmetics Packaging Market Overview
1.2 Global Cosmetics Packaging Market Segmentation
1.3 Why You Should Read This Report
1.4 How This Report Delivers
1.5 Key Questions Answered by This Analytical Report Include:
1.6 Who is This Report For?
1.7 Methodology
1.7.1 Secondary Research
1.7.2 Market Evaluation & Forecasting Methodology
1.8 Frequently Asked Questions (FAQ)
1.9 Associated Visiongain Reports
1.10 About Visiongain
2 Introduction to the Cosmetics Packaging Market
2.1 Global Cosmetics Packaging Market Structure
2.2 Cosmetics Packaging Market Definition
2.2.1 Mass, Middle and Premium Markets
2.2.2 Distribution Channels in the Cosmetics Packaging Industry
2.3 Trends in the Cosmetics Market
2.3.1 High Income Economies and Developing Countries Are Spending More in Cosmetics
2.3.2 Growth in Online Sales of Cosmetics
2.3.3 Demand Surges for Anti-Aging and Skin-Whitening Products
2.3.4 Male Grooming Becomes Socially Acceptable
2.3.5 Organic Cosmetics Market to Post Fast Growth
2.4 Introduction to the Cosmetics Packaging Market
2.4.1 Types of Cosmetics Packaging
2.4.2 Functions of Cosmetics Packaging
2.4.3 Major Types of Cosmetics Packaging
2.4.4 Packaging for the Mass, Middle and Premium Market
3 Competitor Positioning in the Global Cosmetics Packaging Market
3.1 Top 20 Cosmetics Packaging Company Share Analysis 2017
3.2 Composition of the Cosmetics Packaging Market
3.2.1 Cosmetics Packaging Market Composition Overview
3.2.2 Positioning of Top 20 Cosmetics Packaging Companies
4 Top 20 Cosmetics Packaging Companies
4.1 WestRock Company
4.1.1 WestRock Company Key Developments 2015-2017
4.1.2 WestRock Company Sales 2013-2017
4.1.3 WestRock Company Net Income 2013-2017
4.1.4 WestRock Company Organisational Structure
4.1.5 WestRock Company Cosmetics Packaging Market Products / Services
4.1.6 WestRock Company Primary Market Competitors 2018
4.1.7 WestRock Company Overview
4.1.8 WestRock Company Key Financial Ratios
4.1.9 WestRock Company Financial Outlook
4.1.10 WestRock Company SWOT Analysis
4.2 Tetra Laval
4.2.1 Tetra Laval Key Developments 2016-2017
4.2.2 Tetra Laval Sales 2013-2017
4.2.3 Tetra Laval Industry Group Revenue Share 2017
4.2.4 Tetra Laval Segment Information
4.2.5 Tetra Laval Cosmetics Packaging Market Products / Services
4.2.6 Tetra Laval Primary Market Competitors 2018
4.2.7 Tetra Laval Overview
4.2.8 Tetra Laval Financial Outlook
4.2.9 Tetra Laval SWOT Analysis
4.3 Ball Corporation
4.3.1 Ball Corporation Key Developments 2015-2018
4.3.2 Ball Corporation Sales 2013-2017
4.3.3 Ball Corporation Net Income 2013-2017
4.3.4 Ball Corporation Organisational Structure
4.3.5 Ball Corporation Cosmetics Packaging Market Products / Services
4.3.6 Ball Corporation Primary Market Competitors 2018
4.3.7 Ball Corporation Overview
4.3.8 Ball Corporation Key Financial Ratios
4.3.9 Ball Corporation Financial Outlook
4.3.10 Ball Corporation SWOT Analysis
4.4 Smurfit Kappa Group Plc
4.4.1 Smurfit Kappa Group Plc Key Developments 2016-2018
4.4.2 Smurfit Kappa Group Plc Sales 2013-2017
4.4.3 Smurfit Kappa Group Plc Net Income 2013-2017
4.4.4 Smurfit Kappa Group Plc Market Sectors
4.4.5 Smurfit Kappa Group Plc Cosmetics Packaging Market Products / Services
4.4.6 Smurfit Kappa Group Plc Primary Market Competitors 2018
4.4.7 Smurfit Kappa Group Plc Overview
4.4.8 Smurfit Kappa Group Plc Key Financial Ratios
4.4.9 Smurfit Kappa Group Plc Financial Outlook
4.4.10 Smurfit Kappa Group Plc SWOT Analysis
4.5 Crown Holdings, Inc.
4.5.1 Crown Holdings, Inc. Key Developments 2016-2018
4.5.2 Crown Holdings, Inc. Sales 2013-2017
4.5.3 Crown Holdings, Inc. Net Income 2013-2017
4.5.4 Crown Holdings, Inc. Company Structure
4.5.5 Crown Holdings, Inc. Cosmetics Packaging Market Products / Services
4.5.6 Crown Holdings, Inc. Primary Market Competitors 2018
4.5.7 Crown Holdings, Inc. Overview
4.5.8 Crown Holdings, Inc. Key Financial Ratios
4.5.9 Crown Holdings, Inc. Financial Outlook
4.5.10 Crown Holdings, Inc. SWOT Analysis
4.6 Amcor Ltd.
4.6.1 Amcor Ltd. Key Developments 2015-2018
4.6.2 Amcor Ltd. Sales 2013-2017
4.6.3 Amcor Ltd. Net Income 2013-2017
4.6.4 Amcor Ltd. Business Divisions
4.6.5 Amcor Ltd. Cosmetics Packaging Market Products / Services
4.6.6 Amcor Ltd. Primary Market Competitors 2018
4.6.7 Amcor Ltd. Overview
4.6.8 Amcor Ltd. Key Financial Ratios
4.6.9 Amcor Ltd. Financial Outlook
4.6.10 Amcor Ltd. SWOT Analysis
4.7 Owens-Illinois, Inc.
4.7.1 Owens-Illinois, Inc. Key Developments 2015-2018
4.7.2 Owens-Illinois, Inc. Sales 2013-2017
4.7.3 Owens-Illinois, Inc. Net Income 2013-2017
4.7.4 Owens-Illinois, Inc. Business Sectors
4.7.5 Owens-Illinois, Inc. Cosmetics Packaging Market Products / Services
4.7.6 Owens-Illinois, Inc. Primary Market Competitors 2018
4.7.7 Owens-Illinois, Inc. Overview
4.7.8 Owens-Illinois, Inc. Key Financial Ratios
4.7.9 Owens-Illinois, Inc. Financial Outlook
4.7.10 Owens-Illinois, Inc. SWOT Analysis
4.8 Ardagh Group SA
4.8.1 Ardagh Group SA Key Developments 2016-2018
4.8.2 Ardagh Group SA Sales 2014-2017
4.8.3 Ardagh Group SA Net Income 2014-2017
4.8.4 Ardagh Group SA Business Divisions
4.8.5 Ardagh Group SA Cosmetics Packaging Market Products / Services
4.8.6 Ardagh Group SA Primary Market Competitors 2018
4.8.7 Ardagh Group SA Overview
4.8.8 Ardagh Group SA Key Financial Ratios
4.8.9 Ardagh Group SA Financial Outlook
4.8.10 Ardagh Group SA SWOT Analysis
4.9 DS Smith Plc
4.9.1 DS Smith Plc Key Developments 2015-2018
4.9.2 DS Smith Plc Sales 2013-2017
4.9.3 DS Smith Plc Net Income 2013-2017
4.9.4 DS Smith Plc Business Sectors
4.9.5 DS Smith Plc Cosmetics Packaging Market Products / Services
4.9.6 DS Smith Plc Primary Market Competitors 2018
4.9.7 DS Smith Plc Overview
4.9.8 DS Smith Plc Key Financial Ratios
4.9.9 DS Smith Plc Financial Outlook
4.9.10 DS Smith Plc SWOT Analysis
4.10 Berry Global Group, Inc.
4.10.1 Berry Global Group, Inc. Key Developments 2015-2018
4.10.2 Berry Global Group, Inc. Sales 2013-2017
4.10.3 Berry Global Group, Inc. Net Income 2013-2017
4.10.4 Berry Global Group, Inc. Business Sectors
4.10.5 Berry Global Group, Inc. Cosmetics Packaging Market Products / Services
4.10.6 Berry Global Group, Inc. Primary Market Competitors 2018
4.10.7 Berry Global Group, Inc. Overview
4.10.8 Berry Global Group, Inc. Key Financial Ratios
4.10.9 Berry Global Group, Inc. Financial Outlook
4.10.10 Berry Global Group, Inc. SWOT Analysis
4.11 Avery Dennison Corp.
4.11.1 Avery Dennison Corp. Key Developments 2016-2018
4.11.2 Avery Dennison Corp. Sales 2013-2017
4.11.3 Avery Dennison Corp. Net Income 2013-2017
4.11.4 Avery Dennison Corp. Business Segments
4.11.5 Avery Dennison Corp. Cosmetics Packaging Market Products / Services
4.11.6 Avery Dennison Corp. Primary Market Competitors 2018
4.11.7 Avery Dennison Corp. Overview
4.11.8 Avery Dennison Corp. Key Financial Ratios
4.11.9 Avery Dennison Corp. Financial Outlook
4.11.10 Avery Dennison Corp. SWOT Analysis
4.12 Sonoco Products Co.
4.12.1 Sonoco Products Co. Key Developments 2016-2018
4.12.2 Sonoco Products Co. Sales 2013-2017
4.12.3 Sonoco Products Co. Industry Group Net Income 2013-2017
4.12.4 Sonoco Products Co. Segment Information
4.12.5 Sonoco Products Co. Cosmetics Packaging Market Products / Services
4.12.6 Sonoco Products Co. Primary Market Competitors 2018
4.12.7 Sonoco Products Co. Overview
4.12.8 Sonoco Products Co. Key Financial Ratios
4.12.9 Sonoco Products Co. Financial Outlook
4.12.10 Sonoco Products Co. SWOT Analysis
4.13 AptarGroup, Inc.
4.13.1 AptarGroup, Inc. Key Developments 2015-2018
4.13.2 AptarGroup, Inc. Sales 2013-2017
4.13.3 AptarGroup, Inc. Net Income 2013-2017
4.13.4 AptarGroup, Inc. Organisational Structure
4.13.5 AptarGroup, Inc. Cosmetics Packaging Market Products / Services
4.13.6 AptarGroup, Inc. Primary Market Competitors 2018
4.13.7 AptarGroup, Inc. Overview
4.13.8 AptarGroup, Inc. Key Financial Ratios
4.13.9 AptarGroup, Inc. Financial Outlook
4.13.10 AptarGroup, Inc. SWOT Analysis
4.14 Albéa Beauty Holdings S.A.
4.14.1 Albéa Beauty Holdings S.A. Key Developments 2016-2018
4.14.2 Albéa Beauty Holdings S.A. Sales 2013-2017
4.14.3 Albéa Beauty Holdings S.A. Gross Profit 2013-2017
4.14.4 Albéa Beauty Holdings S.A. Business Segment
4.14.5 Albéa Beauty Holdings S.A. Cosmetics Packaging Market Products / Services
4.14.6 Albéa Beauty Holdings S.A. Primary Market Competitors 2018
4.14.7 Albéa Beauty Holdings S.A. Overview
4.14.8 Albéa Beauty Holdings S.A. Financial Outlook
4.14.9 Albéa Beauty Holdings S.A. SWOT Analysis
4.15 Graphic Packaging Holding Co.
4.15.1 Graphic Packaging Holding Co. Key Developments 2016-2017
4.15.2 Graphic Packaging Holding Co. Sales 2013-2017
4.15.3 Graphic Packaging Holding Co. Net Income 2013-2017
4.15.4 Graphic Packaging Holding Co. Company Structure
4.15.5 Graphic Packaging Holding Co. Cosmetics Packaging Market Products / Services
4.15.6 Graphic Packaging Holding Co. Primary Market Competitors 2018
4.15.7 Graphic Packaging Holding Co. Overview
4.15.8 Graphic Packaging Holding Co. Paperboard Mills and Folding Carton Facilities
4.15.9 Graphic Packaging Holding Co. Key Financial Ratios
4.15.10 Graphic Packaging Holding Co. Financial Outlook
4.16 RPC Group Plc
4.16.1 RPC Group Plc Key Developments 2015-2018
4.16.2 RPC Group Plc Sales 2013-2017
4.16.3 RPC Group Plc Net Income 2013-2017
4.16.4 RPC Group Plc Business Divisions
4.16.5 RPC Group Plc Cosmetics Packaging Market Products / Services
4.16.6 RPC Group Plc Primary Market Competitors 2018
4.16.7 RPC Group Plc Overview
4.16.8 RPC Group Plc Key Financial Ratios
4.16.9 RPC Group Plc Financial Outlook
4.16.10 RPC Group Plc SWOT Analysis
4.17 Silgan Holdings, Inc.
4.17.1 Silgan Holdings, Inc. Key Development 2017
4.17.2 Silgan Holdings, Inc. Sales 2013-2017
4.17.3 Silgan Holdings, Inc. Net Income 2013-2017
4.17.4 Silgan Holdings, Inc. Business Sectors
4.17.5 Silgan Holdings, Inc. Cosmetics Packaging Market Products / Services
4.17.6 Silgan Holdings, Inc. Primary Market Competitors 2018
4.17.7 Silgan Holdings, Inc. Overview
4.17.8 Silgan Holdings, Inc. Key Financial Ratios
4.17.9 Silgan Holdings, Inc. Financial Outlook
4.17.10 Silgan Holdings, Inc. SWOT Analysis
4.18 Bemis Co., Inc.
4.18.1 Bemis Co., Inc. Key Developments 2017-2018
4.18.2 Bemis Co., Inc. Sales 2013-2017
4.18.3 Bemis Co., Inc. Net Income 2013-2017
4.18.4 Bemis Co., Inc. Business Divisions
4.18.5 Bemis Co., Inc. Cosmetics Packaging Market Products / Services
4.18.6 Bemis Co., Inc. Primary Market Competitors 2018
4.18.7 Bemis Co., Inc. Overview
4.18.8 Bemis Co., Inc. Key Financial Ratios
4.18.9 Bemis Co., Inc. Financial Outlook
4.18.10 Bemis Co., Inc. SWOT Analysis
4.19 Greif, Inc.
4.19.1 Greif, Inc. Key Developments 2017-2018
4.19.2 Greif, Inc. Sales 2013-2017
4.19.3 Greif, Inc. Net Income 2013-2017
4.19.4 Greif, Inc. Business Segments
4.19.5 Greif, Inc. Cosmetics Packaging Market Products / Services
4.19.6 Greif, Inc. Primary Market Competitors 2018
4.19.7 Greif, Inc. Overview
4.19.8 Greif, Inc. Key Financial Ratios
4.19.9 Greif, Inc. Financial Outlook
4.19.10 Greif, Inc. SWOT Analysis
4.20 CCL Industries, Inc.
4.20.1 CCL Industries, Inc. Key Developments 2015-2018
4.20.2 CCL Industries, Inc. Sales 2013-2017
4.20.3 CCL Industries, Inc. Net Income 2013-2017
4.20.4 CCL Industries, Inc. Business Sectors
4.20.5 CCL Industries, Inc. Cosmetics Packaging Market Products / Services
4.20.6 CCL Industries, Inc. Primary Market Competitors 2018
4.20.7 CCL Industries, Inc. Overview
4.20.8 CCL Industries, Inc. Key Financial Ratios
4.20.9 CCL Industries, Inc. Financial Outlook
4.20.10 CCL Industries, Inc. SWOT Analysis
5 Other Leading Players in the Value Chain
6 SWOT Analysis of the Cosmetics Packaging Market
7 Conclusion
Appendices
Associated Visiongain Reports
Visiongain Report Sales Order Form
About Visiongain
Visiongain Report Evaluation Form
List of Tables
Table 3.1 Leading 20 Cosmetics Packaging Companies Shares 2017 (Ranking, Company, FY2017 Total / Parent Company Sales $m, FY2017 Sales in the COSMETICS PACKAGING Market $m, % Share of COSMETICS PACKAGING Sales from Total Company Sales, Cosmetics Packaging Market Share %)
Table 4.1 WestRock Company Profile 2017 (Cosmetics Packaging Market Ranking, Cosmetics Packaging Market Share %, CEO, Parent Company Sales $m, Sales in the Market $m, Share of Company Sales from the Market %, Business Segment in the Market, HQ, Founded, No. of Employees, Website)
Table 4.2 Selected Recent WestRock Company Cosmetics Packaging Market Developments 2015-2017
Table 4.3 WestRock Company Sales 2013-2017 ($m, AGR %)
Table 4.4 WestRock Company Net Income 2013-2017 ($m, AGR %)
Table 4.5 WestRock Company Cosmetics Packaging Market Products / Services (Segment of Business, Product, Specification / Features)
Table 4.6 WestRock Company Total Number of Corporate and Operating Facilities
Table 4.7 WestRock Company Consumer Packaging Mills (Location and Total Capacity)
Table 4.8 WestRock Company: Key Financial Ratios, 2017
Table 4.9 WestRock Company SWOT Analysis 2018
Table 4.10 Tetra Laval Profile 2017 (Cosmetics Packaging Market Ranking, Cosmetics Packaging Market Share %, CEO, Parent Company Sales $m, Sales in the Market $m, Share of Company Sales from the Market %, Business Segment in the Market, HQ, Founded, No. of Employees, Website)
Table 4.11 Selected Recent Tetra Laval Cosmetics Packaging Market Developments 2016-2017
Table 4.12 Tetra Laval Sales 2013-2017 ($m, AGR %)
Table 4.13 Tetra Laval Industry Group Revenue 2017 ($bn)
Table 4.14 Tetra Laval Cosmetics Packaging Market Products / Services (Segment of Business, Product, Specification / Features)
Table 4.15 Tetra Pak Top Ten Markets in Packaging Materials
Table 4.16 Tetra Pak Top Ten Markets in Processing Solutions
Table 4.17 Tetra Laval SWOT Analysis 2018
Table 4.18 Ball Corporation Profile 2017 (Cosmetics Packaging Market Ranking, Cosmetics Packaging Market Share %, CEO, Parent Company Sales $m, Sales in the Market $m, Share of Company Sales from the Market %, Business Segment in the Market, HQ, Founded, No. of Employees, Website)
Table 4.19 Selected Recent Ball Corporation Cosmetics Packaging Market Developments 2015-2018
Table 4.20 Ball Corporation Sales 2013-2017 ($m, AGR %)
Table 4.21 Ball Corporation Net Income 2013-2017 ($m, AGR %)
Table 4.22 Ball Corporation Cosmetics Packaging Market Products / Services (Segment of Business, Product, Specification / Features)
Table 4.23 Ball Corporation Food & Aerosol Facilities (Location and Approximate Floor Space in Square Feet)
Table 4.24 Ball Corporation: Key Financial Ratios, 2017
Table 4.25 Ball Corporation SWOT Analysis 2018
Table 4.26 Smurfit Kappa Group Plc Profile 2017 (Cosmetics Packaging Market Ranking, Cosmetics Packaging Market Share %, CEO, Parent Company Sales $m, Sales in the Market $m, Share of Company Sales from the Market %, Business Segment in the Market, HQ, Founded, No. of Employees, Website)
Table 4.27 Selected Recent Smurfit Kappa Group Plc Cosmetics Packaging Market Developments 2016-2018
Table 4.28 Smurfit Kappa Group Plc Sales 2013-2017 ($m, AGR %)
Table 4.29 Smurfit Kappa Group Plc Net Income 2013-2017 ($m, AGR %)
Table 4.30 Smurfit Kappa Group Plc Cosmetics Packaging Market Products / Services (Segment of Business, Product, Specification / Features)
Table 4.31 Smurfit Kappa Group Plc: Key Financial Ratios, 2017
Table 4.32 Smurfit Kappa Group Plc SWOT Analysis 2018
Table 4.33 Crown Holdings, Inc. Profile 2017 (Cosmetics Packaging Market Ranking, Cosmetics Packaging Market Share %, CEO, Parent Company Sales $m, Sales in the Market $m, Share of Company Sales from the Market %, Business Segment in the Market, HQ, Founded, No. of Employees, Website)
Table 4.34 Selected Recent Crown Holdings, Inc. Cosmetics Packaging Market Developments 2016-2018
Table 4.35 Crown Holdings, Inc. Sales 2013-2017 ($m, AGR %)
Table 4.36 Crown Holdings, Inc. Net Income 2013-2017 ($m, AGR %)
Table 4.37 Crown Holdings, Inc. Cosmetics Packaging Market Products / Services (Segment of Business, Product, Specification / Features)
Table 4.38 Crown Holdings, Inc.: Key Financial Ratios, 2017
Table 4.39 Crown Holdings, Inc. SWOT Analysis 2018
Table 4.40 Amcor Ltd. Profile 2017 (Cosmetics Packaging Market Ranking, Cosmetics Packaging Market Share %, CEO, Parent Company Sales $m, Sales in the Market $m, Share of Company Sales from the Market %, Business Segment in the Market, HQ, Founded, No. of Employees, Website)
Table 4.41 Selected Recent Amcor Ltd. Cosmetics Packaging Market Developments 2015-2018
Table 4.42 Amcor Ltd. Sales 2013-2017 ($m, AGR %)
Table 4.43 Amcor Ltd. Net Income 2013-2017 ($m, AGR %)
Table 4.44 Amcor Ltd. Cosmetics Packaging Market Products / Services (Segment of Business, Product, Specification / Features)
Table 4.45 Amcor Ltd.: Key Financial Ratios, 2017
Table 4.46 Amcor Ltd. SWOT Analysis 2018
Table 4.47 Owens-Illinois, Inc. Profile 2017 (Cosmetics Packaging Market Ranking, Cosmetics Packaging Market Share %, CEO, Parent Company Sales $m, Sales in the Market $m, Share of Company Sales from the Market %, Business Segment in the Market, HQ, Founded, No. of Employees, Website)
Table 4.48 Selected Recent Owens-Illinois, Inc. Cosmetics Packaging Market Developments 2015-2018
Table 4.49 Owens-Illinois, Inc. Sales 2013-2017 ($m, AGR %)
Table 4.50 Owens-Illinois, Inc. Net Income 2013-2017 ($m, AGR %)
Table 4.51 Owens-Illinois, Inc. Cosmetics Packaging Market Products / Services (Segment of Business, Product, Specification / Features)
Table 4.52 Owens-Illinois, Inc.: Key Financial Ratios, 2017
Table 4.53 Owens-Illinois, Inc. SWOT Analysis 2018
Table 4.54 Ardagh Group SA Profile 2017 (Cosmetics Packaging Market Ranking, Cosmetics Packaging Market Share %, CEO, Parent Company Sales $m, Sales in the Market $m, Share of Company Sales from the Market %, Business Segment in the Market, HQ, Founded, No. of Employees, Website)
Table 4.55 Selected Recent Ardagh Group SA Cosmetics Packaging Market Developments 2016-2018
Table 4.56 Ardagh Group SA Sales 2013-2017 ($m, AGR %)
Table 4.57 Ardagh Group SA Net Income 2013-2017 ($m, AGR %)
Table 4.58 Ardagh Group SA Cosmetics Packaging Market Products / Services (Segment of Business, Product, Specification / Features)
Table 4.59 Ardagh Group SA: Key Financial Ratios, 2017
Table 4.60 Ardagh Group SA SWOT Analysis 2018
Table 4.61 DS Smith Plc Profile 2017 (Cosmetics Packaging Market Ranking, Cosmetics Packaging Market Share %, CEO, Parent Company Sales $m, Sales in the Market $m, Share of Company Sales from the Market %, Business Segment in the Market, HQ, Founded, No. of Employees, Website)
Table 4.62 Selected Recent DS Smith Plc Cosmetics Packaging Market Developments 2015-2018
Table 4.63 DS Smith Plc Sales 2013-2017 ($m, AGR %)
Table 4.64 DS Smith Plc Net Income 2013-2017 ($m, AGR %)
Table 4.65 DS Smith Plc Cosmetics Packaging Market Products / Services (Segment of Business, Product, Specification / Features)
Table 4.66 DS Smith Plc: Key Financial Ratios, 2017
Table 4.67 DS Smith Plc SWOT Analysis 2018
Table 4.68 Berry Global Group, Inc. Profile 2017 (Cosmetics Packaging Market Ranking, Cosmetics Packaging Market Share %, CEO, Parent Company Sales $m, Sales in the Market $m, Share of Company Sales from the Market %, Business Segment in the Market, HQ, Founded, No. of Employees, Website)
Table 4.69 Selected Recent Berry Global Group, Inc. Cosmetics Packaging Market Developments 2015-2018
Table 4.70 Berry Global Group, Inc. Sales 2013-2017 ($m, AGR %)
Table 4.71 Berry Global Group, Inc. Net Income 2013-2017 ($m, AGR %)
Table 4.72 Berry Global Group, Inc. Cosmetics Packaging Market Products / Services (Segment of Business, Product, Specification / Features)
Table 4.73 Berry Global Group, Inc.: Key Financial Ratios, 2017
Table 4.74 Berry Global Group, Inc. SWOT Analysis 2018
Table 4.75 Avery Dennison Corp. Profile 2017 (Cosmetics Packaging Market Ranking, Cosmetics Packaging Market Share %, CEO, Parent Company Sales $m, Sales in the Market $m, Share of Company Sales from the Market %, Business Segment in the Market, HQ, Founded, No. of Employees, Website)
Table 4.76 Selected Recent Avery Dennison Corp. Cosmetics Packaging Market Developments 2015-2017
Table 4.77 Avery Dennison Corp. Sales 2013-2017 ($m, AGR %)
Table 4.78 Avery Dennison Corp. Net Income 2013-2017 ($m, AGR %)
Table 4.79 Avery Dennison Corp. Cosmetics Packaging Market Products / Services (Segment of Business, Product, Specification / Features)
Table 4.80 Avery Dennison Corp.: Key Financial Ratios, 2017
Table 4.81 Avery Dennison Corp. SWOT Analysis 2018
Table 4.82 Sonoco Products Co. Profile 2017 (Cosmetics Packaging Market Ranking, Cosmetics Packaging Market Share %, CEO, Parent Company Sales $m, Sales in the Market $m, Share of Company Sales from the Market %, Business Segment in the Market, HQ, Founded, No. of Employees, Website)
Table 4.83 Selected Recent Sonoco Products Co. Cosmetics Packaging Market Developments 2016-2017
Table 4.84 Sonoco Products Co. Sales 2013-2017 ($m, AGR %)
Table 4.85 Sonoco Products Co. Net Income 2013-2017 ($m, AGR %)
Table 4.86 Sonoco Products Co. Cosmetics Packaging Market Products / Services
Table 4.87 Sonoco Products Co.: Key Financial Ratios, 2017
Table 4.88 Sonoco Products Co. SWOT Analysis 2018
Table 4.89 AptarGroup, Inc. Profile 2017 (Cosmetics Packaging Market Ranking, Cosmetics Packaging Market Share %, CEO, Parent Company Sales $m, Sales in the Market $m, Share of Company Sales from the Market %, Business Segment in the Market, HQ, Founded, No. of Employees, Website)
Table 4.90 Selected Recent AptarGroup, Inc. Cosmetics Packaging Market Developments 2015-2018
Table 4.91 AptarGroup, Inc. Sales 2013-2017 ($m, AGR %)
Table 4.92 AptarGroup, Inc. Net Income 2013-2017 ($m, AGR %)
Table 4.93 AptarGroup, Inc. Cosmetics Packaging Market Products / Services (Segment of Business, Product, Specification / Features)
Table 4.94 AptarGroup, Inc.: Key Financial Ratios, 2017
Table 4.95 AptarGroup, Inc. SWOT Analysis 2018
Table 4.96 Albéa Beauty Holdings S.A. Profile 2017 (Cosmetics Packaging Market Ranking, Cosmetics Packaging Market Share %, CEO, Parent Company Sales $m, Sales in the Market $m, Share of Company Sales from the Market %, Business Segment in the Market, HQ, Founded, No. of Employees, Website)
Table 4.97 Selected Recent Albéa Beauty Holdings S.A. Cosmetics Packaging Market Developments 2016-2018
Table 4.98 Albéa Beauty Holdings S.A. Sales 2013-2017 ($m, AGR %)
Table 4.99 Albéa Beauty Holdings S.A. Gross Profit 2013-2017 ($m, AGR %)
Table 4.100 Albéa Beauty Holdings S.A. Cosmetics Packaging Market Products / Services (Packaging Type, Product, Specification / Features)
Table 4.101 Albéa Beauty Holdings S.A. SWOT Analysis 2018
Table 4.102 Graphic Packaging Holding Co. Profile 2017 (Cosmetics Packaging Market Ranking, Cosmetics Packaging Market Share %, CEO, Parent Company Sales $m, Sales in the Market $m, Share of Company Sales from the Market %, Business Segment in the Market, HQ, Founded, No. of Employees, Website)
Table 4.103 Selected Recent Graphic Packaging Holding Co. Cosmetics Packaging Market Developments 2016-2017
Table 4.104 Graphic Packaging Holding Co. Sales 2013-2017 ($m, AGR %)
Table 4.105 Graphic Packaging Holding Co. Net Income 2013-2017 ($m, AGR %)
Table 4.106 Graphic Packaging Holding Co. Cosmetics Packaging Market Products / Services (Segment of Business, Product)
Table 4.107 Graphic Packaging Holding Co.: Paperboard Mills and Folding Carton Facilities
Table 4.108 Graphic Packaging Holding Co.: Key Financial Ratios, 2017
Table 4.109 RPC Group Plc Profile 2017 (Cosmetics Packaging Market Ranking, Cosmetics Packaging Market Share %, CEO, Parent Company Sales $m, Sales in the Market $m, Share of Company Sales from the Market %, Business Segment in the Market, HQ, Founded, No. of Employees, Website)
Table 4.110 Selected Recent RPC Group Plc Cosmetics Packaging Market Developments 2015-2018
Table 4.111 RPC Group Plc Sales 2013-2017 ($m, AGR %)
Table 4.112 RPC Group Plc Net Income 2013-2017 ($m, AGR %)
Table 4.113 RPC Group Plc Cosmetics Packaging Market Products / Services (Segment of Business, Product, Specification / Features)
Table 4.114 RPC Group Plc: Key Financial Ratios, 2017
Table 4.115 RPC Group Plc SWOT Analysis 2018
Table 4.116 Silgan Holdings, Inc. Profile 2017 (Cosmetics Packaging Market Ranking, Cosmetics Packaging Market Share %, CEO, Parent Company Sales $m, Sales in the Market $m, Share of Company Sales from the Market %, Business Segment in the Market, HQ, Founded, No. of Employees, Website)
Table 4.117 Selected Recent Silgan Holdings, Inc. Cosmetics Packaging Market Development 2017
Table 4.118 Silgan Holdings, Inc. Sales 2013-2017 ($m, AGR %)
Table 4.119 Silgan Holdings, Inc. Net Income 2013-2017 ($m, AGR %)
Table 4.120 Silgan Holdings, Inc. Cosmetics Packaging Market Products / Services (Segment of Business, Product)
Table 4.121 Silgan Holdings, Inc.: Key Financial Ratios, 2017
Table 4.122 Silgan Holdings, Inc. SWOT Analysis 2018
Table 4.123 Bemis Co., Inc. Profile 2017 (Cosmetics Packaging Market Ranking, Cosmetics Packaging Market Share %, CEO, Parent Company Sales $m, Sales in the Market $m, Share of Company Sales from the Market %, Business Segment in the Market, HQ, Founded, No. of Employees, Website)
Table 4.124 Selected Recent Bemis Co., Inc. Cosmetics Packaging Market Developments 2017-2018
Table 4.125 Bemis Co., Inc. Sales 2013-2017 ($m, AGR %)
Table 4.126 Bemis Co., Inc. Net Income 2013-2017 ($m, AGR %)
Table 4.127 Bemis Co., Inc. Cosmetics Packaging Market Products / Services (Product, Specification / Features)
Table 4.128 Bemis Co., Inc.: Key Financial Ratios, 2017
Table 4.129 Bemis Co., Inc. SWOT Analysis 2018
Table 4.130 Greif, Inc. Profile 2017 (Cosmetics Packaging Market Ranking, Cosmetics Packaging Market Share %, CEO, Parent Company Sales $m, Sales in the Market $m, Share of Company Sales from the Market %, Business Segment in the Market, HQ, Founded, No. of Employees, Website)
Table 4.131 Selected Recent Greif, Inc. Cosmetics Packaging Market Developments 2017-2018
Table 4.132 Greif, Inc. Sales 2013-2017 ($m, AGR %)
Table 4.133 Greif, Inc. Net Income 2013-2017 ($m, AGR %)
Table 4.134 Greif, Inc. Cosmetics Packaging Market Products / Services (Segment of Business, Product, Specification / Features)
Table 4.135 Greif, Inc.: Properties, 2017
Table 4.136 Greif, Inc.: Key Financial Ratios, 2017
Table 4.137 Greif, Inc. SWOT Analysis 2018
Table 4.138 CCL Industries, Inc. Profile 2017 (Cosmetics Packaging Market Ranking, Cosmetics Packaging Market Share %, CEO, Parent Company Sales $m, Sales in the Market $m, Share of Company Sales from the Market %, Business Segment in the Market, HQ, Founded, No. of Employees, Website)
Table 4.139 Selected Recent CCL Industries, Inc. Cosmetics Packaging Market Developments 2015-2018
Table 4.140 CCL Industries, Inc. Sales 2013-2017 ($m, AGR %)
Table 4.141 CCL Industries, Inc. Net Income 2013-2017 ($m, AGR %)
Table 4.142 CCL Industries, Inc. Cosmetics Packaging Market Products / Services (Segment of Business, Product, Specification / Features)
Table 4.143 CCL Industries, Inc.: Key Financial Ratios, 2017
Table 4.144 CCL Industries, Inc. SWOT Analysis 2018
Table 5.1 Other Leading Companies in the Cosmetics Packaging Market Value Chain 2018 (Company, Revenue, Employee, Location)
Table 6.1 SWOT Analysis of the Cosmetics Packaging Market 2018
List of Figures
Figure 1.1 Global Cosmetics Packaging Market Segmentation Overview
Figure 2.1 Global Cosmetics Packaging Market Segmentation Overview
Figure 3.1 Top 20 Companies in the Cosmetics Packaging Market FY2017 (Company, Sales $m)
Figure 3.2 Top 20 Companies in the Cosmetics Packaging Market FY2017 (% Share)
Figure 3.3 Competitor Positioning Map of Top 20 Cosmetics Packaging Companies 2017 (Ranking, Cosmetics Packaging Revenue and Share Index)
Figure 3.4 Market Shares of Top 5 Vs. Remaining 15 Cosmetics Packaging Companies 2017 (Company Ranking, Market Share %)
Figure 3.5 Market Shares of Top 10 Vs. Remaining 10 Cosmetics Packaging Companies 2017 (Company Ranking, Market Share %)
Figure 4.1 WestRock Company Sales 2013-2017 ($m, AGR %)
Figure 4.2 WestRock Company Net Income 2013-2017 ($m, AGR %)
Figure 4.3 WestRock Company Organizational Structure 2017
Figure 4.4 WestRock Company Primary Market Competitors 2018
Figure 4.5 Tetra Laval Sales 2013-2017 ($m, AGR %)
Figure 4.6 Tetra Laval Industry Group Share 2017 (%)
Figure 4.7 Tetra Laval Segment Information 2018
Figure 4.8 Tetra Laval Primary Market Competitors 2018
Figure 4.9 Ball Corporation Sales 2013-2017 ($m, AGR %)
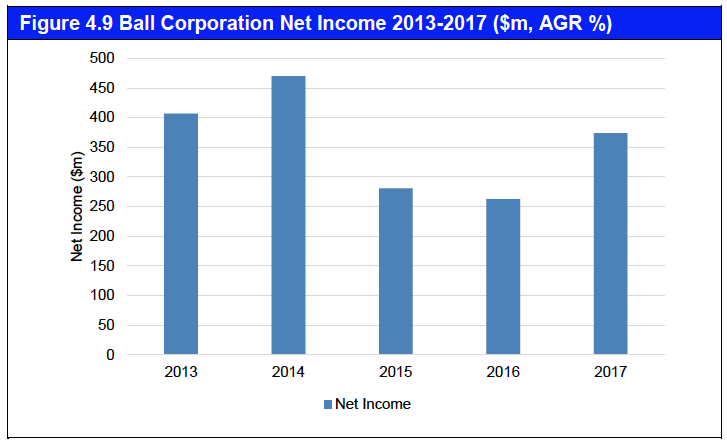
Figure 4.10 Ball Corporation Net Income 2013-2017 ($m, AGR %)
Figure 4.11 Ball Corporation Organizational Structure 2017
Figure 4.12 Ball Corporation Primary Market Competitors 2018
Figure 4.13 Smurfit Kappa Group Plc Sales 2013-2017 ($m, AGR %)
Figure 4.14 Smurfit Kappa Group Plc Net Income 2013-2017 ($m, AGR %)
Figure 4.15 Smurfit Kappa Group Plc Market Sectors 2017
Figure 4.16 Smurfit Kappa Group Plc Primary Market Competitors 2018
Figure 4.17 Crown Holdings, Inc. Sales 2013-2017 ($m, AGR %)
Figure 4.18 Crown Holdings, Inc. Net Income 2013-2017 ($m, AGR %)
Figure 4.19 Crown Holdings, Inc. Company Structure 2017
Figure 4.20 Crown Holdings, Inc. Primary Market Competitors 2018
Figure 4.21 Amcor Ltd. Sales 2013-2017 ($m, AGR %)
Figure 4.22 Amcor Ltd. Net Income 2013-2017 ($m, AGR %)
Figure 4.23 Amcor Ltd. Business Divisions 2017
Figure 4.24 Amcor Ltd. Primary Market Competitors 2018
Figure 4.25 Owens-Illinois, Inc. Sales 2013-2017 ($m, AGR %)
Figure 4.26 Owens-Illinois, Inc. Net Income 2013-2017 ($m, AGR %)
Figure 4.27 Owens-Illinois, Inc. Business Sectors 2017
Figure 4.28 Owens-Illinois, Inc. Primary Market Competitors 2018
Figure 4.29 Ardagh Group SA Sales 2014-2017 ($m, AGR %)
Figure 4.30 Ardagh Group SA Net Income 2014-2017 ($m, AGR %)
Figure 4.31 Ardagh Group SA Business Divisions 2018
Figure 4.32 Ardagh Group SA Primary Market Competitors 2018
Figure 4.33 DS Smith Plc Sales 2013-2017 ($m, AGR %)
Figure 4.34 DS Smith Plc Net Income 2013-2017 ($m, AGR %)
Figure 4.35 DS Smith Plc Business Sectors 2017
Figure 4.36 DS Smith Plc Primary Market Competitors 2018
Figure 4.37 Berry Global Group, Inc. Sales 2013-2017 ($m, AGR %)
Figure 4.38 Berry Global Group, Inc. Net Income 2013-2017 ($m, AGR %)
Figure 4.39 Berry Global Group, Inc. Business Sectors 2017
Figure 4.40 Berry Global Group, Inc. Primary Market Competitors 2018
Figure 4.41 Avery Dennison Corp. Sales 2013-2017 ($m, AGR %)
Figure 4.42 Avery Dennison Corp. Net Income 2013-2017 ($m, AGR %)
Figure 4.43 Avery Dennison Corp. Business Segments 2017
Figure 4.44 Avery Dennison Corp. Primary Market Competitors 2018
Figure 4.45 Sonoco Products Co. Sales 2013-2017 ($m, AGR %)
Figure 4.46 Sonoco Products Co. Industry Group Share 2017 (%)
Figure 4.47 Sonoco Products Co. Segment Information 2018
Figure 4.48 Sonoco Products Co. Primary Market Competitors 2018
Figure 4.49 AptarGroup, Inc. Sales 2013-2017 ($m, AGR %)
Figure 4.50 AptarGroup, Inc. Net Income 2013-2017 ($m, AGR %)
Figure 4.51 AptarGroup, Inc. Organizational Structure 2017
Figure 4.52 AptarGroup, Inc. Primary Market Competitors 2018
Figure 4.53 Albéa Beauty Holdings S.A. Sales 2013-2017 ($m, AGR %)
Figure 4.54 Albéa Beauty Holdings S.A. Gross Profit 2013-2017 ($m, AGR %)
Figure 4.55 Albéa Beauty Holdings S.A. Business Segments 2017
Figure 4.56 Albéa Beauty Holdings S.A. Primary Market Competitors 2018
Figure 4.57 Graphic Packaging Holding Co. Sales 2013-2017 ($m, AGR %)
Figure 4.58 Graphic Packaging Holding Co. Net Income 2013-2017 ($m, AGR %)
Figure 4.59 Graphic Packaging Holding Co. Company Structure 2017
Figure 4.60 Graphic Packaging Holding Co. Primary Market Competitors 2018
Figure 4.61 RPC Group Plc Sales 2013-2017 ($m, AGR %)
Figure 4.62 RPC Group Plc Net Income 2013-2017 ($m, AGR %)
Figure 4.63 RPC Group Plc Business Divisions 2017
Figure 4.64 RPC Group Plc Primary Market Competitors 2018
Figure 4.65 Silgan Holdings, Inc. Sales 2013-2017 ($m, AGR %)
Figure 4.66 Silgan Holdings, Inc. Net Income 2013-2017 ($m, AGR %)
Figure 4.67 Silgan Holdings, Inc. Business Sectors 2017
Figure 4.68 Silgan Holdings, Inc. Primary Market Competitors 2018
Figure 4.69 Bemis Co., Inc. Sales 2013-2017 ($m, AGR %)
Figure 4.70 Bemis Co., Inc. Net Income 2013-2017 ($m, AGR %)
Figure 4.71 Bemis Co., Inc. Business Divisions 2018
Figure 4.72 Bemis Co., Inc. Primary Market Competitors 2018
Figure 4.73 Greif, Inc. Sales 2013-2017 ($m, AGR %)
Figure 4.74 Greif, Inc. Net Income 2013-2017 ($m, AGR %)
Figure 4.75 Greif, Inc. Business Segments 2017
Figure 4.76 Greif, Inc. Primary Market Competitors 2018
Figure 4.77 CCL Industries, Inc. Sales 2013-2017 ($m, AGR %)
Figure 4.78 CCL Industries, Inc. Net Income 2013-2017 ($m, AGR %)
Figure 4.79 CCL Industries, Inc. Business Sectors 2017
Figure 4.80 CCL Industries, Inc. Primary Market Competitors 2018
Albéa Beauty Holdings S.A.
Albea SA
Alcan Packaging Beauty
Amcor Ltd.
Ampac Holdings Llc
AMVIG Holdings Ltd.
AptarGroup, Inc.
Ardagh Finance Holdings S.A.
Ardagh Group SA
Avery Dennison Corp.
AVINTIV Inc.
Ball Corp.
Ball Corporation
Bemis Co., Inc.
BERICAP GmbH & Co KG
Berlin Packaging L.L.C.
Berry Global Group, Inc.
Berry Plastics Group, Inc.
Bilcare Ltd.
Bobbie Brown
Bon Ami Company
Bourjois Cosmetics
Brødrene Hartmann A/S
Bway Holding Company
Capsule International Llc
Carton Craft Corporation
CCL Industries, Inc.
Cenveo Packaging
Chanel
Clarins
Clear Lam Packaging, Inc.
Clinique
Clopay Plastic Products Company, Inc.
Coach
Colorpak
Conitex Sonoco
Consol Glass (Pty) Ltd
Crown Food España Sociedad Anonima.
Crown Holdings, Inc.
DeLaval
Dior
Dongwon Systems Corp.
DS Smith Plc
Dynapac Co., Ltd.
Encirc Limited
Essel Propack Ltd.
Estee Lauder
Exal Corporation
Faultless Starch
Flint Group Germany GmbH
Fortress Global Enterprises, Inc.
Fuji Seal International, Inc.
Garnier
G-Box, S.A. de C.V.
GEKA GmbH
Giorgio Armani
Graphic Packaging Holding Co.
Greif, Inc.
Groupe Ecco Boites Pliantes Ltée.
Grupo Gondi
Grupo Rotoplas SA de CV
Guala Closures Spa
Hanna Group Pty Ltd
Hindusthan National Glass & Industries Ltd.
Innovia Films Limited
Innovia Group
Intertape Polymer Group, Inc.
J.L. Clark Llc
Junior Achievement (JA)
Kaufman Container Company
Korsini-SAF
Kuantum Papers Ltd.
L’Oreal Paris
Lancôme
Letica Corporation
Lithocraft, Inc.
MAC
Macfarlane Group Plc
Manaksia Ltd.
Maybelline
MeadWestvaco
Multi Packaging Solutions International Limited
Multi-Color Corp.
Mylène
National Carton and Coating Co.
New Toyo International Holdings Ltd.
Norgraft Packaging, S.A.
Nortec International Ltd.
Owens-Illinois, Inc.
P&G
Piramal Glass Ltd.
Plastic Packaging Inc.
Pro-Pac Packaging Ltd.
PSB Industries SA
PT Berlina Tbk
Q7Paris
Reparenco
Revlon
Reynolds Presto Products Inc.
Richards Packaging Income Fund
RKW SE
RockTenn Company
RPC Group Plc
Saxon Packaging
Scandolara Tub-Est s.r.o
Schoeller Allibert Group B.V.
Seydaco Packaging Corp.
Shisiedo
Sidel
Signode Industrial Group Holdings (Bermuda) Ltd.
Silgan Holdings, Inc.
Sks Bottle And Packaging Inc.
Smurfit Kappa Group Plc
Sonoco Products Co.
Soyuz
SP Fiber Holdings, Inc.
Starboard Value LP
Sun Chemical
Superior Multi-Packaging Limited
Tat Seng Packaging Group Ltd.
Tetra Laval
Tetra Pak International Sa
The Australian Paper Manufacturers
The Bryce Corporation
The European Aluminum Foil Association (EAFA)
The Prudential Insurance Company of America
The Works Stores Ltd
Tom Ford
Torelló
Treofan Americas
Tricorbraun Inc.
UFP Technologies, Inc.
Unilever
University of Toledo
Utopia Skincare
Vetropack Holding AG
Vidrala SA
W/S Packaging Group Inc.
WestRock Company
Yun Probiotherapy
Yves Saint Laurent
Download sample pages
Complete the form below to download your free sample pages for Top 20 Cosmetics Packaging Companies 2019
Related reports
-

Aseptic Packaging Market Report 2019-2029
With global, national/regional, and submarket estimates for aseptic packaging market, this report covers key aspects of this market. Also, the...Full DetailsPublished: 05 April 2019 -

PET Packaging Market Forecast 2018-2028
Visiongain’s definitive new report assesses that the PET Packaging market will exceed $56bn in 2017.
...Full DetailsPublished: 12 December 2017 -

Active, Smart and Intelligent Packaging Market Report 2019-2029
With an incredible amount of attention devoted to active, smart and intelligent packaging market, deriving market prospects and opportunities can...Full DetailsPublished: 14 January 2019 -

Sterile Medical Packaging Market Report 2018-2028
The global Sterile Medical packaging market is expected to reach $31.2bn in 2018 and develop dynamically over the forecast period,...Full DetailsPublished: 19 September 2018 -

Rigid Plastic Packaging Market Report 2019-2029
The latest report from business intelligence provider Visiongain offers a comprehensive analysis of the global Rigid Plastic Packaging market. Visiongain...Full DetailsPublished: 09 April 2019 -

Personal Care Packaging Market Report 2018-2028
The global personal care packaging market is expected to reach $28.1bn in 2018 and develop dynamically over the forecast period,...Full DetailsPublished: 03 August 2018 -

Tube Packaging Market Report 2018-2028
The latest report from business intelligence provider Visiongain offers comprehensive analysis of the global tube packaging market. Visiongain assesses that...Full DetailsPublished: 31 July 2018
Download sample pages
Complete the form below to download your free sample pages for Top 20 Cosmetics Packaging Companies 2019
Do you have any custom requirements we can help you with?
Any specific country, geo region, market segment or specific company information?
Email us today, we can discuss your needs and see how we can help: jamie.roberts@visiongain.com
Would you like a free report overview of the report of your choice?
If so, please drop an email to Jamie Roberts stating your chosen report title to jamie.robertsvisiongain.com
Visiongain packaging related reports are compiled using a broad and rich mixture of both primary and secondary information to produce an overall industry outlook. In order to provide our clients with the best product possible product, visiongain analysts reach out to market-leading vendors and industry experts but also review a wealth of financial data and product information from a vast range of sources. To find out more about our reports methodology, please email jamie.roberts@visiongain.com
Would you like to get the latest Visiongain packaging reports catalogue?
What are the dynamic growth sectors? where are the regional business opportunities?
Which technologies will prevail and who are the leading companies succeeding in these sectors and why?
If you want definitive answers to business critical questions, discover Visiongain’s full range of business intelligence reports.
If so, please email Jamie Roberts on jamie.roberts@visiongain.com or call her today on +44 207 336 6100
Adhesive & Sealant Council
Alliance of Foam Packaging Recyclers
American Bakers Association
American Chemistry Council
American Forest & Paper Association
American Frozen Food Institute
American Institute of Food Distributors
American Iron and Steel Institute
American Management Association
American National Standards Institute
American Plastics Council (APC)
American Society for Testing and Materials
Association for Suppliers of Printing, Publishing
AICC, The Independent Packaging Association
Association of Industrial Metallizers, Coaters and Laminators (AIMCAL)
Automated Identification Manufacturer
Automated Imaging Association
Can Manufacturers Institute
Chocolate Manufacturers Association of the U.S.A.
Consumer Healthcare Products Association
Contract Manufacturing and Packaging Association
Converting Equipment Manufacturers Association
Corrugated Packaging Council
Drug, Chemical & Allied Trade Association
Envelope Manufacturers Association
Fibre Box Association
Flexible Packaging Association
Flexographic Technical AssociationFlexographic Technical Association
Foil Stamping and Embossing Association
Food and Drug Law Institute
Food Institute
Food Marketing Institute
Food Processing Machinery & Supplies Association
Foodservice & Packaging Institute
Glass Packaging Institute
Graphic Arts Technical Foundation
Gravure Association of America
Grocery Manufacturers of America
Healthcare Compliance Packaging Council
High Definition Flexo Consortium
Institute of Food Technologists
Institute of Packaging Professionals
International Association of Food Industry Suppliers
International Bottled Water Association
International Dairy Foods Association
International Foodservice Manufacturers Association
International Safe Transit Association
Label Printing Industries of America
Material Handling Industry of America
National Association of Container Distributors
National Association of Manufacturers
National Chicken Council
National Coil Coating Association
National Confectioners Association of the U.S.A.
National Freight Claim & Security
National Institute of Packaging, Handling & Logistics Engineers
National Paper Trade Association
National Wooden Pallet & Container
Open Modular Architecture Controls (OMAC) Packaging Workgroup
Packaging Association of Canada
Paperboard Packaging Council
Petroleum Packaging Council
Pharmaceutical Research and Manufacturers of America
PMMI: The Association for Packaging and Processing Technologies
Polystyrene Packaging Council
Pressure Sensitive Tape Council
Printing Industries of America
Processing and Packaging Machinery Association (PPMA)
Produce Marketing Association, Inc.
Research & Development Associates for Military Food & Packaging Systems
Robotic Industries Association (RIA)
Snack Food Association
Soap & Detergent Association
Society of Glass and Ceramic Decorators
Society of Manufacturing Engineers
Society of Plastics Engineers (SPE)
Society of the Plastics Industry (SPI)
Steel Recycling Institute
Steel Shipping Containers Institute
Tag and Label Manufacturers Institute
Technical Association of the Pulp & Paper Industry
The Aluminum Association
Transportation Consumer Protection Council
Transportation Loss Prevention & Security Association
Tube Council of North America
Uniform Code Council, Inc.
Western Packaging Association (WPA)
World Packaging Organisation
Latest Packaging news
Visiongain Publishes Caps & Closures Market Report 2024-2034
The global caps & closures market was valued at US$80.8 billion in 2023 and is projected to grow at a CAGR of 9% during the forecast period 2024-2034.
22 February 2024
Visiongain Publishes Flexible (Converted) Plastic Packaging Market Report 2024-2034
The global Flexible (Converted) Plastic Packaging market was valued at US$157.3 billion in 2023 and is projected to grow at a CAGR of 5.4% during the forecast period 2024-2034.
04 January 2024
Visiongain Publishes Beverage Packaging Market Report 2023-2033
The global Beverage Packaging market was valued at US$144.3 billion in 2022 and is projected to grow at a CAGR of 4.6% during the forecast period 2023-2033.
28 September 2023
Visiongain Publishes Cosmetics Packaging Market Report 2023-2033
The global Cosmetics Packaging market is projected to grow at a CAGR of 4.3% by 2033
21 July 2023
