Visiongain values the global thermal EOR market at $17.93bn in 2017. Read on to discover the potential business opportunities available.
Many of the world’s conventional oil fields have already started the inevitable decline in production rate owing to years of extraction of a finite resource. While unconventional reserves do hold the possibility for enormous oil production levels, they are not found everywhere, and the difficulty in extraction of oil from such reserves means that it is not always feasible to develop them. This means that it is often most beneficial to apply EOR to existing fields to help achieve the maximum recovery rate from each well. As oil fields continue to age and their reserves continue to diminish, there is an increasing market for EOR technologies to try to recover as much oil as possible from each source.
EOR technologies have been in operation for a number of decades, primarily being used to recover more oil from ageing oil fields. However, the market is currently undergoing a period of slow growth with low oil prices and concerns over oil demand in emerging economies have a restraining effect. Nevertheless, in the long run improving technologies, ageing oil fields and a dearth of conventional oil finds help to drive investments in the market and increase production. Thermal EOR methods are no longer confined to a few select countries, with companies throughout the world beginning to implement projects to make the most of their existing reserves.
The global thermal EOR spending will expand gradually throughout the forecast period as oil prices are anticipated to recover. CAPEX will remain low during the first half of the forecast period as new developments have been shelved. OPEX increases will offset this decrease in CAPEX and contribute to expanding overall spending in the market.
The thermal EOR market will register lower growth over the next decade compared to other EOR technologies such as CO2 and chemical EOR. As the oldest and most-established market there are several EOR projects that will move towards the end of their project life cycle and see declining production over the next decade. Thermal EOR technologies are not coming to an end. Steam injection technologies and the SAGD method are constantly being improved while emerging thermal EOR technologies such as solar EOR have great potential for a strong production increase.
The thermal EOR market mainly consists of the rapidly growing Canadian oil sands, although the market will also see an expansion of heavy oil projects in the Middle East and Asia. SAGD – the primary technology used for oil production in the oil sands region of Alberta – will be by far the biggest thermal EOR submarket over the forecast period, ahead of steam injection and other technologies.
Visiongain’s global thermal EOR energy market report can keep you informed and up to date with the developments in the market. The report covers global and national market forecasts and analysis from 2017 to 2027 in terms of total spending for the ten leading countries in the thermal EOR market, plus the market for the rest of the world. Also, submarket forecasts and analysis covering the period 2017 to 2027 in terms of total spending for the thermal oil sands and thermal heavy oil submarkets, and the steam injection, SAGD and other thermal EOR technologies submarkets.
With reference to this report, it covers extensive details and analysis of all current thermal EOR projects currently taking place throughout the world. Through extensive secondary research and interviews with industry experts, visiongain has identified a series of market trends that will impact the thermal EOR market over the forecast timeframe.
The report will answer questions such as:
– How is the thermal EOR market evolving?
– What are the prospects for each of the thermal EOR submarkets over the next decade?
– Who are the main companies in the thermal EOR market and what are their market shares and future prospects?
– Where are the major thermal EOR projects currently taking place around the world?
– What is driving and restraining the thermal EOR market?
– Which individual technologies will prevail and how will these shifts be responded to?
– How will the market shares of the leading thermal EOR countries change by 2027?
– Who are the leading players and what are their prospects over the forecast period?
Five Reasons Why You Must Order and Read This Report Today:
1) The report provides SPENDING ($), and PRODUCTION (bpd) forecasts 2017-2027, plus analysis, for 10 national markets and the rest of the world market, providing unique insight into thermal EOR industry developments:
– Canada
– US
– Venezuela
– Kuwait
– Indonesia
– Oman
– China
– Russia
– Bahrain
– Saudi Arabia
– Rest of the World
2) The report also offers SPENDING ($), and PRODUCTION (bpd) forecasts 2017-2027, plus analysis, for 5 thermal EOR submarkets:
– Oil Sands
– Heavy Oil
– Steam Injection
– SAGD
– Other Technologies
3) The report also offers visiongain’s oil price forecast for the period between 2017 and 2027
– Supply-side factors
– Demand-side factors
– Other Major Variables that Impact the Oil Price
– Visiongain’s Oil Price Assumption and Forecast
– How the Oil Price Will Impact the Thermal EOR Market
4) The analysis is underpinned by our exclusive interviews from solar EOR pioneer GlassPoint:
– Oil Prices and Thermal EOR
– The Miraah Project
– Regions Particularly Suitable for Solar EOR
5) The report provides market share and detailed profiles of the leading companies operating within the Thermal Oil Sands and Thermal Heavy Oil EOR market:
– ConocoPhillips
– Cenovus
– China National Offshore Oil Corporation (CNOOC)
– Imperial Oil
– Suncor
– Chevron
– PDVSA
– Husky Energy
– Sinopec
– Occidental
This independent 192-page report guarantees you will remain better informed than your competitors. With 134 tables and figures that analyse the global market, five submarkets, ten leading national markets and the rest of the world market. The report also contains profiles and analysis of ten leading companies, and the transcript of an exclusive interview with solar EOR pioneer GlassPoint is also provided. This report will keep your knowledge that one step ahead of your rivals.
The Thermal Enhanced Oil Recovery (EOR) Market 2017-2027 report will be of value to anyone who wants to better understand the industry and its dynamics. It will be useful for businesses already involved in a segment of the thermal EOR market, or those wishing to enter this growing market in the future.
Visiongain is a trading partner with the US Federal Government
CCR Ref number: KD4R6
1. Executive Summary
1.1 Global Thermal Enhanced Oil Recovery (EOR) Market Overview
1.2 Market Structure Overview and Market Definition
1.3 Methodology
1.4 Why You Should Read This Report
1.5 How This Report Delivers
1.6 Key Questions Answered by this Analytical Report Include:
1.7 Who is this Report For?
1.8 Frequently Asked Questions (FAQ)
1.9 Associated Visiongain Reports
1.10 About Visiongain
2. Introduction to the Thermal EOR Market
2.1 Stages of Oil Extraction
2.1.1 Primary Recovery
2.1.2 Secondary Recovery
2.1.3 Tertiary Recovery
2.2 Thermal EOR Processes
2.2.1 Steam Injection
2.2.1.1 Steam Flooding
2.2.1.2 Cyclic Steam Stimulation (CSS)
2.2.2 Steam-Assisted Gravity Drainage
2.2.3 Small-Scale Commercial EOR Technologies
2.2.3.1 In-Situ Combustion
2.2.3.2 Thermally Assisted Gas-Oil Gravity Drainage (TAGOGD)
2.2.3.3 Thermal-Assisted Gravity Drainage (TAGD)
2.2.3.4 Toe-to-Heel Air Injection (THAI®)
2.2.3.5 Solar EOR
2.2.3.6 Electro-Thermal Dynamic Stripping Process (ET-DSP™)
2.2.3.7 Synchronised Thermal Additional Recovery (STAR)
2.2.4 Other Thermal EOR Technologies
2.2.4.1 Expanding Solvent Steam-Assisted Gravity Drainage (ES-SAGD)
2.2.4.2 Steam and Gas Push (SAGP)
2.2.4.3 Controlled Atmospheric Pressure Resin Infusion (CAPRI)
2.2.4.4 Combustion Overhead Gravity Drainage (COGD)
2.3 Unconventional Oil and the Thermal EOR Market
2.3.1 Heavy Oil
2.3.2 Oil Sands
2.4 Thermal EOR Economics
3. The Global Thermal EOR Market 2017-2027
3.1 Global Thermal EOR Market Forecast 2017-2027
3.1.1 Capital and Operational Expenditure Forecasts
3.1.2 Production Forecast
3.2 Global Thermal EOR Market Analysis
3.3 Visiongain’s Oil Price Analysis
3.3.1 Visiongain’s Oil Price Analysis
3.3.1.1 Supply-Side Factors
3.3.1.2 Demand-Side Factors
3.3.1.3 Other Major Variables that Impact the Oil Price
3.3.1.4 Visiongain’s Oil Price Assumptions and Forecast
3.4 Drivers and Restraints in the Thermal EOR Market
3.4.1 Thermal EOR Market Drivers
3.4.1.1 Increasing Oil Demand
3.4.1.2 Unconventional Oil
3.4.2 Thermal EOR Market Restraints
3.4.2.1 High Costs
3.4.2.2 Transportation Issues
3.4.2.3 Environmental Concerns
3.4.2.5 Carbon Taxation
4. Thermal EOR Submarkets 2017-2027
4.1 Will the Oil Sands or Other Areas Provide the Strongest Growth?
4.1.1 The Oil Sands Thermal EOR Submarket Forecast 2017-2027
4.1.1.1 Current and Future In-Situ Oil Sands Production
4.1.1.2 Regulatory Climate
4.1.1.3 New and Alternative Transportation Solutions
4.1.1.4 Narrowing Price Differential Between WTI and WCS
4.1.1.5 Stricter Foreign Investment/ Regulations
4.1.1.6 High Water Demand
4.1.2 The Thermal Heavy Oil EOR Submarket Forecast 2017-2027
4.1.2.1 Heavy Oil Potential
4.1.2.2 Global Heavy Oil Resources
4.1.2.3 Current and Future Growth Areas
4.1.2.4 Potential Restraints on the Thermal Steam Heavy Oil Market
4.2 Which Technology Submarket Will Provide the Strongest Growth?
4.2.1 The Steam Injection Submarket Forecast 2017-2027
4.2.1.1 Leading Global Steam Injection Projects
4.2.1.2 Duri
4.2.1.3 Cold Lake
4.2.1.4 Primrose
4.2.1.5 Shengli
4.2.1.6 Midway-Sunset
4.2.2 The SAGD Submarket Forecast 2017-2027
4.2.2.1 Leading Global SAGD Projects
4.2.2.2 Firebag
4.2.2.4 Foster Creek and Christina Lake
4.2.2.3 Mukhaizna
4.2.2.5 Jackfish
4.2.3 Other EOR Technologies Submarket Forecast 2017-2027
4.2.3.1 Leading Global Other EOR Projects
4.2.3.2 Qarn Alam
4.2.3.3 Saleski Pilot
5. The Leading National Thermal EOR Market Forecasts 2017-2027
5.1 The Canadian Thermal EOR Market Forecast 2017-2027
58.1 The Five Leading Companies in the Thermal Oil Sands EOR Market – Market Shares and Profiles
8.1.1 Suncor
8.1.2 ConocoPhillips
8.1.3 Imperial Oil
8.1.4 Cenovus
8.1.5 China National Offshore Oil Corporation (CNOOC)
8.2 The Five Leading Companies in the Thermal Heavy Oil EOR Market – Market Shares and Profiles
8.2.1 Chevron Corporation
8.2.2 PDVSA
8.2.3 Husky Energy
8.2.4 Sinopec
8.2.5 Occidental
8.3 Other Leading Companies in the Thermal EOR Market
9. Conclusions and Recommendations
9.1 EOR Market Outlook
9.2 Key Findings in the Thermal EOR Market
9.3 Recommendations for the Thermal EOR Market
10. Glossary
Appendix
Associated Visiongain Reports
Visiongain Report Sales Order Form
Appendix A
Appendix B
Visiongain Report Evaluation Form
List of Tables
Table 1.1 Comparison of Oil Grading By Leading International Agencies (⁰API, Viscosity cP)
Table 1.2 Leading National Thermal EOR Market Forecast 2017-2027 (Spending $m, AGR %, Cumulative)
Table 3.1 Global Thermal EOR Market Forecast 2017-2027 ($bn, AGR %, CAGR %, Cumulative)
Table 3.2 Leading National Thermal EOR Market Forecast 2017-2027 (Spending $m, AGR %, Cumulative)
Table 3.3 Global Thermal EOR Market Forecast CAPEX and OPEX 2017-2027 ($bn, AGR %, Cumulative)
Table 3.4 Global Thermal EOR Market Production Forecast 2017-2027 (MMbpd, AGR %)
Table 3.5 Visiongain’s Anticipated Brent Crude Oil Price, 2017, 2018, 2019-2021, 2022- 2024, 2025-2027 ($/bbl)
Table 3.6 Global Thermal EOR Market Drivers and Restraints
Table 4.1 Oil Sands and Non-Oil Sands Submarket Forecasts 2017-2027 ($m, MMbpd, AGR%)
Table 4.2 Oil Sands Forecast 2017-2027 (CAPEX and OPEX $m, AGR %, CAGR %, Cumulative)
Table 4.3 Thermal Heavy Oil Forecast 2017-2027 (Production MMbpd, CAPEX and OPEX $m, AGR %, CAGR %)
Table 4.4 Thermal EOR Submarket Forecasts 2017-2027 (MMbpd, $m, AGR %, Cumulative)
Table 4.6 Top 5 Steam Injection Projects (Company, Project, bpd, Country, Resource)
Table 4.7 SAGD Submarket Forecast 2017-2027 (CAPEX and OPEX $m, AGR %, CAGR %, Cumulative)
Table 4.8 Top 5 SAGD Projects (Company, Project, bpd, Country, Resource)
Table 4.9 Other EOR Technologies Submarket Forecast 2017-2027 (CAPEX and OPEX $m, AGR %, CAGR %, Cumulative)
Table 4.10 Top 2 Other EOR Technologies Projects (Company, Project, bpd, Country, Method)
Table 5.1 Leading National Thermal EOR Market Forecast 2017-2027 (Spending $m, AGR %)
Table 5.2 Canadian Thermal EOR Market Forecast 2017-2027 (MMbpd production, CAPEX and OPEX $m, AGR %, CAGR %)
Table 5.3 Operational Thermal Oil Sands Projects (Company Name, Project Name, Technology, BPD Capacity, Current BPD)
Table 5.4 Canadian Thermal Heavy Oil Market Forecast 2017-2027 (Mbpd production, CAPEX and OPEX $m, AGR %, CAGR %)
Table 5.5 Operational Canadian Thermal Heavy Oil Projects (Company Name, Project Name, Technology, BPD Capacity, Current BPD)
Table 5.6 Planned Thermal Oil Sands Projects (Company Name, Project Name, Technology, bpd Capacity, Start Date)
Table 5.7 U.S. Thermal EOR Market Forecast 2016-2026 (Mbpd Production, CAPEX and OPEX $m AGR %, CAGR %)
Table 5.8 U.S. Thermal EOR Production (Company, Project Location, Production [bpd], Technology)
Table 5.9 Venezuelan Thermal EOR Market Forecast 2017-2027 (Mbpd production, CAPEX and OPEX $m, AGR %, CAGR %)
Table 5.10 Venezuelan Thermal EOR Production (Company, Project Location, Production [bpd], Technology)
Table 5.11 Indonesian Thermal EOR Market Forecast 2017-2027 (Mbpd production, CAPEX and OPEX $m, AGR %, CAGR %)
Table 5.12 Kuwaiti Thermal EOR Market Forecast 2017-2027 (Mbpd production, CAPEX and OPEX $m, AGR %, CAGR %)
Table 5.13 Omani Thermal EOR Market Forecast 2017-2027 (Mbpd production, CAPEX and OPEX $m, AGR %, CAGR %)
Table 5.14 Omani Thermal EOR Production (Company, Project Location, Production [bpd], Technology)
Table 5.15 Chinese Thermal EOR Market Forecast 2017-2027 (Mbpd production, CAPEX and OPEX $m, AGR %, CAGR %)
Table 5.16 Russian Thermal EOR Market Forecast 2017-2027 (Mbpd production, CAPEX and OPEX $m, AGR %, CAGR %)
2025
Table 5.17 Bahraini Thermal EOR Market Forecast 2017-2027 (Mbpd production, CAPEX and OPEX $m, AGR %, CAGR %)
Table 5.18 Saudi Arabian Thermal EOR Market Forecast 2017-2027 (Mbpd production, CAPEX and OPEX $m, AGR %, CAGR %)
Table 5.19 Rest of the World Thermal EOR Market Forecast 2017-2027 (Mbpd production, CAPEX and OPEX $m, AGR %, CAGR %)
Table 6.1 PEST Analysis of the Thermal EOR Market 2017-2027
Table 8.1 Five Leading Companies in the Thermal Oil Sands EOR Market (Rank, 2017 Spending $m, Market Share %)
Table 8.2 Overview of Suncor in the Thermal Oil Sands EOR Market: Headquarters, Employees, Stock Exchange, Current Thermal Oil Sands EOR Spending ($m), Current Market Share (%)
Table 8.3 Overview of ConocoPhillips in the Thermal Oil Sands EOR Market: Headquarters, Employees, Stock Exchange, 2017 Thermal Oil Sands EOR Spending ($m), Current Market Share (%)
Table 8.4 Overview of Imperial Oil in the Thermal Oil Sands EOR Market: Headquarters, Employees, Stock Exchange, 2016 Thermal Oil Sands EOR Spending ($m), Current Market Share (%)
Table 8.5 Overview of Cenovus in the Thermal Oil Sands EOR Market: Headquarters, Employees, Stock Exchange, 2016 Thermal Oil Sands EOR Spending ($m), Current Market Share (%)
Table 8.6 Overview of CNOOC in the Thermal Oil Sands EOR Market: Headquarters, Employees, Stock Exchange, 2017 Thermal Oil Sands EOR Spending ($m), Current Market Share (%)
Table 8.7 Leading Five Companies in the Thermal Heavy Oil EOR Market (Rank, 2016 Spending $m, Current Market Share %)
Table 8.8 Overview of Chevron in the Thermal Heavy Oil EOR Market: Headquarters, Employees, Stock Exchange, 2016 Thermal Heavy Oil EOR Spending ($m), Current Market Share (%)
Table 8.9 Overview of PDVSA in the Thermal Heavy Oil EOR Market: Headquarters, Employees, Stock Exchange, 2016 Thermal Heavy Oil EOR Spending ($m), Current Market Share (%)
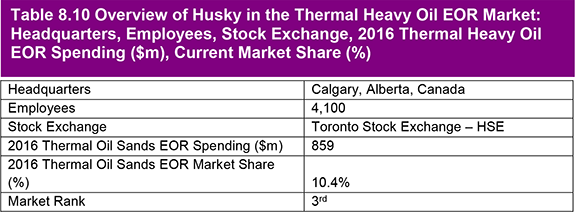
Table 8.10 Overview of Husky in the Thermal Heavy Oil EOR Market: Headquarters, Employees, Stock Exchange, 2016 Thermal Heavy Oil EOR Spending ($m), Current Market Share (%)
Table 8.11 Overview of Sinopec in the Thermal Heavy Oil EOR Market: Headquarters, Employees, Stock Exchange, 2016 Thermal Heavy Oil EOR Spending ($m), Current Market Share (%)
Table 8.12 Overview of Occidental Petroleum in the Thermal Heavy Oil EOR Market: Headquarters, Employees, Stock Exchange, 2016 Thermal Heavy Oil EOR Spending ($m), Current Market Share (%)
Table 8.13 Other Leading Companies in the Thermal EOR Market 2016 (Company, Sector, Technology)
List of Figures
Figure 1.1 Global Oil and Gas Consumption Forecasts 2015-2035 (MMtoe)
Figure 1.2 Global Thermal EOR Market Structure Overview
Figure 2.1 USGS Survey Of Global Heavy Oil Resources by Region (Billion Barrels)
Figure 2.2 World Map of Bitumen Reserves (Million Barrels of Bitumen)
Figure 3.1 Global Thermal EOR Market Forecast 2017-2027 ($bn, AGR %)
Figure 3.2 Global Thermal EOR Market and Submarket CAGRs (%), 2017-2022, 2022-2027 and 2017-2027
Figure 3.3 Total Spending by Leading National Thermal EOR Markets, 2017-2027 ($bn)
Figure 3.4 Global Thermal EOR Market CAPEX Forecast 2017-2027 ($bn, AGR %)
Figure 3.6 WTI and Brent Oil Prices 2004-2016 ($/bbl)
Figure 3.7 Weekly WTI and Brent Oil Prices June-2014 – April-2017 ($/bbl)
Figure 3.8 Chinese and Indian Annual GDP Growth Rates, 2006-2017 (%)
Figure 3.9 U.S. Refined Product Consumption January-2015 to July-2016 Four-Week Average (Mbpd)
Figure 3.10 Visiongain’s Anticipated Brent Crude Oil Price, 2017, 2018, 2019-2021, 2022-2024, 2025-2027 ($/bbl)
Figure 4.1 Thermal EOR Submarket Production Share Forecasts, 2017 (%)
Figure 4.2 Thermal EOR Submarket Production Share Forecasts, 2022 (%)
Figure 4.3 Thermal EOR Submarket Production Share Forecasts, 2027 (%)
Figure 4.4 Thermal EOR Submarket Forecasts 2017-2027 ($m)
Figure 4.5 Thermal EOR Submarket Spending Share, 2017-2027 (%)
Figure 4.6 Oil Sands Forecast 2017-2027 ($m, AGR %)
Figure 4.8 Oil Sands Production Forecast 2017-2027 (MMbpd, AGR %)
Figure 4.9 Oil Sands CAPEX and OPEX Forecasts, 2017-2027 ($m)
Figure 4.10 Benchmark Oil Prices, June-2014 to April-2017($/bbl)
Figure 4.11 Map of US Petroleum Administration for Defense Districts (PADD)
Figure 4.12 Thermal Heavy Oil Forecast 2017-2027 ($m, AGR %)
Figure 4.13 Thermal Heavy Oil Market Share Forecast 2017, 2022, and 2027 (% Share)
Figure 4.14 Thermal Heavy Oil Production Forecast, 2017-2027 (MMbpd)
Figure 4.15 Thermal Heavy Oil CAPEX and OPEX Forecasts, 2017-2027 ($m)
Figure 4.16 Conventional Oil Discovery History 1960-2012 (Billion Barrels)
Figure 4.17 USGS Survey of Global Heavy Oil Resources by Region (Billion Bbls)
Figure 4.19 Thermal EOR Submarkets Share Forecast, 2022 (%)
Figure 4.20 Thermal EOR Submarkets Share Forecast, 2027 (%)
Figure 4.21 Thermal EOR Submarket Forecasts 2017-2027 (Spending $m)
Figure 4.22 Thermal EOR Submarkets Cumulative Spending 2017-2027 ($m)
Figure 4.23 Steam Injection Submarket Forecast 2017-2027 ($m, AGR %)
Figure 4.24 Steam Injection Market Share Forecast, 2017, 2022 and 2027 (% Share)
Figure 4.25 Steam Injection Production Forecast, 2017-2027 (MMbpd)
Figure 4.26 Steam Injection CAPEX and OPEX Forecasts, 2017-2027 ($m)
Figure 4.27 SAGD Submarket Forecast 2017-2027 ($m, AGR %)
Figure 4.28 SAGD Market Share Forecast, 2017, 2022 and 2027 (% Share)
Figure 4.29 SAGD Production Forecast, 2017-2027 (MMbpd)
Figure 4.30 SAGD CAPEX and OPEX Forecasts, 2017-2027 ($m)
Figure 4.31 Other EOR Technologies Submarket Forecast 2017-2027 ($m, AGR %)
Figure 4.32 Other EOR Technologies Market Share Forecast, 2017, 2022 and 2027 (% Share)
Figure 4.33 Other EOR Technologies Production Forecast, 2017-2027 (MMbpd)
Figure 4.34 Other EOR Technologies CAPEX and OPEX Forecasts, 2017-2027 ($m)
Figure 5.1 Leading National Thermal EOR Market Forecasts 2017-2027 ($m)
Figure 5.2 Leading National Thermal EOR Markets Share Forecast, 2017 (%)
Figure 5.3 Leading National Thermal EOR Markets Share Forecast, 2022 (%)
Figure 5.4 Leading National Thermal EOR Markets Share Forecast, 2027 (%)
Figure 5.5 Leading National Thermal EOR Markets CAGR Forecast, 2017-2027 (%)
Figure 5.6 Leading National Thermal EOR Markets Cumulative Spending Forecast 2017-2027 ($m)
Figure 5.7 Canadian Thermal EOR Market Forecast 2017-2027 ($m, AGR %)
Figure 5.8 Canadian Thermal EOR Market Share Forecast, 2017, 2022 and 2027 (% Share)
Figure 5.9 Canadian Oil Sands Deposits in Alberta
Figure 5.10 Canadian Thermal Heavy Oil Market Forecast 2017-2027 ($m, AGR %)
Figure 5.11 Canadian Thermal Heavy Oil Market Share Forecast, 2017, 2022 and 2027 (% Share)
Figure 5.12 U.S. Thermal EOR Market Forecast 2017-2027 ($m, AGR %)
Figure 5.13 U.S. Thermal EOR Market Share Forecast, 2017, 2022 and 2027 (% Share)
Figure 5.15 Venezuelan Thermal EOR Market Forecast 2017-2027 ($m, AGR %)
Figure 5.16 Venezuelan Thermal EOR Market Share Forecast, 2017, 2022 and 2027 (% Share)
Figure 5.17 Venezuela Oil Production 1980-2016 (Mbpd) and Reserves 1980-2016 (Billion Bbls)
Figure 5.18 Indonesian Thermal EOR Market Forecast 2017-2027 ($m, AGR %)
Figure 5.19 Indonesian Thermal EOR Market Share Forecast, 2017, 2022 and 2027 (% Share)
Figure 5.20 Indonesian Oil Production and Proven Reserves 1990-2014 (Mbpd, Billion bpd)
Figure 5.21 Kuwaiti Thermal EOR Market Forecast 2017-2027 ($m, AGR %)
Figure 5.22 Kuwaiti Thermal EOR Market Share Forecast, 2017, 2022 and 2027 (% Share)
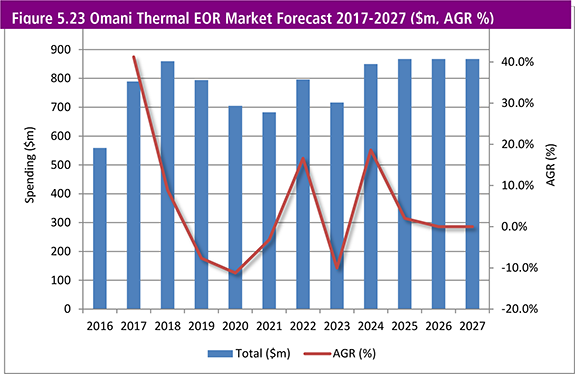
Figure 5.23 Omani Thermal EOR Market Forecast 2017-2027 ($m, AGR %)
Figure 5.24 Omani Thermal EOR Market Share Forecast, 2017, 2022 and 2027 (% Share)
Figure 5.25 Omani Oil Production 1980-2016 (Thousand barrels)
Figure 5.26 Chinese Thermal EOR Market Forecast 2017-2027 ($m, AGR %)
Figure 5.27 Chinese Thermal EOR Market Share Forecast, 2017, 2022 and 2027 (% Share)
Figure 5.28 Russian Thermal EOR Market Forecast 2017-2027 ($m, AGR %)
Figure 5.29 Russian Thermal EOR Market Share Forecast, 2017, 2022 and 2027 (% Share)
Figure 5.30 Bahraini Thermal EOR Market Share Forecast, 2017, 2022 and 2027 (% Share)
Figure 5.31 Bahraini Thermal EOR Market Forecast 2017-2027 ($m, AGR %)
Figure 5.32 Saudi Arabian Thermal EOR Market Forecast 2017-2027 ($m, AGR %)
Figure 5.33 Saudi Arabian Thermal EOR Market Share Forecast, 2017, 2022 and 2027 (% Share)
Figure 5.34 Rest of the World Thermal EOR Market Forecast 2017-2027 ($m, AGR%)
Figure 5.35 Rest of the World Thermal EOR Market Share Forecast, 2017, 2022 and 2027 (% Share)
Figure 8.1 Five Leading Companies in the Thermal Oil Sands EOR Market (2017 Spending $m)
Figure 8.2 Five Leading Companies in the Thermal Oil Sands EOR Market (Market Share %)
Figure 8.3 Leading Five Companies in the Thermal Heavy Oil EOR Market (2016 Spending $m)
Figure 8.4 Leading Five Companies in the Thermal Heavy Oil EOR Market (Market Share %)


