Next Generation Sequencing – our new study reveals trends, R&D progress, and predicted revenues
Where is the Next Generation Sequencing market heading? If you are involved in this sector you must read this newly updated report. Visiongain’s report shows you the potential revenues streams to 2027, assessing data, trends, opportunities and business prospects there.
Discover how to stay ahead
Our 248-page report provides 192 tables, charts, and graphs. Read on to discover the most lucrative areas in the industry and the future market prospects. Our new study lets you assess forecasted sales at overall world market and regional level. See financial results, trends, opportunities, and revenue predictions. Much opportunity remains in this growing Next Generation Sequencing market. See how to exploit the opportunities.
Forecasts to 2027 and other analyses reveal the commercial prospects
• In addition to revenue forecasting to 2027, our new study provides you with recent results, growth rates, and market shares.
• You find original analyses, with business outlooks and developments.
• Discover qualitative analyses (including market dynamics, drivers, opportunities, restraints and challenges), product profiles and commercial developments.
Discover sales predictions for the world market and submarkets
Along with revenue prediction for the overall world market, there are 4 segmentations of the Next Generation Sequencing market, with forecasts for 7 Applications, 8 Technologies, 3 Product Types and 5 End Users, each forecasted at a global and regional level.
Global Next Generation Sequencing Market by Application
• Drug Discovery
• Genetic Screening
• Diagnostics
• Personalized Medicine
• Agriculture and Animal Research
• Infectious Diseases
• Others
Global Next Generation Sequencing Market by Technology
• Whole-Genome Sewuencing
• Targeted Re-Sequencing
• Exome Sequencing
• RNA Seq
• Chip Seq
• De Novo Sequencing
• Methyl Seq
• Others
Global Next Generation Sequencing Market by Product
• Instruments
• Reagents & Consumables
• Services
Global Next Generation Sequencing Market by End User
• Hospital & Healthcare Institution
• Academics
• Biotechnology
• Pharmaceutical
• Others
In addition to the revenue predictions for the overall world market and segments, you will also find revenue forecasts for 7 regional and 17 leading national markets:
• North America:
• US
• Canada
• Latin America:
• Brazil
• Mexico
• Rest of Latin America
• Western Europe:
• Germany
• The UK
• Italy
• France
• Spain
• Nordic
• Benelux
• Rest of Western Europe
• Eastern Europe:
• Russia
• Poland
• Rest of Eastern Europe
• Asia-Pacific:
• Japan
• China
• India
• Australia & New Zealand
• ASEAN
• Rest of Asia-Pacific
• MEA:
• GCC Countries
• South Africa
• Northern Africa
• Rest of MEA
The report also includes profiles and for some of the leading companies in the Next Generation Sequencing market, with a focus on this segment of these companies’ operations.
There will be growth in both established and in developing countries. Our analyses show that the both developed and developing markets, Russia, Germany and China in particular, will continue to achieve high revenue growth to 2027.
Leading companies and the potential for market growth
Overall world revenue for Next Generation Sequencing will surpass $5.6bn in 2017, our work calculates. We predict strong revenue growth through to 2027.
Our work identifies which organisations hold the greatest potential. Discover their capabilities, progress, and commercial prospects, helping you stay ahead.
How the Next Generation Sequencing Market report helps you
In summary, our 248-page report provides you with the following knowledge:
• Revenue forecasts to 2027 for 3 segmentations of the Next Generation Sequencing market, with forecasts for 7 Applications, 8 Technologies, 3 Products and 5 End Users Marine Derived Drug Types, 3 Sources and 5 Applications, each forecasted at a global and regional level – discover the industry’s prospects, finding the most lucrative places for investments and revenues
• Revenue forecasts to 2027 for 6 regional and 21 key national markets – See forecasts for the Next Generation Sequencing market in North America, Latin America, Western Europe, Eastern Europe, Asia-Pacific and MEA. Also forecasted is the market in the US, Canada, Mexico, Brazil, Germany, France, the UK, Italy, France, Nordic Countries, Benelux, China, India, Japan, Australia & New Zealand, ASEAN countries, GCC Countries, South Africa and Northern Africa.
• Stimulates and restrains companies and the market
• Prospects for established firms and those seeking to enter the market – including company profiles for 10 of the major companies involved in the Next Generation Sequencing market
Find quantitative and qualitative analyses with independent predictions. Receive information that only our report contains, staying informed with this invaluable business intelligence.
Information found nowhere else
With our newly report title, you are less likely to fall behind in knowledge or miss out on opportunities. See how our work could benefit your research, analyses, and decisions.
Visiongain’s study is for everybody needing commercial analyses for the Next Generation Sequencing market and leading companies. You will find data, trends and predictions.
Get our report today The Next Generation Sequencing Market Forecast 2017-2027: Revenue Prospects by Application (Drug Discovery, Genetic Screening, Diagnostics, Personalized Medicine, Agriculture And Animal Research, Infectious Diseases, Others) Technology (Whole-Genome Sequencing, Targeted Re-Sequencing, Exome Sequencing, RNA Seq, Chip Seq, De Novo Sequencing, Methyl Seq, Others), Products (Instruments, Reagents & Consumables, Services), End User (Hospital & Healthcare Institution, Academics, Biotechnology, Pharmaceutical, Others) and Geography.
Visiongain is a trading partner with the US Federal Government
CCR Ref number: KD4R6
1. Report Overview
1.1 Introduction
1.2 Why You Should Read This Report
1.3 Key Questions Answered by This Analytical Report
1.4 Who is This Report For?
1.5 Methodology
1.6 Frequently Asked Questions (FAQ)
1.7 Associated Visiongain Reports
1.8 About Visiongain
2 Next-Generation Sequencing Market Overview
2.1 Introduction
2.1.1 Market Definition
2.1.2 Market Taxonomy
2.2 Global Next-Generation Sequencing Market Size and Forecast
2.3 Market Dynamics
2.3.1 Global NGS Market: Drivers
2.3.1.1 Technological Advancements in Sequencing Platforms
2.3.1.2 Increasing Applications of NGS
2.3.1.3 Minimizing Growing Number of Partnerships and Collaborations
2.3.1.4 Increasing Adoption of NGS Technologies among Research Laboratories and Academic Institutes
2.3.1.5 Conferences and Workshops Increasing Awareness on NGS Products and Services
2.3.2 Global Next-Generation Sequencing Market: Restraints
2.3.2.1 Dearth of Skilled Professionals
2.3.2.2 Difficulties in Storage of Sequencing Data
2.3.3 Global Next-Generation Sequencing Market: Opportunity
2.3.3.1 Government Initiatives in Population Sequencing
2.3.3.2 Application of NGS in Precision Medicine & Biomarker Discovery
2.3.3.3 Emerging Markets Offer Significant Growth Opportunities
2.3.3.4 Cloud Computing, A Prospective Service
2.3.4 Global Next-Generation Sequencing Market: Trends
2.3.4.1 Integration of Next-Generation Sequencing with Cloud-Based Technology
2.3.4.2 Focus on Cancer Research
2.3.4.3 Mergers and Acquisitions
2.3.4.4 Entry of New Market Players
3 Global Next-Generation Sequencing Market Analysis and Forecast, By Application
3.1 Introduction
3.1.1 Global NGS Market, Annual Growth Rate Comparison, By Application
3.2 Global Next-Generation Sequencing Market Size and Forecast, By Application
3.2.1 Drug Discovery Segment
3.2.2 Genetic Screening Segment
3.2.3 Diagnostics
3.2.4 Personalized Medicine
3.2.5 Agriculture & Animal Research
3.2.6 Infectious Diseases
3.2.7 Others
3.3 Global Next-Generation Sequencing Attractiveness Index, By Application
4 Global Next-Generation Sequencing Market Analysis and Forecast, By Technology
4.1 Introduction
4.1.1 Global Next-Generation Sequencing Market, Annual Growth Rate Comparison, By Technology
4.2 Global Next-Generation Sequencing Market Size and Forecast, By Technology
4.2.1 Whole-Genome Sequencing Segment
4.2.2 Targeted Re-Sequencing Segment
4.2.3 Exome Sequencing Segment
4.2.4 RNA Seq Segment
4.2.5 Chip Seq Segment
4.2.6 De Novo Sequencing Segment
4.2.7 Methyl Seq Segment
4.2.8 Others Segment
4.3 Global NGS Market Attractiveness Index, By Technology
5 Global NGS Market Analysis and Forecast, By Products
5.1 Introduction
5.1.1 Global NGS Market, Annual Growth Rate Comparison, By Products
5.2 Global NGS Market Size and Forecast, By Products
5.2.1 Instruments Segment
5.2.2 Reagents & Consumables Segment
5.2.3 Services Segment
5.3 Global NGS Market Attractiveness Index, By Products
6 Global NGS Market Analysis and Forecast, By End User
6.1 Introduction
6.1.1 Global NGS Market, Annual Growth Rate Comparison, By End User
6.2 Global NGS Market Size and Forecast, By End User
6.2.1 Hospital & Healthcare Institution Segment
6.2.2 Academics Segment
6.2.3 Biotechnology Segment
6.2.4 Pharmaceutical Segment
6.2.5 Others Segment
6.3 Global NGS Market Attractiveness Index, By End User
7 Global NGS Market Analysis and Forecast, By Region
7.1 Introduction
7.1.1 Global NGS Market, Annual Growth Rate Comparison, By Region
7.2 Global NGS Market Size and Forecast, By Region
7.2.1 North America
7.2.2 Latin America
7.2.3 Western Europe
7.2.4 Eastern Europe
7.2.5 Asia Pacific
7.2.6 MEA
7.3 Global NGS Market Attractiveness Index, By Region
8 North America NGS Market Analysis and Forecast, 2016–2027
8.1 Introduction
8.1.1 North America NGS Market
8.1.2 North America NGS Market, Annual Growth Rate Comparison, By Country
8.2 North America NGS Market Size and Forecast, By Country
8.2.1 The U.S. NGS Market
8.2.2 Canada NGS Market
8.3 North America NGS Market Size and Forecast, By Application
8.4 North America NGS Market Size and Forecast, By Technology
8.5 North America NGS Market Size and Forecast, By Products
8.6 North America NGS Market Size and Forecast, By End User
8.7 North America NGS Market Attractiveness Index
8.7.1 North America NGS Market Attractiveness Index, By Country
8.7.2 North America NGS Market Attractiveness Index, By Application
8.7.3 North America NGS Market Attractiveness Index, By Technology
8.7.4 North America NGS Market Attractiveness Index, By Products
8.7.5 North America NGS Market Attractiveness Index, By End User
9 Latin America NGS Market Analysis and Forecast, 2016–2027
9.1 Introduction
9.1.1 Latin America NGS Market
9.1.2 Latin America NGS Market, Annual Growth Rate Comparison, By Country
9.2 Latin America NGS Market Size and Forecast, By Country
9.2.1 Brazil NGS Market
9.2.2 Mexico NGS Market
9.2.3 Rest of Latin America NGS Market
9.3 Latin America NGS Market Size and Forecast, By Application
9.4 Latin America NGS Market Size and Forecast, By Technology
9.5 Latin America NGS Market Size and Forecast, By Products
9.6 Latin America NGS Market Size and Forecast, By End User
9.7 Latin America NGS Market Attractiveness Index
9.7.1 Latin America NGS Market Attractiveness Index, By Country
9.7.2 Latin America NGS Market Attractiveness Index, By Application
9.7.3 Latin America NGS Market Attractiveness Index, By Technology
9.7.4 Latin America NGS Market Attractiveness Index, By Products
9.7.5 Latin America NGS Market Attractiveness Index, By End User
10 Western Europe NGS Market Analysis and Forecast, 2017–2027
10.1 Introduction
10.1.1 Western Europe NGS Market
10.1.2 Western Europe NGS Market, Annual Growth Rate Comparison, By Country
10.2 Western Europe NGS Market Size and Forecast, By Country
10.2.1 U.K. NGS Market
10.2.2 France NGS Market
10.2.3 Germany NGS Market
10.2.4 Italy NGS Market
10.2.5 Spain NGS Market
10.2.6 Nordic NGS Market
10.2.7 Benelux NGS Market
10.2.8 Rest of Western Europe NGS Market
10.3 Western Europe NGS Market Size and Forecast, By Application
10.4 Western Europe NGS Market Size and Forecast, By Technology
10.5 Western Europe NGS Market Size and Forecast, By Products
10.6 Western Europe NGS Market Size and Forecast, By End User
10.7 Western Europe NGS Market Attractiveness Index
10.7.1 Western Europe NGS Market Attractiveness Index, By Country
10.7.2 Western Europe NGS Market Attractiveness Index, By Application
10.7.3 Western Europe NGS Market Attractiveness Index, By Technology
10.7.4 Western Europe NGS Market Attractiveness Index, By Products
10.7.5 Western Europe NGS Market Attractiveness Index, By End User
11 Eastern Europe NGS Market Analysis and Forecast, 2017–2027
11.1 Introduction
11.1.1 Eastern Europe NGS Market
11.1.2 Eastern Europe NGS Market, Annual Growth Rate Comparison, By Country
11.2 Eastern Europe NGS Market Size and Forecast, By Country
11.2.1 Russia NGS Market
11.2.2 Poland NGS Market
11.2.3 Rest of Eastern Europe NGS Market
11.3 Eastern Europe NGS Market Size and Forecast, By Application
11.4 Eastern Europe NGS Market Size and Forecast, By Technology
11.5 Eastern Europe NGS Market Size and Forecast, By Products
11.6 Eastern Europe NGS Market Size and Forecast, By End User
11.7 Eastern Europe NGS Market Attractiveness Index
11.7.1 Eastern Europe NGS Market Attractiveness Index, By Country
11.7.2 Eastern Europe NGS Market Attractiveness Index, By Application
11.7.3 Eastern Europe NGS Market Attractiveness Index, By Technology
11.7.4 Eastern Europe NGS Market Attractiveness Index, By Products
11.7.5 Eastern Europe NGS Market Attractiveness Index, By End User
12 Asia Pacific NGS Market Analysis and Forecast, 2017–2027
12.1 Introduction
12.1.1 Asia Pacific NGS Market
12.1.2 Asia Pacific NGS Market, Annual Growth Rate Comparison, By Country
12.2 Asia Pacific NGS Market Size and Forecast, By Country
12.2.1 China NGS Market
12.2.2 India NGS Market
12.2.3 Australia and New Zealand NGS Market
12.2.4 ASEAN NGS Market
12.2.5 Japan NGS Market
12.2.6 Rest of Asia Pacific NGS Market
12.3 Asia Pacific NGS Market Size and Forecast, By Application
12.4 Asia Pacific NGS Market Size and Forecast, By Technology
12.5 Asia Pacific NGS Market Size and Forecast, By Products
12.6 Asia Pacific NGS Market Size and Forecast, By End User
12.7 Asia Pacific NGS Market Attractiveness Index
12.7.1 Asia Pacific NGS Market Attractiveness Index, By Country
12.7.2 Asia Pacific NGS Market Attractiveness Index, By Application
12.7.3 Asia Pacific NGS Market Attractiveness Index, By Technology
12.7.4 Asia Pacific NGS Market Attractiveness Index, By Products
12.7.5 Asia Pacific NGS Market Attractiveness Index, By End User
13 MEA NGS Market Analysis and Forecast, 2017–2027
13.1 Introduction
13.1.1 MEA NGS Market
13.1.2 MEA NGS Market, Annual Growth Rate Comparison, By Country
13.2 MEA NGS Market Size and Forecast, By Country
13.2.1 GCC Countries NGS Market
13.2.2 South Africa NGS Market
13.2.3 North Africa NGS Market
13.2.4 Rest of MEA NGS Market
13.3 MEA NGS Market Size and Forecast, By Application
13.4 MEA NGS Market Size and Forecast, By Technology
13.5 MEA NGS Market Size and Forecast, By Products
13.6 MEA NGS Market Size and Forecast, By End User
13.7 MEA NGS Market Attractiveness Index
13.7.1 MEA NGS Market Attractiveness Index, By Country
13.7.2 MEA NGS Market Attractiveness Index, By Application
13.7.3 MEA NGS Market Attractiveness Index, By Technology
13.7.4 MEA NGS Market Attractiveness Index, By Products
13.7.5 MEA NGS Market Attractiveness Index, By End User
14 Leading Companies in the Next-Generation Sequencing Market
14.1 Competition Dashboard
14.2 Company Share Analysis
14.3 Company Profiles
14.3.1 Illumina, Inc
14.3.1.1 Basic Information
14.3.1.2 Company Overview
14.3.1.3 Product Offerings
14.3.1.4 Financial Statements
14.3.1.5 Company Strategy
14.3.1.6 Key Developments
14.3.2 Thermo Fisher Scientific Inc
14.3.2.1 Basic Information
14.3.2.2 Company Overview
14.3.2.3 Product Offering
14.3.2.4 Financial Statements
14.3.2.5 Company Strategy
14.3.2.6 Key Developments
14.3.3 Pacific Biosciences of California, Inc.
14.3.3.1 Basic Information
14.3.3.2 Company Overview
14.3.3.3 Product Offering
14.3.3.4 Financial Statements
14.3.3.5 Company Strategy
14.3.3.6 Key Developments
14.3.4 Qiagen N.V.
14.3.4.1 Basic Information
14.3.4.2 Company Overview
14.3.4.3 Product Offering
14.3.4.4 Financial Statements
14.3.4.5 Company Strategy
14.3.4.6 Key Developments
14.3.5 F. Hoffmann-La Roche AG
14.3.5.1 Basic Information
14.3.5.2 Company Overview
14.3.5.3 Product Offering
14.3.5.4 Financial Statements
14.3.5.5 Company Strategy
14.3.5.6 Key Developments
14.3.6 BGI (Beijing Genomics Institute)
14.3.6.1 Basic Information
14.3.6.2 Company Overview
14.3.6.3 Product Offering
14.3.6.4 Company Strategy
14.3.6.5 Key Developments
14.3.7 PerkinElmer, Inc.
14.3.7.1 Basic Information
14.3.7.2 Company Overview
14.3.7.3 Product Offering
14.3.7.4 Financial Statements
14.3.7.5 Company Strategy
14.3.7.6 Key Developments
14.3.8 Agilent Technologies, Inc.
14.3.8.1 Basic Information
14.3.8.2 Company Overview
14.3.8.3 Product Offering
14.3.8.4 Financial Statements
14.3.8.5 Company Strategy
14.3.8.6 Key Developments
14.3.9 GATC Biotech AG
14.3.9.1 Basic Information
14.3.9.2 Company Overview
14.3.9.3 Product Offering
14.3.10 Oxford Nanopore Technologies, Ltd
14.3.10.1 Basic Information
14.3.10.2 Company Overview
14.3.10.3 Product Offering
14.3.10.4 Company Strategy
14.3.10.5 Key Developments
14.3.11 Macrogen, Inc
14.3.11.1 Basic Information
14.3.11.2 Company Overview
14.3.11.3 Product Offering
14.3.11.4 Company Strategy
14.3.11.5 Key Developments
14.3.12 Eurofins Scientific
14.3.12.1 Basic Information
14.3.12.2 Company Overview
14.3.12.3 Product Offering
14.3.12.4 Financial Statements
14.3.12.5 Strategy
14.3.12.6 Key Developments
15 Conclusion
16 Glossary
Visiongain Report Sales Order Form
Associated Visiongain Reports
Appendix A
About Visiongain
Appendix B
Visiongain report evaluation form
List of Figures
Figure 2.1 Global Next-Generation Sequencing Market Value Forecast (US$m) and AGR (%), 2015–2027
Figure 3.1: Global Next-Generation Sequencing Market AGR (%) Comparison, By Application Segment, 2015–2027
Figure 3.2: Global Next-Generation Sequencing Market AGR (%) Comparison, By Application Segment, 2015–2027
Figure 3.4: Global Drug Discovery Next-Generation Sequencing Market Value Forecast (US$m) and AGR (%), 2014–2027
Figure 3.5: Global Genetic Screening Next-Generation Sequencing Market Value Forecast (US$m) and AGR (%), 2014–2027
Figure 3.6: Global Diagnostics Next-Generation Sequencing Market Value Forecast (US$m) and AGR (%), By Segment, 2014–2027
Figure 3.7: Global Personalized Medicine Next-Generation Sequencing Market Value Forecast (US$m) and AGR (%), 2014–2027
Figure 3.8: Global Agriculture & Animal Research Next-Generation Sequencing Market Value Forecast (US$m) and AGR (%), 2014–2027
Figure 3.9: Global Infectious Diseases Next-Generation Sequencing Market Value Forecast (US$m) and AGR (%), 2014–2027
Figure 3.10: Global Other Next-Generation Sequencing Market Value Forecast (US$m) and AGR (%), 2014–2027
Figure 3.11: Global NGS Market Attractiveness Index, By Application, 2017–2027
Figure 4.1: Global Next-Generation Sequencing Market AGR (%) Comparison, By Technology Segment, 2015–2027
Figure 4.2: Global Next-Generation Sequencing Market Value Forecast (US$m) and AGR (%), By Whole-Genome Sequencing Segment, 2014–2027
Figure 4.3: Global Next-Generation Sequencing Market Value Forecast (US$m) and AGR (%), By Targeted Re-Sequencing Segment, 2014–2027
Figure 4.4: Global NGS Market Value Forecast (US$m) and AGR (%), By Exome Sequencing Segment, 2014–2027
Figure 4.5: Global NGS Market Value Forecast (US$m) and AGR (%), By RNA Seq Segment, 2014–2027
Figure 4.6: Global NGS Market Value Forecast (US$m) and AGR (%), By Chip Seq Segment, 2014–2027
Figure 4.7: Global NGS Market Value Forecast (US$m) and AGR (%), By De Novo Sequencing Segment, 2014–2027
Figure 4.8: Global NGS Market Value Forecast (US$m) and AGR (%), By Methyl Seq Segment, 2014–2027
Figure 4.9: Global NGS Market Value Forecast (US$m) and AGR (%), By Others Segment, 2014–2027
Figure 4.14: Global NGS Market Attractiveness Index, By Technology, 2017–2027
Figure 5.1: Global NGS Market AGR (%) Comparison, By Products Segment, 2015–2027
Figure 5.2: Global NGS Market Value Forecast (US$m) and AGR (%), By Instruments Segment, 2014–2027
Figure 5.3: Global NGS Market Value Forecast (US$m) and AGR (%), By Reagents & Consumables Segment, 2014–2027
Figure 5.3: Global NGS Market Value Forecast (US$m) and AGR (%), By Services Segment, 2014–2027
Figure 5.4: Global NGS Market Attractiveness Index, By Products, 2017–2027
Figure 6.1: Global NGS Market AGR (%) Comparison, By End User Segment, 2015–2027
Figure 6.2: Global NGS Market Value Forecast (US$m) and AGR (%), By Hospital & Healthcare Institution Segment, 2014–2027
Figure 6.3: Global NGS Market Value Forecast (US$m) and AGR (%), By Academics Segment, 2014–2027
Figure 6.4: Global NGS Market Value Forecast (US$m) and AGR (%), By Biotechnology Segment, 2014–2027
Figure 6.5: Global NGS Market Value Forecast (US$m) and AGR (%), By Pharmaceutical Segment, 2014–2027
Figure 6.5: Global NGS Market Value Forecast (US$m) and AGR (%), By Others Segment, 2014–2027
Figure 6.6: Global NGS Market Attractiveness Index, By End User, 2017–2027
Figure 7.1: Global NGS Market AGR (%) Comparison, By Region, 2015–2027
Figure 7.2: North American NGS Market Value Forecast (US$m) and AGR (%), 2014–2027
Figure 7.3: Latin American NGS Market Value Forecast (US$m) and AGR (%), 2014–2027
Figure 7.4: Western European NGS Market Value Forecast (US$m) and AGR (%), 2014–2027
Figure 7.5: Eastern European NGS Market Value Forecast (US$m) and AGR (%), 2014–2027
Figure 7.6: Asia Pacific NGS Market Value Forecast (US$m) and AGR (%), 2014–2027
Figure 7.7: MEA NGS Market Value Forecast (US$m) and AGR (%), 2014–2027
Figure 7.8: Global NGS Market Attractiveness Index, By Region, 2017–2027
Figure 8.1: North American NGS Market Value Forecast (US$m) and AGR (%), 2014–2027
Figure 8.2: North American NGS Market AGR (%) Comparison, By Country, 2015–2027
Figure 8.3: US NGS Market Value Forecast (US$m) and AGR (%), 2014–2027
Figure 8.4: Canadian NGS Market Value Forecast (US$m) and AGR (%), 2014–2027
Figure 8.5: North American NGS Market Attractiveness Index, By Country, 2017–2027
Figure 8.6: North American NGS Market Attractiveness Index, By Application, 2017–2027
Figure 8.7: North American NGS Market Attractiveness Index, By Technology, 2017–2027
Figure 8.8: North American NGS Market Attractiveness Index, By Products, 2017–2027
Figure 8.9: North American NGS Market Attractiveness Index, By End User, 2017–2027
Figure 9.1: Latin America NGS Market Value Forecast (US$m) and AGR (%), 2014–2027
Figure 9.2: Latin America NGS Market AGR (%) Comparison, By Country, 2015–2027
Figure 9.3: Brazilian NGS Market Value Forecast (US$m) and AGR (%), 2014–2027
Figure 9.4: Mexican NGS Market Value Forecast (US$m) and AGR (%), 2014–2027
Figure 9.5: Latin America NGS Market Value Forecast (US$m) and AGR (%), By Rest of Latin America, 2014–2027
Figure 9.6: Latin America NGS Market Attractiveness Index, By Country, 2017–2027
Figure 9.7: Latin America NGS Market Attractiveness Index, By Application, 2017–2027
Figure 9.8: Latin America NGS Market Attractiveness Index, By Technology, 2017–2027
Figure 9.9: Latin America NGS Market Attractiveness Index, By Products, 2017–2027
Figure 9.10: Latin America NGS Market Attractiveness Index, By End User, 2017–2027
Figure 10.1: Western Europe NGS Market Value Forecast (US$m) and AGR (%), 2014–2027
Figure 10.2: Western Europe NGS Market AGR (%) Comparison, By Country, 2015–2027
Figure 10.3: UK NGS Market Value Forecast (US$m) and AGR (%), 2014–2027
Figure 10.4: French NGS Market Value Forecast (US$m) and AGR (%), 2014–2027
Figure 10.5: German NGS Market Value Forecast (US$m) and AGR (%), 2014–2027
Figure 10.6: Italian NGS Market Value Forecast (US$m) and AGR (%), 2014–2027
igure 10.7: Spanish NGS Market Value Forecast (US$m) and AGR (%), 2014–2027
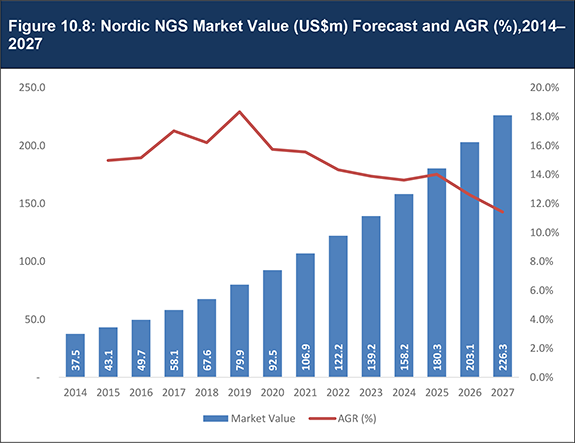
Figure 10.8: Nordic NGS Market Value (US$m) Forecast and AGR (%),2014–2027
Figure 10.9: Benelux NGS Market Value Forecast (US$m) and AGR (%), 2014–2027
Figure 10.10: Rest of Western Europe NGS Market Value Forecast (US$m) and AGR (%), 2014–2027
Figure 10.11: Western Europe NGS Market Attractiveness Index, By Country, 2017–2027
Figure 10.12: Western Europe NGS Market Attractiveness Index, By Application, 2017–2027
Figure 10.13: Western Europe NGS Market Attractiveness Index, By Technology, 2017–2027
Figure 10.14: Western Europe NGS Market Attractiveness Index, By Products, 2017–2027
Figure 10.15: Western Europe NGS Market Attractiveness Index, By End User, 2017–2027
Figure 11.1: Eastern Europe NGS Market Value Forecast (US$m) and AGR (%), 2014–2027
Figure 11.2: Eastern Europe NGS Market AGR (%) Comparison, By Country, 2015–2027
Figure 11.3: Russian NGS Market Value Forecast (US$m) and AGR (%), 2014–2027
Figure 11.4: Polish NGS Market Value Forecast (US$m) and AGR (%), 2014–2027
Figure 11.5: Rest of Eastern Europe NGS Market Value Forecast (US$m) and AGR (%), 2014–2027
Figure 11.6: Eastern Europe NGS Market Attractiveness Index, By Country, 2017–2027
Figure 11.7: Eastern Europe NGS Market Attractiveness Index, By Application, 2017–2027
Figure 11.8: Eastern Europe NGS Market Attractiveness Index, By Technology, 2017–2027
Figure 11.9: Eastern Europe NGS Market Attractiveness Index, By Products, 2017–2027
Figure 11.10: Eastern Europe NGS Market Attractiveness Index, By End User, 2017–2027
Figure 12.1 Asia Pacific NGS Market Value Forecast (US$m) and AGR (%), 2014–2027
Figure 12.2: Asia Pacific NGS Market AGR (%) Comparison, By Country, 2015–2027
Figure 12.3: Chinese NGS Market Value Forecast (US$m) and AGR (%), 2014–2027
Figure 12.4: Indian NGS Market Value Forecast (US$m) and AGR (%), 2014–2027
Figure 12.5: Australia and New Zealand NGS Market Value Forecast (US$m) and AGR (%), 2014–2027
Figure 12.6: ASEAN NGS Market Value Forecast (US$m) and AGR (%), 2014–2027
Figure 12.7: Japanese NGS Market Value Forecast (US$m) and AGR (%), 2014–2027
Figure 12.8: Rest of Asia Pacific NGS Market Value Forecast (US$m) and AGR (%), 2014–2027
Figure 12.9: Asia Pacific NGS Market Attractiveness Index, By Country, 2017–2027
Figure 12.10: Asia Pacific NGS Market Attractiveness Index, By Application, 2017–2027
Figure 12.11: Asia Pacific NGS Market Attractiveness Index, By Technology, 2017–2027
Figure 12.12: Asia Pacific NGS Market Attractiveness Index, By Products, 2017–2027
Figure 12.13: Asia Pacific NGS Market Attractiveness Index, By End User, 2017–2027
Figure 13.1: MEA NGS Market Value Forecast (US$m) and AGR (%), 2014–2027
Figure 13.2: MEA NGS Market AGR (%) Comparison, By Country, 2015–2027
Figure 13.3: MEA NGS Market Value Forecast (US$m) and AGR (%), By GCC Countries, 2014–2027
Figure 13.4: South African NGS Market Value Forecast (US$m) and AGR (%), 2014–2027
Figure 13.5: North African NGS Market Value Forecast (US$m) and AGR (%), 2014–2027
Figure 13.6: Rest of MEA NGS Market Value Forecast (US$m) and AGR (%), 2014–2027
Figure 13.7: MEA NGS Market Attractiveness Index, By Country, 2017–2027
Figure 13.8: MEA NGS Market Attractiveness Index, By Application, 2017–2027
Figure 13.9: MEA NGS Market Attractiveness Index, By Technology, 2017–2027
Figure 13.10: MEA NGS Market Attractiveness Index, By Products, 2017–2027
Figure 13.11: MEA NGS Market Attractiveness Index, By End User, 2017–2027
Figure 14.1: Leading NGS Companies, By Market Share (%), 2016
Figure 14.2: Illumina, Inc Geographical Percentage Split (2016)
Figure 14.3: Thermo Fisher Scientific Inc Segment Percentage Split
Figure 14.4: Thermo Fisher Scientific IncGeographical Percentage Split (2016)
Figure 14.5: Qiagen N.V. Segment Percentage Split
Figure 14.6: Qiagen N.V, Inc.Geographical Percentage Split
Figure 14.7: F. Hoffmann-La Roche AG Segment Percentage Split
Figure 14.8: F. Hoffmann-La Roche AG Segment Geographical Percentage Split
Figure 14.9: Agilent Technologies, Inc, Segment Percentage Split
Figure 15.1 NGS Market Drivers and Restraints
List of Tables
Table 2.1 Next-Generation Sequencing (NGS) Market Segmentation
Table 3.1: Global Next-Generation Sequencing Market Value (US$m) Forecast, By Technology, 2016–2027
Table 3.2 Global Next-Generation Sequencing Market Forecast, ($m, AGR%) 2016-2027
Table 4.1: Global Next-Generation Sequencing Market Forecast, By Technology ($m, AGR%) 2016-2027
Table 4.1: Global Next-Generation Sequencing Market Forecast, By Technology ($m, AGR%) 2016-2027 (continued)
Table 5.1: Global NGS Market Value (US$m) Forecast, By Product, 2016–2027
Table 6.1: Global NGS Market Forecast, By End User ($m, AGR%) 2016-2027
Table 7.1: Global NGS Market Forecast, By Region ($m, AGR%, CAGR%) 2016-2027
Table 8.1: North American NGS Market Forecast, By Application ($m, AGR%) 2016-2027
Table 8.2: North American NGS Market Forecast, By Technology ($m, AGR%) 2016-2027
Table 8.2: North American NGS Market Forecast, By Technology ($m, AGR%) 2016-2027 (continued)
Table 8.3: North American NGS Market Forecast, By Products ($m, AGR%) 2016-2027
Table 8.4: North American NGS Market Forecast, By End User ($m, AGR%) 2016-2027
Table 9.1: Latin America NGS Market Forecast, ($m, AGR%) 2016-2027
Table 9.2: Latin America NGS Market Forecast, By Application ($m, AGR%) 2016-2027
Table 9.3: Latin America NGS Market Forecast, By Technology ($m, AGR%) 2016-2027
Table 9.3: Latin America NGS Market Forecast, By Technology ($m, AGR%) 2016-2027 (continued)
Table 9.4: Latin America NGS Market Forecast, By Products ($m, AGR%) 2016-2027
Table 9.5: Latin America NGS Market Forecast, By End User ($m, AGR%) 2016-2027
Table 10.1: Western Europe NGS Market Forecast, ($m, AGR%) 2016-2027
Table 10.2: Western Europe NGS Market Forecast, By Application ($m, AGR%) 2016-2027
Table 10.3: Western Europe NGS Market Forecast, By Technology ($m, AGR%) 2016-2027
Table 10.3: Western Europe NGS Market Forecast, By Technology ($m, AGR%) 2016-2027 (continued)
Table 10.4: Western Europe NGS Market Forecast, By Products ($m, AGR%) 2016-2027
Table 10.5: Western Europe NGS Market Forecast, By End User ($m, AGR%) 2016-2027
Table 11.1: Eastern Europe NGS Market Forecast, ($m, AGR%) 2016-2027
Table 11.2: Eastern Europe NGS Market Forecast, By Application ($m, AGR%) 2016-2027
Table 11.3: Eastern Europe NGS Market Forecast, By Technology ($m, AGR%) 2016-2027
Table 11.3: Eastern Europe NGS Market Forecast, By Technology ($m, AGR%) 2016-2027 (continued)
Table 11.4: Eastern Europe NGS Market Forecast, By Products ($m, AGR%) 2016-2027
Table 11.5: Eastern Europe NGS Market Forecast, By End User ($m, AGR%) 2016-2027
Table 12.1: Asia Pacific NGS Market Forecast, ($m, AGR%) 2016-2027
Table 12.2: Asia Pacific NGS Market Forecast, By Application ($m, AGR%) 2016-2027
Table 12.3: Asia Pacific NGS Market Forecast, By Technology ($m, AGR%) 2016-2027
Table 12.3: Asia Pacific NGS Market Forecast, By Technology ($m, AGR%) 2016-2027 (continued)
Table 12.4: Asia Pacific NGS Market Forecast, By Products ($m, AGR%) 2016-2027
Table 12.5: Asia Pacific NGS Market Forecast, By End User ($m, AGR%) 2016-2027
Table 13.1: MEA NGS Market Forecast, ($m, AGR%) 2016-2027
Table 13.2: MEA NGS Market Forecast, By Application ($m, AGR%) 2016-2027
Table 13.3: MEA NGS Market Forecast, By Technology($m, AGR%) 2016-2027
Table 13.4: MEA NGS Market Forecast, By Products ($m, AGR%) 2016-2027
Table 13.5: MEA NGS Market Forecast, By End User ($m, AGR%) 2016-2027
Table 14.1: Next-Generation Sequencing Market Competitive Overview
Table 14.1: Next-Generation Sequencing Market Competitive Overview (cont.)
Table 14.2: Illumina, Inc. Overview, 2016
Table 14.3: Illumina, Inc. Financial Overview, 2014-2016
Table 14.4: Illumina, IncRecent Developments
Table 14.5: Thermo Fisher Scientific Inc Overview, 2016
Table 14.7: Thermo Fisher Scientific Inc Developments
Table 14.8: Pacific Biosciences of California, Inc., Overview, 2016
Table 14.9 Pacific Biosciences of California, Inc, Financial Overview, 2014-2016
Table 14.10: Pacific Biosciences of California, Inc Recent Developments
Table 14.13: Qiagen N.V. Recent Developments
Table 14.14: F. Hoffmann-La Roche AG, Overview, 2016
Table 14.15: F. Hoffmann-La Roche AG, Financial Overview, 2014-2016
Table 14.16: F. Hoffmann-La Roche AG Recent Developments
Table 14.17: BGI, Overview, 2016
Table 14.18: Beijing Genomics Institute, Recent Developments
Table 14.19: PerkinElmer, Inc, Overview, 2016
Table 14.20: PerkinElmer, Inc.Financial Overview, 2014-2016
Table 14.21: PerkinElmer, Inc. Recent Developments
Table 14.22: Agilent Technologies, Inc, Overview, 2016
Table 14.23: Agilent Technologies, Inc Financial Overview, 2014-2016
Table 14.24: Agilent Technologies, Inc. Recent Developments
Table 14.25: GATC Biotech AG,Overview, 2016
Table 14.26: Oxford Nanopore Technologies, Ltd ,Overview, 2016
Table 14.27: Oxford Nanopore Technologies, Ltd. Recent Developments
Table 14.28: Macrogen, Inc ,Overview, 2016
Table 14.29: Macrogen, Inc. Recent Developments
Table 14.30: Eurofins Scientific ,Overview, 2016
Table 14.31: Eurofins Scientific Financial Overview, 2014-2016
Table 14.32: Eurofins Scientific Recent Developments