Visiongain has calculated that the global Electric Power Substation Automation market will see a capital expenditure (CAPEX) of $38,881mn in 2018. Read on to discover the potential business opportunities available.
The rising demand for reliable and continuous electricity supply among the consumers has raised an alarming need towards the modernization of existing grid infrastructure. The rapid growth in the population has led to increased congestion and stress on the existing grid resulting in an unbalanced and inefficient supply of electricity among the consumers; the bulk of them affected with lack of electricity supply.
Electric Power Substation Automation systems enable the electric utilities to remotely monitor, control and protect the distribution components in the substation to ensure reliable and improved power supply with increased safety regulations. The technology uses a real-time information from the system to identify critical faults across the electricity network, analyse and control the faults and finally display the information.
The Electric Power Substation Automation market is mainly driven by the factors including rising demand for effective energy usage, growing adoption of renewable energy and need for efficient grid infrastructure. The increasing demand for efficient and reliable electricity supply has led to an increased demand for Electric Power Substation Automations. These systems are more essential to be installed in the remote areas and off grid locations as they can facilitate real-time notification alerts during circuit outage to enable the power utility to address the situation within time.
The adoption of Electric Power Substation Automation has been further complemented with rapid integration of renewable energy. The technology is essential for efficient monitoring and real-time renewable power supply to electricity consumers. Substation automation is expected to be a major solution for ageing grid infrastructure as they can reduce the burden on existing utilities by monitoring and controlling critical faults across the electricity network. Despite these advantages, the technology has experienced a low adoption owing to high cost of installation and lack of technical expertise.
Visiongain’s global Electric Power Substation Automation market report can keep you informed and up to date with the developments in the market, across five different regions: North America, Europe, Middle East & Africa, Asia Pacific and Latin America.
With reference to this report, it details the key investments trend in the global market, subdivided by regions, capital expenditure by Type and Module. Through extensive secondary research and interviews with industry experts, visiongain has identified a series of market trends that will impact the Electric Power Substation Automation market over the forecast timeframe.
The report will answer questions such as:
– How is the Electric Power Substation Automation market evolving?
– What is driving and restraining Electric Power Substation Automation market dynamics?
– How will each Electric Power Substation Automation submarket segment grow over the forecast period and how much sales will these submarkets account for in 2028?
– How will market shares of each Electric Power Substation Automation submarket develop from 2018-2028?
– Which individual technologies will prevail and how will these shifts be responded to?
– Which Electric Power Substation Automation submarket will be the main driver of the overall market from 2018-2028?
– How will political and regulatory factors influence regional Electric Power Substation Automation markets and submarkets?
– Will leading national Electric Power Substation Automation market broadly follow macroeconomic dynamics, or will individual country sectors outperform the rest of the economy?
– How will market shares of the national markets change by 2028 and which nation will lead the market in 2028?
– Who are the leading players and what are their prospects over the forecast period?
– How will the sector evolve as alliances form during the period between 2018 and 2028?
Five Reasons Why You Must Order and Read This Report Today:
1) The report provides forecasts for the global the Electric Power Substation Automation market in terms of Type, for the period 2018-2028
– Transmission CAPEX 2018-2028
– Distribution CAPEX 2018-2028
2) The report also forecasts and analyses the Electric Power Substation Automation market by Module from 2018-2028
– SCADA CAPEX 2018-2028
– IEDs CAPEX 2018-2028
– Communication Networks CAPEX 2018-2028
3) The report reveals where and how companies are investing in Electric Power Substation Automation. We show you the prospects for the following regions, including individual breakdowns by Module:
North America
– US CAPEX 2018-2028
– Canada CAPEX 2018-2028
– Mexico CAPEX 2018-2028
Middle East & Africa
– Saudi Arabia CAPEX 2018-2028
– UAE CAPEX 2018-2028
– South Africa CAPEX 2018-2028
– Rest of the Middle East and Africa CAPEX 2018-2028
Asia Pacific
– China CAPEX 2018-2028
– India CAPEX 2018-2028
– Japan CAPEX 2018-2028
– South Korea CAPEX 2018-2028
– Rest of Asia Pacific CAPEX 2018-2028
Europe
– UK CAPEX 2018-2028
– Germany CAPEX 2018-2028
– France CAPEX 2018-2028
– Russia CAPEX 2018-2028
– Rest of Europe CAPEX 2018-2028
Latin America
– Brazil CAPEX 2018-2028
– Argentina CAPEX 2018-2028
– Rest of Latin America CAPEX 2018-2028
4) The report includes a SWOT analysis and PEST Analysis, identifying the opportunities available and the key threats to the Electric Power Substation Automation Market
5) The report provides market share and detailed profiles of the leading companies operating within the Electric Power Substation Automation market:
– ABB Ltd.
– General Electric
– Schneider Electric
– Siemens AG
– Eaton Corporation
– Larsen & Toubro Limited
– Crompton Greaves
– Honeywell International
– Toshiba Corporation
– Cisco Systems
This independent 183-page report guarantees you will remain better informed than your competitors. With 169 tables and figures examining the Electric Power Substation Automation market space, the report gives you a direct, detailed breakdown of the market. PLUS, Capital expenditure by Type and Module from 2018-2028 that will keep your knowledge that one step ahead of your rivals.
This report is essential reading for you or anyone in the Energy sector. Purchasing this report today will help you to recognise those important market opportunities and understand the possibilities there. I look forward to receiving your order.
Visiongain is a trading partner with the US Federal Government
CCR Ref number: KD4R6
1. Report Overview
1.1 Global Electric Power Substation Automation Market Overview
1.2 Why You Should Read This Report
1.3 How This Report Delivers
1.4 Key Questions Answered by This Analytical Report Include:
1.5 Who is This Report For?
1.6 Methodology
1.6.1 Primary Research
1.6.2 Secondary Research
1.6.3 Market Evaluation & Forecasting Methodology
1.7 Frequently Asked Questions (FAQ)
1.8 Associated Visiongain Reports
1.9 About Visiongain
2. Introduction to the Electric Power Substation Automation Market
2.1 Electric Power Substation Automation Market Definition
2.2 Electric Power Substation Automation Market Structure
2.3 Brief History of Electric Power Substation Automation
3. Global Electric Power Substation Automation Market 2018-2028
3.1 Global Electric Power Substation Automation Market Forecast 2018-2028
3.2 Electric Power Substation Automation Market Drivers & Restraints 2018
3.2.1 Drivers in the Electric Power Substation Automation Market
3.2.1.2 Growing Adoption of Renewable Energy
3.2.1.3 Need for Efficient Grid Infrastructure
3.2.2 Restraints in the Electric Power Substation Automation Market
3.2.2.1 High Cost of Installation
3.2.2.2 Lack of Technical Expertise
4. Global Electric Power Substation Automation Market By Type Forecast 2018-2028
4.1 Global Electric Power Substation Automation Market By Transmission Forecast 2018-2028
4.2 Global Electric Power Substation Automation Market By Distribution Forecast 2018-2028
5. Global Electric Power Substation Automation Market By Module Forecast 2018-2028
5.1 Global Electric Power Substation Automation Market By SCADA Forecast 2018-2028
5.2 Global Electric Power Substation Automation Market By IEDs Forecast 2018-2028
5.3 Global Electric Power Substation Automation Market By Communication Networks Forecast 2018-2028
6. Leading Regional and National Electric Power Substation Automation Market Forecast 2018-2028
6.1 North America Electric Power Substation Automation Market Forecast 2018-2028
6.1.1 The US Electric Power Substation Automation Market Forecast 2018-2028
6.1.2 Canada Electric Power Substation Automation Market Forecast 2018-2028
6.1.3 Mexico Electric Power Substation Automation Market Forecast 2018-2028
6.2 Europe Electric Power Substation Automation Market Forecast 2018-2028
6.2.1 The UK Electric Power Substation Automation Market Forecast 2018-2028
6.2.2 Germany Electric Power Substation Automation Market Forecast 2018-2028
6.2.3 France Electric Power Substation Automation Market Forecast 2018-2028
6.2.4 Russia Electric Power Substation Automation Market Forecast 2018-2028
6.2.5 Rest of Europe Electric Power Substation Automation Market Forecast 2018-2028
6.3 Asia Pacific Electric Power Substation Automation Market Forecast 2017-2027
6.3.1 China Electric Power Substation Automation Market Forecast 2018-2028
6.3.2 India Electric Power Substation Automation Market Forecast 2018-2028
6.3.3 Japan Electric Power Substation Automation Market Forecast 2018-2028
6.3.4 South Korea Electric Power Substation Automation Market Forecast 2018-2028
6.3.5 Rest of Asia Pacific Electric Power Substation Automation Market Forecast 2018-2028
6.4 Middle East and Africa Electric Power Substation Automation Market Forecast 2018-2028
6.4.1 Saudi Arabia Electric Power Substation Automation Market Forecast 2018-2028
6.4.2 UAE Electric Power Substation Automation Market Forecast 2018-2028
6.4.3 South Africa Electric Power Substation Automation Market Forecast 2018-2028
6.4.4 Rest of the Middle East and Africa Electric Power Substation Automation Market Forecast 2018-2028
6.5 Latin America Electric Power Substation Automation Market Forecast 2018-2028
6.5.1 Brazil Electric Power Substation Automation Market Forecast 2018-2028
6.5.2 Argentina Electric Power Substation Automation Market Forecast 2018-2028
6.5.3 Rest of Latin America Electric Power Substation Automation Market Forecast 2018-2028
7. SWOT Analysis of the Electric Power Substation Automation Market 2018-2028
7.1 SWOT Analysis
8. PEST Analysis of the Electric Power Substation Automation Market 2018-2028
8.1 PEST Analysis
9. The Leading Companies in the Electric Power Substation Automation Market
9.1 ABB Ltd.
9.1.1 ABB Ltd Total Company Sales 2011-2016
9.1.2 ABB Ltd Sales in the Electric Power Substation Automation Market 2015-2016
9.2 Eaton Corporation Plc
9.2.1 Eaton Corporation Plc Total Company Sales 2011-2016
9.2.2 Eaton Corporation Plc Sales in the Electric Power Substation Automation Market 2012-2016
9.3 General Electric Company
9.3.1 General Electric Company Total Company Sales 2012-2016
9.3.2 General Electric Company Sales in the Electric Power Substation Automation Market 2011-2016
9.4 Schneider Electric SE
9.4.1 Schneider Electric SE Total Company Sales 2011-2016
9.4.2 Schneider Electric SE Sales in the Electric Power Substation Automation Market 2012-2016
9.5 Siemens AG
9.5.1 Siemens AG Total Company Sales 2012-2017
9.5.2 Siemens AG Sales in the Electric Power Substation Automation Market 2014-2017
9.6 Crompton Greaves Limited
9.6.1 Crompton Greaves Limited Total Company Sales 2011-2016
9.6.2 Crompton Greaves Limited Sales in the Gas Insulated Substation Market 2011-2016
9.7 Honeywell International Inc.
9.7.1 Honeywell International Inc. Total Company Sales 2013-2016
9.7.2 Honeywell International Inc. Sales in the Smart Gas Metering Market 2015-2016
9.8 Larsen & Toubro Limited
9.8.1 Larsen & Toubro Limited Total Company Sales 2011-2016
9.8.2 Larsen & Toubro Limited Sales in the Gas Insulated Substation Market 2011-2016
9.9 Toshiba Corporation
9.9.1 Toshiba Corporation Total Company Sales 2013-2016
9.9.2 Toshiba Corporation Sales in the Gas Insulated Substation Market 2015-2016
9.10 Cisco Systems, Inc.
9.10.1 Cisco Systems, Inc. Total Company Sales 2011-2016
9.11 Other Leading Companies in the Electric Power Substation Automation Market
10. Conclusions and Recommendations
10.1 Key Findings
10.2 Recommendations
11. Glossary
Appendix
Associated Visiongain Reports
Visiongain Report Sales Order Form
Appendix A
Appendix B
Visiongain Report Evaluation Form
List of Tables
Table 1.1 Leading Regional Electric Power Substation Automation Market Forecast 2018-2028 (US$mn, Global AGR %, Cumulative)
Table 1.2 Global Electric Power Substation Automation By Type Forecast 2018-2028 (US$mn, AGR %, CAGR %, Cumulative)
Table 1.3 Global Electric Power Substation Automation Market By Module Forecast 2018-2028 (US$mn, AGR %, Cumulative)
Table 3.1 Global Electric Power Substation Automation Market Forecast 2018-2028 (US$mn, AGR %, CAGR %, Cumulative)
Table 3.2 Electric Power Substation Automation Market Drivers & Restraints
Table 4.1 Global Electric Power Substation Automation Market By Type Forecast 2018-2028 (US$mn, AGR %, Cumulative)
Table 4.2 Global Electric Power Substation Automation Market By Type CAGR Forecast 2018-2023, 2023-2028, 2018-2028 (CAGR %)
Table 4.3 Global Electric Power Substation Automation Market By Transmission Forecast 2018-2028 (US$mn, AGR %, CAGR %, Cumulative)
Table 4.4 Global Electric Power Substation Automation Market By Distribution Forecast 2018-2028 (US$mn, AGR %, CAGR %, Cumulative)
Table 5.1 Global Electric Power Substation Automation Market By Module Forecast 2018-2028 (US$mn, AGR %, Cumulative)
Table 5.2 Global Electric Power Substation Automation Market By Module By Region Forecast 2018-2028 (US$mn, Cumulative, Global AGR %)
Table 5.3 Global Electric Power Substation Automation Market By Module CAGR Forecast 2018-2023, 2023-2028, 2018-2028 (CAGR %)
Table 5.4 Global Electric Power Substation Automation Market By SCADA Forecast 2018-2028 (US$mn, AGR %, CAGR %, Cumulative)
Table 5.5 Global Electric Power Substation Automation SCADA Regional Market CAGR Forecast 2018-2023, 2023-2028, 2018-2028 (CAGR %)
Table 5.6 Global Electric Power Substation Automation Market By IEDs Forecast 2018-2028 (US$mn, AGR %, CAGR %, Cumulative)
Table 5.7 Global Electric Power Substation Automation IEDs Regional Market CAGR Forecast 2018-2023, 2023-2028, 2018-2028 (CAGR %)
Table 5.8 Global Electric Power Substation Automation Market By Communication Networks Forecast 2018-2028 (US$mn, AGR %, CAGR %, Cumulative)
Table 5.9 Global Electric Power Substation Automation Communication Networks Regional Market CAGR Forecast 2018-2023, 2023-2028, 2018-2028 (CAGR %)
Table 6.1 Leading Regional Electric Power Substation Automation Market Forecast 2018-2028 (US$mn, Global AGR %, Cumulative)
Table 6.2 Regional Electric Power Substation Automation Market Percentage Change in Market Share 2018-2023, 2023-2028, 2018-2028 (% Change)
Table 6.3 North America Electric Power Substation Automation Market by Country Forecast 2018-2028 (US$mn, AGR %, CAGR %, Cumulative)
Table 6.4 The U.S. Electric Power Substation Automation By Module Forecast 2018-2028 (US$mn, AGR %, CAGR %, Cumulative)
Table 6.5 Canada Electric Power Substation Automation By Module Forecast 2018-2028 (US$mn, AGR %, CAGR %, Cumulative)
Table 6.6 Mexico Electric Power Substation Automation By Module Forecast 2018-2028 (US$mn, AGR %, CAGR %, Cumulative)
Table 6.7 Europe Electric Power Substation Automation Market by Country Forecast 2018-2028 (US$mn, AGR %, CAGR %, Cumulative)
Table 6.8 UK Electric Power Substation Automation By Module Forecast 2018-2028 (US$mn, AGR %, CAGR %, Cumulative)
Table 6.9 Germany Electric Power Substation Automation By Module Forecast 2018-2028 (US$mn, AGR %, CAGR %, Cumulative)
Table 6.10 France Electric Power Substation Automation By Module Forecast 2018-2028 (US$mn, AGR %, CAGR %, Cumulative)
Table 6.11 Russia Electric Power Substation Automation By Module Forecast 2018-2028 (US$mn, AGR %, CAGR %, Cumulative)
Table 6.12 Rest of Europe Electric Power Substation Automation By Module Forecast 2018-2028 (US$mn, AGR %, CAGR %, Cumulative)
Table 6.13 Asia Pacific Electric Power Substation Automation Market by Country Forecast 2017-2027 (US$mn, AGR %, CAGR %, Cumulative)
Table 6.14 China Electric Power Substation Automation By Module Forecast 2018-2028 (US$mn, AGR %, CAGR %, Cumulative)
Table 6.15 India Electric Power Substation Automation By Module Forecast 2018-2028 (US$mn, AGR %, CAGR %, Cumulative)
Table 6.16 Japan Electric Power Substation Automation By Module Forecast 2018-2028 (US$mn, AGR %, CAGR %, Cumulative)
Table 6.17 South Korea Electric Power Substation Automation By Module Forecast 2018-2028 (US$mn, AGR %, CAGR %, Cumulative)
Table 6.18 Rest of Asia Pacific Electric Power Substation Automation By Module Forecast 2018-2028 (US$mn, AGR %, CAGR %, Cumulative)
Table 6.19 Middle East and Africa Electric Power Substation Automation Market by Country Forecast 2017-2027 (US$mn, AGR %, CAGR %, Cumulative)
Table 6.20 Saudi Arabia Electric Power Substation Automation By Module Forecast 2018-2028 (US$mn, AGR %, CAGR %, Cumulative)
Table 6.21 UAE Electric Power Substation Automation By Module Forecast 2018-2028 (US$mn, AGR %, CAGR %, Cumulative)
Table 6.22 South Africa Electric Power Substation Automation By Module Forecast 2018-2028 (US$mn, AGR %, CAGR %, Cumulative)
Table 6.23 Rest of Middle East and Africa Electric Power Substation Automation By Module Forecast 2018-2028 (US$mn, AGR %, CAGR %, Cumulative)
Table 6.24 Latin America Electric Power Substation Automation Market by Country Forecast 2018-2028 (US$mn, AGR %, CAGR %, Cumulative)
Table 6.25 Brazil Electric Power Substation Automation By Module Forecast 2018-2028 (US$mn, AGR %, CAGR %, Cumulative)
Table 6.26 Argentina Electric Power Substation Automation By Module Forecast 2018-2028 (US$mn, AGR %, CAGR %, Cumulative)
Table 6.27 Rest of Latin America Electric Power Substation Automation By Module Forecast 2018-2028 (US$mn, AGR %, CAGR %, Cumulative)
Table 7.1 Global Electric Power Substation Automation Market SWOT Analysis 2018-2028
Table 8.1 Global Electric Power Substation Automation Market PEST Analysis 2018-2028
Table 9.1 ABB Ltd 2016 (CEO, Total Company Sales US$m, Sales from Company Division that includes Electric Power Substation Automation (US$m), Share of Total Company Sales from Company Division that includes Electric Power Substation Automation (%), Net Income / Loss US$m, Net Capital Expenditure US$m, Strongest Business Region, Business Segment in the Market, HQ, Founded, No. of Employees, IR Contact, Ticker, Website)
Table 9.2 ABB Ltd Total Company Sales 2010-2016 (US$m, AGR %)
Table 9.3 ABB Ltd Sales in the Electric Power Substation Automation Market 2014-2016 (US$m, AGR %)
Table 9.4 Eaton Corporation Plc 2016 (CEO, Total Company Sales US$m, Sales from Company Division that includes Electric Power Substation Automation (US$m), Share of Total Company Sales from Company Division that includes Electric Power Substation Automation (%), Net Income / Loss US$m, Net Capital Expenditure US$m, Strongest Business Region, Business Segment in the Market, HQ, Founded, No. of Employees, IR Contact, Ticker, Website)
Table 9.5 Eaton Corporation Plc Total Company Sales 2010-2016 (US$m, AGR %)
Table 9.6 Eaton Corporation Plc Sales in the Electric Power Substation Automation Market 2011-2016 (US$m, AGR %)
Table 9.7 General Electric Company 2016 (CEO, Total Company Sales US$m, Sales from Company Division that includes Electric Power Substation Automation (US$m), Share of Total Company Sales from Company Division that includes Electric Power Substation Automation (%), Net Income / Loss US$m, Net Capital Expenditure US$m, Strongest Business Region, Business Segment in the Market, HQ, Founded, No. of Employees, IR Contact, Ticker, Website)
Table 9.8 General Electric Company Total Company Sales 2011-2016 (US$m, AGR %)
Table 9.9 General Electric Company Sales in the Electric Power Substation Automation Market 2010-2016 (US$m, AGR %)
Table 9.10 Schneider Electric SE 2016 (CEO, Total Company Sales US$m, Sales from Company Division that includes Electric Power Substation Automation (US$m), Share of Total Company Sales from Company Division that includes Electric Power Substation Automation (%), Net Income / Loss US$m, Net Capital Expenditure US$m, Strongest Business Region, Business Segment in the Market, HQ, Founded, No. of Employees, IR Contact, Ticker, Website)
Table 9.11 Schneider Electric SE Total Company Sales 2010-2016 (US$m, AGR %)
Table 9.12 Schneider Electric SE Sales in the Electric Power Substation Automation Market 2011-2016 (US$m, AGR %)
Table 9.13 Siemens AG Profile 2016 (CEO, Total Company Sales US$m, Sales from Company Division that includes Electric Power Substation Automation (US$m), Share of Total Company Sales from Company Division that includes Electric Power Substation Automation (%), Net Income / Loss US$m, Net Capital Expenditure US$m, Strongest Business Region, Business Segment in the Market, HQ, Founded, No. of Employees, IR Contact, Ticker, Website)
Table 9.14 Siemens AG Total Company Sales 2011-2017 (US$m, AGR %)
Table 9.15 Siemens AG Sales in the Electric Power Substation Automation Market 2013-2017 (US$m, AGR %)
Table 9.16 Crompton Greaves Limited 2016 (CEO, Total Company Sales US$m, Sales from Company Division that includes Electric Power Substation Automation (US$m), Share of Total Company Sales from Company Division that includes Electric Power Substation Automation (%), Net Income / Loss US$m, Net Capital Expenditure US$m, Strongest Business Region, Business Segment in the Market, HQ, Founded, No. of Employees, IR Contact, Ticker, Website)
Table 9.17 Crompton Greaves Limited Total Company Sales 2010-2016 (US$m, AGR %)
Table 9.18 Crompton Greaves Limited Sales in the Gas Insulated Substation Market 2010-2016 (US$m, AGR %)
Table 9.19 Honeywell International Inc. 2016 (CEO, Total Company Sales US$m, Sales from Company Division that includes Electric Power Substation Automation (US$m), Share of Total Company Sales from Company Division that includes Electric Power Substation Automation (%), Net Income / Loss US$m, Net Capital Expenditure US$m, Strongest Business Region, Business Segment in the Market, HQ, Founded, No. of Employees, IR Contact, Ticker, Website)
Table 9.20 Honeywell International Inc. Total Company Sales 2010-2015 (US$m, AGR %)
Table 9.21 Honeywell International Inc. Sales in the Smart Gas Metering Market 2014-2016 (US$m, AGR %)
Table 9.22 Larsen & Toubro Limited 2016 (CEO, Total Company Sales US$m, Sales from Company Division that includes Electric Power Substation Automation (US$m), Share of Total Company Sales from Company Division that includes Electric Power Substation Automation (%), Net Income / Loss US$m, Net Capital Expenditure US$m, Strongest Business Region, Business Segment in the Market, HQ, Founded, No. of Employees, IR Contact, Ticker, Website)
Table 9.23 Larsen & Toubro Limited Total Company Sales 2010-2016 (US$m, AGR %)
Table 9.24 Larsen & Toubro Limited Sales in the Gas Insulated Substation Market 2010-2016 (US$m, AGR %)
Table 9.25 Toshiba Corporation Profile 2016 (CEO, Total Company Sales US$m, Sales from Company Division that includes Electric Power Substation Automation (US$m), Share of Total Company Sales from Company Division that includes Electric Power Substation Automation (%), Net Income / Loss US$m, Net Capital Expenditure US$m, Strongest Business Region, Business Segment in the Market, HQ, Founded, No. of Employees, IR Contact, Ticker, Website)
Table 9.26 Toshiba Corporation Total Company Sales 2012-2016 (US$m, AGR %)
Table 9.27 Toshiba Corporation Sales in the Gas Insulated Substation Market 2014-2016 (US$m, AGR %)
Table 9.28 Cisco Systems, Inc. Profile 2016 (CEO, Total Company Sales US$m, Sales in the Market US$m, Share of Company Sales from Electric Power Substation Automation Market %, Net Income / Loss US$m, Net Capital Expenditure US$m, Strongest Business Region, Business Segment in the Market, HQ, Founded, No. of Employees, IR Contact, Ticker, Website)
Table 9.29 Cisco Systems, Inc. Total Company Sales 2010-2016 (US$m, AGR %)
Table 10.1 Global Electric Power Substation Automation Market By Type Forecast 2018-2028 (US$mn, AGR %, Cumulative)
Table 10.2 Global Electric Power Substation Automation Market By Module Forecast 2018-2028 (US$mn, AGR %, Cumulative)
Table 10.3 Leading Regional Electric Power Substation Automation Market Forecast 2018-2028 (US$mn, Global AGR %, Cumulative)
List of Figures
Figure 2.1 Global Electric Power Substation Automation Market Segmentation Overview
Figure 3.1 Global Electric Power Substation Automation Market Forecast 2018-2028 (US$mn, AGR %)
Figure 4.1 Global Electric Power Substation Automation Market By Type AGR Forecast 2018-2028 (AGR %)
Figure 4.2 Global Electric Power Substation Automation Market By Type Forecast 2018-2028 (US$mn, Global AGR %)
Figure 4.3 Global Electric Power Substation Automation Market By Type Share Forecast 2018 (% Share)
Figure 4.4 Global Electric Power Substation Automation Market By Type Share Forecast 2023 (% Share)
Figure 4.5 Global Electric Power Substation Automation Market By Type Share Forecast 2028 (% Share)
Figure 4.6 Global Electric Power Substation Automation Market By Transmission Forecast 2018-2028 (US$mn, Global AGR %)
Figure 4.7 Share of the Transmission in Global Electric Power Substation Automation Market 2018-2028 (%)
Figure 4.8 Global Electric Power Substation Automation Market By Distribution Forecast 2018-2028 (US$mn, Global AGR %)
Figure 4.9 Share of the Distribution in Global Electric Power Substation Automation Market 2018-2028 (%)
Figure 5.1 Global Electric Power Substation Automation Market By Module AGR Forecast 2018-2028 (AGR %)
Figure 5.2 Global Electric Power Substation Automation Market By Module Forecast 2018-2028 (US$mn, Global AGR %)
Figure 5.3 Global Electric Power Substation Automation Market By Module Share Forecast 2018 (% Share)
Figure 5.4 Global Electric Power Substation Automation Market By Module Share Forecast 2023 (% Share)
Figure 5.5 Global Electric Power Substation Automation Market By Module Share Forecast 2028 (% Share)
Figure 5.6 Global Electric Power Substation Automation SCADA by Region Market AGR Forecast 2018-2028 (AGR %)
Figure 5.7 Global Electric Power Substation Automation SCADA by Region Market 2018-2028 (US$mn, Global AGR %)
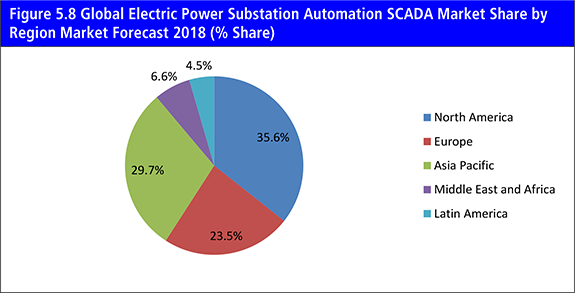
Figure 5.8 Global Electric Power Substation Automation SCADA Market Share by Region Market Forecast 2018 (% Share)
Figure 5.9 Global Electric Power Substation Automation SCADA Market Share by Region Market Forecast 2023 (% Share)
Figure 5.10 Global Electric Power Substation Automation SCADA Market Share by Region Market Forecast 2028 (% Share)
Figure 5.11 Global Electric Power Substation Automation IEDs by Region Market AGR Forecast 2018-2028 (AGR %)
Figure 5.12 Global Electric Power Substation Automation IEDs by Region Market 2017-2027 (US$mn, Global AGR %)
Figure 5.13 Global Electric Power Substation Automation IEDs Market Share by Region Market Forecast 2018 (% Share)
Figure 5.14 Global Electric Power Substation Automation IEDs Market Share by Region Market Forecast 2023 (% Share)
Figure 5.15 Global Electric Power Substation Automation IEDs Market Share by Region Market Forecast 2028 (% Share)
Figure 5.16 Global Electric Power Substation Automation Communication Networks by Region Market AGR Forecast 2018-2028 (AGR %)
Figure 5.17 Global Electric Power Substation Automation Communication Networks by Region Market 2018-2028 (US$mn, Global AGR %)
Figure 5.18 Global Electric Power Substation Automation Communication Networks Market Share by Region Market Forecast 2018 (% Share)
Figure 5.19 Global Electric Power Substation Automation Communication Networks Market Share by Region Market Forecast 2023 (% Share)
Figure 5.20 Global Electric Power Substation Automation Communication Networks Market Share by Region Market Forecast 2028 (% Share)
Figure 6.1 Global Electric Power Substation Automation Market by Region Market Forecast 2018-2028 (US$mn, Global AGR %)
Figure 6.2 Global Electric Power Substation Automation Market by Region Market AGR Forecast 2018-2028 (AGR %)
Figure 6.3 Global Electric Power Substation Automation Market by Regional Market Share Forecast 2018 (% Share)
Figure 6.4 Global Electric Power Substation Automation Market by Regional Market Share Forecast 2023 (% Share)
Figure 6.5 Global Electric Power Substation Automation Market by Regional Market Share Forecast 2028 (% Share)
Figure 6.6 North America Electric Power Substation Automation Market by Country AGR Forecast 2017-2027 (AGR %)
Figure 6.7 North America Electric Power Substation Automation by Country Forecast 2018-2028 (US$mn, North America Total Market Sales AGR %)
Figure 6.8 North America Electric Power Substation Automation Market Share by Country Forecast 2018, 2023, 2028 (% Share)
Figure 6.9 U.S. Electric Power Substation Automation by Module Market Forecast 2018-2028 (US$mn)
Figure 6.10 Canada Electric Power Substation Automation by Module Market Forecast 2018-2028 (US$mn)
Figure 6.11 Mexico Electric Power Substation Automation by Module Market Forecast 2018-2028 (US$mn)
Figure 6.12 Europe Electric Power Substation Automation Market by Country AGR Forecast 2018-2028 (AGR %)
Figure 6.13 Europe Electric Power Substation Automation Market by Country Forecast 2018-2028 (US$mn, Europe Total Market Sales AGR %)
Figure 6.14 Europe Electric Power Substation Automation Market Share by Country Forecast 2018, 2023, 2028 (% Share)
Figure 6.15 UK Electric Power Substation Automation by Module Market Forecast 2018-2028 (US$mn)
Figure 6.16 Germany Electric Power Substation Automation by Module Market Forecast 2018-2028 (US$mn)
Figure 6.17 France Electric Power Substation Automation by Module Market Forecast 2018-2028 (US$mn)
Figure 6.18 Russia Electric Power Substation Automation by Module Market Forecast 2018-2028 (US$mn)
Figure 6.19 Rest of Europe Electric Power Substation Automation by Module Market Forecast 2018-2028 (US$mn)
Figure 6.20 Asia Pacific Electric Power Substation Automation Market by Country AGR Forecast 2018-2028 (AGR %)
Figure 6.21 Asia Pacific Electric Power Substation Automation Market by Country Forecast 2018-2028 (US$mn, Asia Pacific Total Market Sales AGR %)
Figure 6.22 Asia Pacific Electric Power Substation Automation Market Share by Country Forecast 2018, 2023, 2028 (% Share)
Figure 6.23 China Electric Power Substation Automation by Module Market Forecast 2018-2028 (US$mn)
Figure 6.24 India Electric Power Substation Automation by Module Market Forecast 2018-2028 (US$mn)
Figure 6.25 Japan Electric Power Substation Automation by Module Market Forecast 2018-2028 (US$mn)
Figure 6.26 South Korea Electric Power Substation Automation by Module Market Forecast 2018-2028 (US$mn)
Figure 6.27 Rest of Asia Pacific Electric Power Substation Automation by Module Market Forecast 2018-2028 (US$mn)
Figure 6.28 Middle East and Africa Electric Power Substation Automation Market by Country AGR Forecast 2018-2028 (AGR %)
Figure 6.29 Middle East and Africa Electric Power Substation Automation Market by Country Forecast 2018-2028 (US$mn, Middle East and Africa Total Market Sales AGR %)
Figure 6.30 Middle East and Africa Electric Power Substation Automation Market Share By Country Forecast 2018, 2023, 2028 (% Share)
Figure 6.31 Saudi Arabia Electric Power Substation Automation by Module Market Forecast 2018-2028 (US$mn)
Figure 6.32 UAE Electric Power Substation Automation by Module Market Forecast 2018-2028 (US$mn)
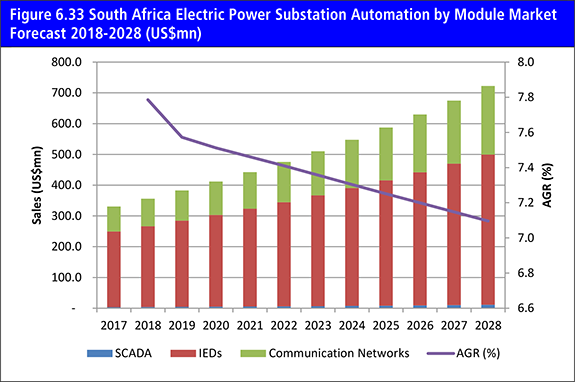
Figure 6.33 South Africa Electric Power Substation Automation by Module Market Forecast 2018-2028 (US$mn)
Figure 6.34 Rest of Middle East and Africa Electric Power Substation Automation by Module Market Forecast 2018-2028 (US$mn)
Figure 6.35 Latin America Electric Power Substation Automation Market by Country AGR Forecast 2018-2028 (AGR %)
Figure 6.36 Latin America Electric Power Substation Automation Market by Country Forecast 2018-2028 (US$mn, Middle East and Africa Total Market Sales AGR %)
Figure 6.37 Latin America Electric Power Substation Automation Market Share by Country Forecast 2018, 2023, 2028 (% Share)
Figure 6.38 Brazil Electric Power Substation Automation by Module Market Forecast 2018-2028 (US$mn)
Figure 6.39 Argentina Electric Power Substation Automation by Module Market Forecast 2018-2028 (US$mn)
Figure 6.40 Rest of Latin America Electric Power Substation Automation by Module Market Forecast 2018-2028 (US$mn)
Figure 9.1 ABB Ltd Total Company Sales 2011-2016 (US$m, AGR %)
Figure 9.2 ABB Ltd Sales in the Electric Power Substation Automation Market 2015-2016 (US$m, AGR %)
Figure 9.3 Eaton Corporation Plc Total Company Sales 2011-2016 (US$m, AGR %)
Figure 9.4 Eaton Corporation Plc Sales in the Electric Power Substation Automation Market 2012-2016 (US$m, AGR %)
Figure 9.5 General Electric Company Total Company Sales 2012-2016 (US$m, AGR %)
Figure 9.6 General Electric Company Sales in the Electric Power Substation Automation Market 2011-2016 (US$m, AGR %)
Figure 9.7 Schneider Electric SE Total Company Sales 2011-2016 (US$m, AGR %)
Figure 9.8 Schneider Electric SE Sales in the Electric Power Substation Automation Market 2012-2016 (US$m, AGR %)
Figure 9.9 Siemens AG Total Company Sales 2012-2017 (US$m, AGR %)
Figure 9.10 Siemens AG Sales in the Electric Power Substation Automation Market 2014-2017 (US$m, AGR %)
Figure 9.11 Crompton Greaves Limited Company Sales 2011-2016 (US$m, AGR %)
Figure 9.12 Crompton Greaves Limited Sales in the Gas Insulated Substation Market 2011-2016 (US$m, AGR %)
Figure 9.13 Honeywell International Inc. Total Company Sales 2013-2016 (US$m, AGR %)
Figure 9.14 Honeywell International Inc. Sales in the Smart Gas Metering Market 2015-2016 (US$m, AGR %)
Figure 9.15 Larsen & Toubro Limited Company Sales 2011-2016 (US$m, AGR %)
Figure 9.16 Larsen & Toubro Limited Sales in the Gas Insulated Substation Market 2011-2016 (US$m, AGR %)
Figure 9.17 Toshiba Corporation Total Company Sales 2013-2016 (US$m, AGR %)
Figure 9.18 Toshiba Corporation Sales in the Gas Insulated Substation Market 2015-2016 (US$m, AGR %)
Figure 9.19 Toshiba Corporation Total Company Sales 2011-2016 (US$m, AGR %)