Visiongain has calculated that the global Busbar Trunking System market will see a capital expenditure (CAPEX) of $5,983 mn in 2017.Read on to discover the potential business opportunities available.
Busbar is an electric device used to distribute power which conducts electricity within a distribution board, switchboard, substation and another electrical gadget.
Busbar trunking systems are majorly installed in the projects and applications which demand a rapid supply of electricity basically in remote areas. These systems can be further classified based on the type of insulation of sandwich insulation and air insulated and power ratings including lighting, low, medium and high.
The continuous fluctuations in electricity demand and supply and the need to replace the obsolete transmission and distribution network along with the installation of new structure has led to an increased demand for busbar trunking systems. These systems are essential to be installed in the remote areas and the off-grid locations.
The electric network is continuously witnessing stress due to fluctuation in demand and supply of electricity. Developing regions including Asia Pacific and Africa are heavily investing towards the expansion of transmission and distribution network with an aim to electrify the off-grid and remote areas. Governments in the regions have introduced various programs to electrify the remote areas.
The increasing demand for reliable and sustainable electricity supply is further expected to boost the demand for busbar trunking system.
Visiongain’s global Busbar Trunking System market report can keep you informed and up to date with the developments in the market, across six different regions: North America, Europe, Middle East, Africa, Asia Pacific and Latin America.
With reference to this report, it details the key investments trend in the global market, subdivided by regions, capital expenditure, by Insulation, by Power Rating and by Conductor Type. Through extensive secondary research and interviews with industry experts, visiongain has identified a series of market trends that will impact the Busbar Trunking System market over the forecast timeframe.
The report will answer questions such as:
– How is the Busbar Trunking System market evolving?
– What is driving and restraining Busbar Trunking System market dynamics?
– How will each Busbar Trunking System submarket segment grow over the forecast period and how much Sales will these submarkets account for in 2027?
– How will market shares of each Busbar Trunking System submarket develop from 2017-2027?
– Which individual technologies will prevail and how will these shifts be responded to?
– Which Busbar Trunking System submarket will be the main driver of the overall market from 2017-2027?
– How will political and regulatory factors influence regional Busbar Trunking System markets and submarkets?
– Will leading national Busbar Trunking System market broadly follow macroeconomic dynamics, or will individual country sectors outperform the rest of the economy?
– How will market shares of the national markets change by 2027 and which nation will lead the market in 2027?
– Who are the leading players and what are their prospects over the forecast period?
– How will the sector evolve as alliances form during the period between 2017 and 2027?
Five Reasons Why You Must Order and Read This Report Today:
1) The report provides forecasts for the global Busbar Trunking System market by Insulation, for the period 2017-2027
– Sandwich CAPEX 2017-2027
– Air Insulated CAPEX 2017-2027
2) The report also forecasts and analyses Busbar Trunking System market by Power Rating from 2017-2027
– Lighting CAPEX 2017-2027
– Low CAPEX 2017-2027
– Medium CAPEX 2017-2027
– High CAPEX 2017-2027
3) The report provides forecasts for the global Busbar Trunking System market by Conductor, for the period 2017-2027
– Copper CAPEX 2017-2027
– Aluminum CAPEX 2017-2027
4) The report reveals where and how companies are investing in Busbar Trunking System. We show you the prospects for the following regions, including individual breakdowns by Insulation, Power Rating and Conductor:
Africa
– South Africa CAPEX 2017-2027
– Egypt CAPEX 2017-2027
– Rest of Africa CAPEX 2017-2027
Asia Pacific
– India CAPEX 2017-2027
– China CAPEX 2017-2027
– South Korea CAPEX 2017-2027
– Japan CAPEX 2017-2027
– Rest of Asia Pacific CAPEX 2017-2027
North America
– US CAPEX 2017-2027
– Canada CAPEX 2017-2027
– Mexico CAPEX 2017-2027
Europe
– UK CAPEX 2017-2027
– Russia CAPEX 2017-2027
– France CAPEX 2017-2027
– Italy CAPEX 2017-2027
– Germany CAPEX 2017-2027
– Rest of Europe CAPEX 2017-2027
Latin America
– Argentina CAPEX 2017-2027
– Brazil CAPEX 2017-2027
– Rest of Latin America CAPEX 2017-2027
Middle East
– Saudi Arabia CAPEX 2017-2027
– UAE CAPEX 2017-2027
– Iran CAPEX 2017-2027
– Qatar CAPEX 2017-2027
– Rest of Middle East CAPEX 2017-2027
5) The report provides market share and detailed profiles of the leading companies operating within the Busbar Trunking System market:
– ABB Ltd.
– Eaton Corporation Plc
– General Electric Company
– Schneider Electric SE
– Siemens AG
– Larsen & Toubro Limited
– Godrej & Boyce Manufacturing Co. Ltd.
– Legrand
– WEG
– C&S Electric
This independent 294-page report guarantees you will remain better informed than your competitors. With 267 tables and figures examining the Busbar Trunking System market space, the report gives you a direct, detailed breakdown of the market. PLUS, Capital expenditure BY Insulation, BY Power Rating AND Conductor Type, as well as in-Depth analysis of leading companies in the Busbar Trunking System market that will keep your knowledge that one step ahead of your rivals.
This report is essential reading for you or anyone in the Energy sector. Purchasing this report today will help you to recognise those important market opportunities and understand the possibilities there. I look forward to receiving your order.
Visiongain is a trading partner with the US Federal Government
CCR Ref number: KD4R6
1. Report Overview
1.1 Global Busbar Trunking System Market Overview
1.2 Why You Should Read This Report
1.3 How This Report Delivers
1.4 Key Questions Answered by This Analytical Report Include:
1.5 Who is This Report For?
1.6 Methodology
1.6.1 Primary Research
1.6.2 Secondary Research
1.6.3 Market Evaluation & Forecasting Methodology
1.7 Frequently Asked Questions (FAQ)
1.8 Associated Visiongain Reports
1.9 About Visiongain
2. Introduction to the Busbar Trunking System Market
2.1 Busbar Trunking System Market Definition
2.2 Busbar Trunking System Market Structure
3. Global Busbar Trunking System Market 2017-2027
3.1 Global Busbar Trunking System Market Forecast 2017-2027
3.2 Busbar Trunking System Market Drivers & Restraints 2017
3.2.1 Drivers in the Busbar Trunking System Market
3.2.1.2 Compact Design and Easy Installation
3.2.1.3 Reliable and Continuous Service
3.2.1.4 Flexible and Effective Structure
3.2.2 Restraints in the Busbar Trunking System Market
3.2.2.1 Lack of Consumer Awareness
4. Global Busbar Trunking System Market By Insulation Forecast 2017-2027
4.1 Global Busbar Trunking System Market By Sandwich Insulation Forecast 2017-2027
4.2 Global Busbar Trunking System Market By Air Insulation Forecast 2017-2027
5. Global Busbar Trunking System Market By Power Rating Forecast 2017-2027
5.1 Global Busbar Trunking System Market By Lighting Forecast 2017-2027
5.2 Global Busbar Trunking System Market By Low Power Rating Forecast 2017-2027
5.3 Global Busbar Trunking System Market By Medium Power Rating Forecast 2017-2027
5.4 Global Busbar Trunking System Market By High Power Rating Forecast 2017-2027
6. Global Busbar Trunking System Market By Conductor Forecast 2017-2027
6.1 Global Busbar Trunking System Market By Copper Conductor Forecast 2017-2027
6.2 Global Busbar Trunking System Market By Aluminium Conductor Forecast 2017-2027
7. Leading Regional and National Busbar Trunking System Market Forecast 2017-2027
7.1 North America Busbar Trunking System Market Forecast 2017-2027
7.1.1 The US Busbar Trunking System Market Forecast 2017-2027
7.1.2 Canada Busbar Trunking System Market Forecast 2017-2027
7.1.3 Mexico Busbar Trunking System Market Forecast 2017-2027
7.2 Europe Busbar Trunking System Market Forecast 2017-2027
7.2.1 UK Busbar Trunking System Market Forecast 2017-2027
7.2.2 Russia Busbar Trunking System Market Forecast 2017-2027
7.2.3 Italy Busbar Trunking System Market Forecast 2017-2027
7.2.4 France Busbar Trunking System Market Forecast 2017-2027
7.2.5 Germany Busbar Trunking System Market Forecast 2017-2027
7.2.6 Rest of Europe Busbar Trunking System Market Forecast 2017-2027
7.3 Asia Pacific Busbar Trunking System Market Forecast 2017-2027
7.3.1 China Busbar Trunking System Market Forecast 2017-2027
7.3.2 India Busbar Trunking System Market Forecast 2017-2027
7.3.3 Japan Busbar Trunking System Market Forecast 2017-2027
7.3.4 South Korea Busbar Trunking System Market Forecast 2017-2027
7.3.5 Rest of Asia Pacific Busbar Trunking System Market Forecast 2017-2027
7.4 Middle East Busbar Trunking System Market Forecast 2017-2027
7.4.1 Saudi Arabia Busbar Trunking System Market Forecast 2017-2027
7.4.2 UAE Busbar Trunking System Market Forecast 2017-2027
7.4.3 Iran Busbar Trunking System Market Forecast 2017-2027
7.4.4 Qatar Busbar Trunking System Market Forecast 2017-2027
7.4.5 Rest of Middle East Busbar Trunking System Market Forecast 2017-2027
7.5 Africa Busbar Trunking System Market Forecast 2017-2027
7.5.1 South Africa Busbar Trunking System Market Forecast 2017-2027
7.5.2 Egypt Busbar Trunking System Market Forecast 2017-2027
7.5.3 Rest of Africa Busbar Trunking System Market Forecast 2017-2027
7.6 Latin America Busbar Trunking System Market Forecast 2017-2027
7.6.1 Argentina Busbar Trunking System Market Forecast 2017-2027
7.6.2 Brazil Busbar Trunking System Market Forecast 2017-2027
7.6.3 Rest of Latin America Busbar Trunking System Market Forecast 2017-2027
8. SWOT Analysis of the Busbar Trunking System Market 2017-2027
8.1 Strengths
8.2 Weaknesses
8.3 Opportunities
8.4 Threats
9. PEST Analysis of the Busbar Trunking System Market 2017-2027
9.1 PEST Analysis
10. The Leading Companies in the Busbar Trunking System Market
10.1 ABB Ltd.
10.1.1 ABB Ltd Total Company Sales 2011-2016
10.1.2 ABB Ltd Sales in the Busbar Trunking System Market 2015-2016
10.2 Eaton Corporation Plc
10.2.1 Eaton Corporation Plc Total Company Sales 2011-2016
10.2.2 Eaton Corporation Plc Sales in the Busbar Trunking System Market 2012-2016
10.3 General Electric Company
10.3.1 General Electric Company Total Company Sales 2012-2016
10.3.2 General Electric Company Sales in the Busbar Trunking System Market 2011-2016
10.4 Schneider Electric SE
10.4.1 Schneider Electric SE Total Company Sales 2011-2016
10.4.2 Schneider Electric SE Sales in the Busbar Trunking System Market 2012-2016
10.5 Siemens AG
10.5.1 Siemens AG Total Company Sales 2011-2016
10.5.2 Siemens AG Sales in the Busbar Trunking System Market 2014-2016
10.6 Larsen & Toubro Limited
10.6.1 Larsen & Toubro Limited Total Company Sales 2011-2016
10.6.2 Larsen & Toubro Limited Sales in the Busbar Trunking System Market 2011-2016
10.7 Godrej & Boyce Manufacturing Co. Ltd.
10.7.1 Godrej & Boyce Manufacturing Co. Ltd. Total Company Sales 2014-2016
10.7.2 Godrej & Boyce Manufacturing Co. Ltd. Sales in the Busbar Trunking System Market 2014-2016
10.8 Legrand
10.8.1 Legrand Total Company Sales 2011-2016
10.9 WEG
10.9.1 WEG Total Company Sales 2011-2016
10.9.2 WEG Sales in the Busbar Trunking System Market 2011-2016
10.10 C&S Electric
11. Conclusions and Recommendations
11.1 Key Findings
11.2 Recommendations
12. Glossary
Appendix
Associated Visiongain Reports
Visiongain Report Sales Order Form
Appendix A
Appendix B
Visiongain Report Evaluation Form
List of Tables
Table 1.1 Leading Regional Busbar Trunking System Market Forecast 2017-2027 (US$mn, Global AGR %, Cumulative)
Table 1.2 Global Busbar Trunking System By Insulation, Power Rating and Conductor Type Forecast 2017-2027 (US$mn, AGR %, CAGR %, Cumulative)
Table 3.1 Global Busbar Trunking System Market Forecast 2017-2027 (US$mn, AGR %, CAGR %, Cumulative)
Table 3.2 Busbar Trunking System Market Drivers & Restraints
Table 4.1 Global Busbar Trunking System Market By Insulation Forecast 2017-2027 (US$mn, AGR %, Cumulative)
Table 4.2 Global Busbar Trunking System Market By Insulation By Region Forecast 2017-2027 (US$mn, Cumulative, Global AGR %)
Table 4.3 Global Busbar Trunking System Market By Insulation CAGR Forecast 2017-2022, 2022-2027, 2017-2027 (CAGR %)
Table 4.4 Global Busbar Trunking System Market By Sandwich Insulation Forecast 2017-2027 (US$mn, AGR %, CAGR %, Cumulative)
Table 4.5 Global Busbar Trunking System Sandwich Insulation Regional Market CAGR Forecast 2017-2022, 2022-2027, 2017-2027 (CAGR %)
Table 4.6 Global Busbar Trunking System Market By Air Insulation by Region Market Forecast 2017-2027 (US$mn, AGR %, CAGR %, Cumulative)
Table 4.7 Global Busbar Trunking System Air Insulation Market Share by Region Market CAGR Forecast 2017-2022, 2022-2027, 2017-2027 (CAGR %)
Table 5.1 Global Busbar Trunking System Market By Power Rating Forecast 2017-2027 (US$mn, AGR %, Cumulative)
Table 5.2 Global Busbar Trunking System Market By Power Rating By Region Forecast 2017-2027 (US$mn, Cumulative, Global AGR %)
Table 5.3 Global Busbar Trunking System Market By Power Rating CAGR Forecast 2017-2022, 2022-2027, 2017-2027 (CAGR %)
Table 5.4 Global Busbar Trunking System Market By Lighting Forecast 2017-2027 (US$mn, AGR %, CAGR %, Cumulative)
Table 5.5 Global Busbar Trunking System Lighting Regional Market CAGR Forecast 2017-2022, 2022-2027, 2017-2027 (CAGR %)
Table 5.6 Global Busbar Trunking System Market By Low Power Rating Forecast 2017-2027 (US$mn, AGR %, CAGR %, Cumulative)
Table 5.7 Global Busbar Trunking System Low Power Rating Regional Market CAGR Forecast 2017-2022, 2022-2027, 2017-2027 (CAGR %)
Table 5.8 Global Busbar Trunking System Market By Medium Power Rating Forecast 2017-2027 (US$mn, AGR %, CAGR %, Cumulative)
Table 5.9 Global Busbar Trunking System Medium Power Rating Regional Market CAGR Forecast 2017-2022, 2022-2027, 2017-2027 (CAGR %)
Table 5.10 Global Busbar Trunking System Market By High Power Rating Forecast 2017-2027 (US$mn, AGR %, CAGR %, Cumulative)
Table 5.11 Global Busbar Trunking System High Power Rating Regional Market CAGR Forecast 2017-2022, 2022-2027, 2017-2027 (CAGR %)
Table 6.1 Global Busbar Trunking System Market By Conductor Forecast 2017-2027 (US$mn, AGR %, Cumulative)
Table 6.2 Global Busbar Trunking System Market By Conductor By Region Forecast 2017-2027 (US$mn, Cumulative, Global AGR %)
Table 6.3 Global Busbar Trunking System Market By Conductor CAGR Forecast 2017-2022, 2022-2027, 2017-2027 (CAGR %)
Table 6.4 Global Busbar Trunking System Market By Copper Conductor Forecast 2017-2027 (US$mn, AGR %, CAGR %, Cumulative)
Table 6.5 Global Busbar Trunking System Copper Conductor Regional Market CAGR Forecast 2017-2022, 2022-2027, 2017-2027 (CAGR %)
Table 6.6 Global Busbar Trunking System Market By Aluminium Conductor by Region Market Forecast 2017-2027 (US$mn, AGR %, CAGR %, Cumulative)
Table 6.7 Global Busbar Trunking System Aluminium Conductor Market Share by Region Market CAGR Forecast 2017-2022, 2022-2027, 2017-2027 (CAGR %)
Table 7.1 Leading Regional Busbar Trunking System Market Forecast 2017-2027 (US$mn, Global AGR %, Cumulative)
Table 7.2 Regional Busbar Trunking System Market Percentage Change in Market Share 2017-2022, 2022-2027, 2017-2027 (% Change)
Table 7.3 North America Busbar Trunking System Market by Country Forecast 2017-2027 (US$mn, AGR %, CAGR %, Cumulative)
Table 7.4 The US Busbar Trunking System By Insulation, Power Rating & Conductor Type Forecast 2017-2027 (US$mn, AGR %, CAGR %, Cumulative)
Table 7.5 Canada Busbar Trunking System By Insulation, Power Rating & Conductor Type Forecast 2017-2027 (US$mn, AGR %, CAGR %, Cumulative)
Table 7.6 Mexico Busbar Trunking System By Insulation, Power Rating & Conductor Type Forecast 2017-2027 (US$mn, AGR %, CAGR %, Cumulative)
Table 7.7 Europe Busbar Trunking System Market by Country Forecast 2017-2027 (US$mn, AGR %, CAGR %, Cumulative)
Table 7.8 UK Busbar Trunking System By Insulation, Power Rating & Conductor Type Forecast 2017-2027 (US$mn, AGR %, CAGR %, Cumulative)
Table 7.9 Russia Busbar Trunking System By Insulation, Power Rating & Conductor Type Forecast 2017-2027 (US$mn, AGR %, CAGR %, Cumulative)
Table 7.10 Italy Busbar Trunking System By Insulation, Power Rating & Conductor Type Forecast 2017-2027 (US$mn, AGR %, CAGR %, Cumulative)
Table 7.11 France Busbar Trunking System By Insulation, Power Rating & Conductor Type Forecast 2017-2027 (US$mn, AGR %, CAGR %, Cumulative)
Table 7.12 Germany Busbar Trunking System By Insulation, Power Rating & Conductor Type Forecast 2017-2027 (US$mn, AGR %, CAGR %, Cumulative)
Table 7.13 Rest of Europe Busbar Trunking System By Insulation, Power Rating & Conductor Type Forecast 2017-2027 (US$mn, AGR %, CAGR %, Cumulative)
Table 7.14 Asia Pacific Busbar Trunking System Market by Country Forecast 2017-2027 (US$mn, AGR %, CAGR %, Cumulative)
Table 7.15 China Busbar Trunking System By Insulation, Power Rating & Conductor Type Forecast 2017-2027 (US$mn, AGR %, CAGR %, Cumulative)
Table 7.16 India Busbar Trunking System By Insulation, Power Rating & Conductor Type Forecast 2017-2027 (US$mn, AGR %, CAGR %, Cumulative)
Table 7.17 Japan Busbar Trunking System By Insulation, Power Rating & Conductor Type Forecast 2017-2027 (US$mn, AGR %, CAGR %, Cumulative)
Table 7.18 South Korea Busbar Trunking System By Insulation, Power Rating & Conductor Type Forecast 2017-2027 (US$mn, AGR %, CAGR %, Cumulative)
Table 7.19 Rest of Asia Pacific Busbar Trunking System By Insulation, Power Rating & Conductor Type Forecast 2017-2027 (US$mn, AGR %, CAGR %, Cumulative)
Table 7.20 Middle East Busbar Trunking System Market by Country Forecast 2017-2027 (US$mn, AGR %, CAGR %, Cumulative)
Table 7.21 Saudi Arabia Busbar Trunking System By Insulation, Power Rating & Conductor Type Forecast 2017-2027 (US$mn, AGR %, CAGR %, Cumulative)
Table 7.22 UAE Busbar Trunking System By Insulation, Power Rating & Conductor Type Forecast 2017-2027 (US$mn, AGR %, CAGR %, Cumulative)
Table 7.23 Iran Busbar Trunking System By Insulation, Power Rating & Conductor Type Forecast 2017-2027 (US$mn, AGR %, CAGR %, Cumulative)
Table 7.24 Qatar Busbar Trunking System By Insulation, Power Rating & Conductor Type Forecast 2017-2027 (US$mn, AGR %, CAGR %, Cumulative)
Table 7.25 Rest of Middle East Busbar Trunking System By Insulation, Power Rating & Conductor Type Forecast 2017-2027 (US$mn, AGR %, CAGR %, Cumulative)
Table 7.26 Africa Busbar Trunking System Market by Country Forecast 2017-2027 (US$mn, AGR %, CAGR %, Cumulative)
Table 7.27 South Africa Busbar Trunking System By Insulation, Power Rating & Conductor Type Forecast 2017-2027 (US$mn, AGR %, CAGR %, Cumulative)
Table 7.28 Egypt Busbar Trunking System By Insulation, Power Rating & Conductor Type Forecast 2017-2027 (US$mn, AGR %, CAGR %, Cumulative)
Table 7.29 Rest of Africa Busbar Trunking System By Insulation, Power Rating & Conductor Type Forecast 2017-2027 (US$mn, AGR %, CAGR %, Cumulative)
Table 7.30 Latin America Busbar Trunking System Market by Country Forecast 2017-2027 (US$mn, AGR %, CAGR %, Cumulative)
Table 7.31 Argentina Busbar Trunking System By Insulation, Power Rating & Conductor Type Forecast 2017-2027 (US$mn, AGR %, CAGR %, Cumulative)
Table 7.32 Brazil Busbar Trunking System By Insulation, Power Rating & Conductor Type Forecast 2017-2027 (US$mn, AGR %, CAGR %, Cumulative)
Table 7.33 Rest of Latin America Busbar Trunking System By Insulation, Power Rating & Conductor Type Forecast 2017-2027 (US$mn, AGR %, CAGR %, Cumulative)
Table 8.1 Global Busbar Trunking System Market SWOT Analysis 2017-2027
Table 9.1 Global Busbar Trunking System Market PEST Analysis 2017-2027
Table 10.1 ABB Ltd 2016 (CEO, Total Company Sales US$m, Sales From Company Division That Includes Busbar Trunking System(US$m), Share of Total Company Sales From Company Division That Includes Busbar Trunking System (%), Net Income / Loss US$m, Net Capital Expenditure US$m, Strongest Business Region, Business Segment in the Market, HQ, Founded, No. of Employees, IR Contact, Ticker, Website)
Table 10.2 ABB Ltd Total Company Sales 2010-2016 (US$m, AGR %)
Table 10.3 ABB Ltd Sales in the Busbar Trunking System Market 2014-2016 (US$m, AGR %)
Table 10.4 Eaton Corporation Plc 2016 (CEO, Total Company Sales US$m, Sales From Company Division That Includes Busbar Trunking System(US$m), Share of Total Company Sales From Company Division That Includes Busbar Trunking System (%), Net Income / Loss US$m, Net Capital Expenditure US$m, Strongest Business Region, Business Segment in the Market, HQ, Founded, No. of Employees, IR Contact, Ticker, Website)
Table 10.5 Eaton Corporation Plc Total Company Sales 2010-2016 (US$m, AGR %)
Table 10.6 Eaton Corporation Plc Sales in the Busbar Trunking System Market 2011-2016 (US$m, AGR %)
Table 10.7 General Electric Company 2016 (CEO, Total Company Sales US$m, Sales From Company Division That Includes Busbar Trunking System(US$m), Share of Total Company Sales From Company Division That Includes Busbar Trunking System (%), Net Income / Loss US$m, Net Capital Expenditure US$m, Strongest Business Region, Business Segment in the Market, HQ, Founded, No. of Employees, IR Contact, Ticker, Website)
Table 10.8 General Electric Company Total Company Sales 2011-2016 (US$m, AGR %)
Table 10.9 General Electric Company Sales in the Busbar Trunking System Market 2010-2016 (US$m, AGR %)
Table 10.10 Schneider Electric SE 2016 (CEO, Total Company Sales US$m, Sales From Company Division That Includes Busbar Trunking System(US$m), Share of Total Company Sales From Company Division That Includes Busbar Trunking System (%), Net Income / Loss US$m, Net Capital Expenditure US$m, Strongest Business Region, Business Segment in the Market, HQ, Founded, No. of Employees, IR Contact, Ticker, Website)
Table 10.11 Schneider Electric SE Total Company Sales 2010-2016 (US$m, AGR %)
Table 10.12 Schneider Electric SE Sales in the Busbar Trunking System Market 2011-2016 (US$m, AGR %)
Table 10.13 Siemens AG Profile 2016 (CEO, Total Company Sales US$m, Sales From Company Division That Includes Busbar Trunking System(US$m), Share of Total Company Sales From Company Division That Includes Busbar Trunking System (%), Net Income / Loss US$m, Net Capital Expenditure US$m, Strongest Business Region, Business Segment in the Market, HQ, Founded, No. of Employees, IR Contact, Ticker, Website)
Table 10.14 Siemens AG Total Company Sales 2010-2016 (US$m, AGR %)
Table 10.15 Siemens AG Sales in the Busbar Trunking System Market 2013-2016 (US$m, AGR %)
Table 10.16 Larsen & Toubro Limited 2016 (CEO, Total Company Sales US$m, Sales From Company Division That Includes Busbar Trunking System(US$m), Share of Total Company Sales From Company Division That Includes Busbar Trunking System (%), Net Income / Loss US$m, Net Capital Expenditure US$m, Strongest Business Region, Business Segment in the Market, HQ, Founded, No. of Employees, IR Contact, Ticker, Website)
Table 10.17 Larsen & Toubro Limited Total Company Sales 2010-2016 (US$m, AGR %)
Table 10.18 Larsen & Toubro Limited Sales in the Busbar Trunking System Market 2010-2016 (US$m, AGR %)
Table 10.19 Godrej & Boyce Manufacturing Co. Ltd. 2016 (CEO, Total Company Sales US$m, Sales From Company Division That Includes Busbar Trunking System(US$m), Share of Total Company Sales From Company Division That Includes Busbar Trunking System (%), Net Income / Loss US$m, Net Capital Expenditure US$m, Strongest Business Region, Business Segment in the Market, Submarket Involvement, HQ, Founded, No. of Employees, IR Contact, Ticker, Website)
Table 10.20 Godrej & Boyce Manufacturing Co. Ltd. Total Company Sales 2013-2016 (US$m, AGR %)
Table 10.21 Godrej & Boyce Manufacturing Co. Ltd. Sales in the Busbar Trunking System Market 2013-2016 (US$m, AGR %)
Table 10.22 Legrand 2016 (CEO, Total Company Sales US$m, Sales in the Market US$m, Share of Company Sales from Busbar Trunking System Market %, Net Income / Loss US$m, Net Capital Expenditure US$m, Strongest Business Region, Business Segment in the Market, HQ, Founded, No. of Employees, IR Contact, Ticker, Website)
Table 10.23 Legrand Total Company Sales 2010-2016 (US$m, AGR %)
Table 10.24 WEG 2016 (CEO, Total Company Sales US$m, Sales From Company Division That Includes Busbar Trunking System(US$m), Share of Total Company Sales From Company Division That Includes Busbar Trunking System (%), Net Income / Loss US$m, Net Capital Expenditure US$m, Strongest Business Region, Business Segment in the Market, HQ, Founded, No. of Employees, IR Contact, Ticker, Website)
Table 10.25 WEG Total Company Sales 2010-2016 (US$m, AGR %)
Table 10.26 WEG Sales in the Busbar Trunking System Market 2010-2016 (US$m, AGR %)
Table 10.27 C&S Electric 2016 (CEO, Total Company Sales US$m, Sales in the Market US$m, Share of Company Sales from Busbar Trunking System Market %, Net Income / Loss US$m, Net Capital Expenditure US$m, Strongest Business Region, Business Segment in the Market, HQ, Founded, No. of Employees, IR Contact, Ticker, Website)
Table 11.1 Global Busbar Trunking System Market By Insulation Forecast 2017-2027 (US$mn, AGR %, Cumulative)
Table 11.2 Global Busbar Trunking System Market By Power Rating Forecast 2017-2027 (US$mn, AGR %, Cumulative)
Table 11.3 Global Busbar Trunking System Market By Conductor Forecast 2017-2027 (US$mn, AGR %, Cumulative)
Table 11.4 Leading Regional Busbar Trunking System Market Forecast 2017-2027 (US$mn, Global AGR %, Cumulative)
List of Figures
Figure 2.1 Global Busbar Trunking System Market Segmentation Overview
Figure 3.1 Global Busbar Trunking System Market Forecast 2017-2027 (US$mn, AGR %)
Figure 4.1 Global Busbar Trunking System Market By Insulation AGR Forecast 2017-2027 (AGR %)
Figure 4.2 Global Busbar Trunking System Market By Insulation Forecast 2017-2027 (US$mn, Global AGR %)
Figure 4.3 Global Busbar Trunking System Market By Insulation Share Forecast 2017 (% Share)
Figure 4.4 Global Busbar Trunking System Market By Insulation Share Forecast 2022 (% Share)
Figure 4.5 Global Busbar Trunking System Market By Insulation Share Forecast 2027 (% Share)
Figure 4.6 Global Busbar Trunking System Sandwich Insulation by Region Market AGR Forecast 2017-2027 (AGR %)
Figure 4.7 Global Busbar Trunking System Sandwich Insulation by Region Market 2017-2027 (US$mn, Global AGR %)
Figure 4.8 Global Busbar Trunking System Sandwich Insulation Market Share by Region Market Forecast2017 (% Share)
Figure 4.9 Global Busbar Trunking System Sandwich Insulation Market Share by Region Market Forecast 2022 (% Share)
Figure 4.10 Global Busbar Trunking System Sandwich Insulation Market Share by Region Market Forecast 2027 (% Share)
Figure 4.11 Global Busbar Trunking System Air Insulation by Region Market AGR Forecast 2017-2027 (AGR %)
Figure 4.12 Global Busbar Trunking System Air Insulation by Region Market 2017-2027 (US$mn, Global AGR %)
Figure 4.13 Global Busbar Trunking System Air Insulation Market Share by Region Market Forecast2017 (% Share)
Figure 4.14 Global Busbar Trunking System Air Insulation Market Share by Region Market Forecast 2022 (% Share)
Figure 4.15 Global Busbar Trunking System Air Insulation Market Share by Region Market Forecast 2027 (% Share)
Figure 5.1 Global Busbar Trunking System Market By Power Rating AGR Forecast 2017-2027 (AGR %)
Figure 5.2 Global Busbar Trunking System Market By Power Rating Forecast 2017-2027 (US$mn, Global AGR %)
Figure 5.3 Global Busbar Trunking System Market By Power Rating Share Forecast 2017 (% Share)
Figure 5.4 Global Busbar Trunking System Market By Power Rating Share Forecast 2022 (% Share)
Figure 5.5 Global Busbar Trunking System Market By Power Rating Share Forecast 2027 (% Share)
Figure 5.6 Global Busbar Trunking System Lighting by Region Market AGR Forecast 2017-2027 (AGR %)
Figure 5.7 Global Busbar Trunking System Lighting by Region Market 2017-2027 (US$mn, Global AGR %)
Figure 5.8 Global Busbar Trunking System Lighting Market Share by Region Market Forecast2017 (% Share)
Figure 5.9 Global Busbar Trunking System Lighting Market Share by Region Market Forecast 2022 (% Share)
Figure 5.10 Global Busbar Trunking System Lighting Market Share by Region Market Forecast 2027 (% Share)
Figure 5.11 Global Busbar Trunking System Low Power Rating by Region Market AGR Forecast 2017-2027 (AGR %)
Figure 5.12 Global Busbar Trunking System Low Power Rating by Region Market 2017-2027 (US$mn, Global AGR %)
Figure 5.13 Global Busbar Trunking System Low Power Rating Market Share by Region Market Forecast 2017 (% Share)
Figure 5.14 Global Busbar Trunking System Low Power Rating Market Share by Region Market Forecast 2022 (% Share)
Figure 5.15 Global Busbar Trunking System Low Power Rating Market Share by Region Market Forecast 2027 (% Share)
Figure 5.16 Global Busbar Trunking System Medium Power Rating by Region Market AGR Forecast 2017-2027 (AGR %)
Figure 5.17 Global Busbar Trunking System Medium Power Rating by Region Market 2017-2027 (US$mn, Global AGR %)
Figure 5.18 Global Busbar Trunking System Medium Power Rating Market Share by Region Market Forecast 2017 (% Share)
Figure 5.19 Global Busbar Trunking System Medium Power Rating Market Share by Region Market Forecast 2022 (% Share)
Figure 5.20 Global Busbar Trunking System Medium Power Rating Market Share by Region Market Forecast 2027 (% Share)
Figure 5.21 Global Busbar Trunking System High Power Rating by Region Market AGR Forecast 2017-2027 (AGR %)
Figure 5.22 Global Busbar Trunking System High Power Rating by Region Market 2017-2027 (US$mn, Global AGR %)
Figure 5.23 Global Busbar Trunking System High Power Rating Market Share by Region Market Forecast 2017 (% Share)
Figure 5.24 Global Busbar Trunking System High Power Rating Market Share by Region Market Forecast 2022 (% Share)
Figure 5.25 Global Busbar Trunking System High Power Rating Market Share by Region Market Forecast 2027 (% Share)
Figure 6.1 Global Busbar Trunking System Market By Conductor AGR Forecast 2017-2027 (AGR %)
Figure 6.2 Global Busbar Trunking System Market By Conductor Forecast 2017-2027 (US$mn, Global AGR %)
Figure 6.3 Global Busbar Trunking System Market By Conductor Share Forecast 2017 (% Share)
Figure 6.4 Global Busbar Trunking System Market By Conductor Share Forecast 2022 (% Share)
Figure 6.5 Global Busbar Trunking System Market By Conductor Share Forecast 2027 (% Share)
Figure 6.6 Global Busbar Trunking System Copper Conductor by Region Market AGR Forecast 2017-2027 (AGR %)
Figure 6.7 Global Busbar Trunking System Copper Conductor by Region Market 2017-2027 (US$mn, Global AGR %)
Figure 6.8 Global Busbar Trunking System Copper Conductor Market Share by Region Market Forecast 2017 (% Share)
Figure 6.9 Global Busbar Trunking System Copper Conductor Market Share by Region Market Forecast 2022 (% Share)
Figure 6.10 Global Busbar Trunking System Copper Conductor Market Share by Region Market Forecast 2027 (% Share)
Figure 6.11 Global Busbar Trunking System Aluminium Conductor by Region Market AGR Forecast 2017-2027 (AGR %)
Figure 6.12 Global Busbar Trunking System Aluminium Conductor by Region Market 2017-2027 (US$mn, Global AGR %)
Figure 6.13 Global Busbar Trunking System Aluminium Conductor Market Share by Region Market Forecast2017 (% Share)
Figure 6.14 Global Busbar Trunking System Aluminium Conductor Market Share by Region Market Forecast 2022 (% Share)
Figure 6.15 Global Busbar Trunking System Aluminium Conductor Market Share by Region Market Forecast 2027 (% Share)
Figure 7.1 Global Busbar Trunking System Market by Region Market Forecast 2017-2027 (US$mn, Global AGR %)
Figure 7.2 Global Busbar Trunking System Market by Region Market AGR Forecast 2017-2027 (AGR %)
Figure 7.3 Global Busbar Trunking System Market by Regional Market Share Forecast 2017 (% Share)
Figure 7.4 Global Busbar Trunking System Market by Regional Market Share Forecast 2022 (% Share)
Figure 7.5 Global Busbar Trunking System Market by Regional Market Share Forecast 2027 (% Share)
Figure 7.6 North America Busbar Trunking System Market by Country AGR Forecast 2017-2027 (AGR %)
Figure 7.7 North America Busbar Trunking System by Country Forecast 2017-2027 (US$mn, North America Total Market Sales AGR %)
Figure 7.8 North America Busbar Trunking System Market Share by Country Forecast 2017, 2022, 2027 (% Share)
Figure 7.9 US Busbar Trunking System by Insulation Market Forecast 2017-2027 (US$mn)
Figure 7.10 US Busbar Trunking System by Power Rating Market Forecast 2017-2027 (US$mn)
Figure 7.11 US Busbar Trunking System by Conductor Market Forecast 2017-2027 (US$mn)
Figure 7.12 Canada Busbar Trunking System by Insulation Market Forecast 2017-2027 (US$mn)
Figure 7.13 Canada Busbar Trunking System by Power Rating Market Forecast 2017-2027 (US$mn)
Figure 7.14 Canada Busbar Trunking System by Conductor Market Forecast 2017-2027 (US$mn)
Figure 7.15 Mexico Busbar Trunking System by Insulation Market Forecast 2017-2027 (US$mn)
Figure 7.16 Mexico Busbar Trunking System by Power Rating Market Forecast 2017-2027 (US$mn)
Figure 7.17 Mexico Busbar Trunking System by Conductor Market Forecast 2017-2027 (US$mn)
Figure 7.18 Europe Busbar Trunking System Market by Country AGR Forecast 2017-2027 (AGR %)
Figure 7.19 Europe Busbar Trunking System Market by Country Forecast 2017-2027 (US$mn, Europe Total Market Sales AGR %)
Figure 7.20 Europe Busbar Trunking System Market Share by Country Forecast 2017, 2022, 2027 (% Share)
Figure 7.21 UK Busbar Trunking System by Insulation Market Forecast 2017-2027 (US$mn)
Figure 7.22 UK Busbar Trunking System by Power Rating Market Forecast 2017-2027 (US$mn)
Figure 7.23 UK Busbar Trunking System by Conductor Market Forecast 2017-2027 (US$mn)
Figure 7.24 Russia Busbar Trunking System by Insulation Market Forecast 2017-2027 (US$mn)
Figure 7.25 Russia Busbar Trunking System by Power Rating Market Forecast 2017-2027 (US$mn)
Figure 7.26 Russia Busbar Trunking System by Conductor Market Forecast 2017-2027 (US$mn)
Figure 7.27 Italy Busbar Trunking System by Insulation Market Forecast 2017-2027 (US$mn)
Figure 7.28 Italy Busbar Trunking System by Power Rating Market Forecast 2017-2027 (US$mn)
Figure 7.29 Italy Busbar Trunking System by Conductor Market Forecast 2017-2027 (US$mn)
Figure 7.30 France Busbar Trunking System by Insulation Market Forecast 2017-2027 (US$mn)
Figure 7.31 France Busbar Trunking System by Power Rating Market Forecast 2017-2027 (US$mn)
Figure 7.32 France Busbar Trunking System by Conductor Market Forecast 2017-2027 (US$mn)
Figure 7.33 Germany Busbar Trunking System by Insulation Market Forecast 2017-2027 (US$mn)
Figure 7.34 Germany Busbar Trunking System by Power Rating Market Forecast 2017-2027 (US$mn)
Figure 7.35 Germany Busbar Trunking System by Conductor Market Forecast 2017-2027 (US$mn)
Figure 7.36 Rest of Europe Busbar Trunking System by Insulation Market Forecast 2017-2027 (US$mn)
Figure 7.37 Rest of Europe Busbar Trunking System by Power Rating Market Forecast 2017-2027 (US$mn)
Figure 7.38 Rest of Europe Busbar Trunking System by Conductor Market Forecast 2017-2027 (US$mn)
Figure 7.39 Asia Pacific Busbar Trunking System Market by Country AGR Forecast 2017-2027 (AGR %)
Figure 7.40 Asia Pacific Busbar Trunking System Market by Country Forecast 2017-2027 (US$mn, Asia Pacific Total Market Sales AGR %)
Figure 7.41 Asia Pacific Busbar Trunking System Market Share by Country Forecast 2017, 2022, 2027 (% Share)
Figure 7.42 China Busbar Trunking System by Insulation Market Forecast 2017-2027 (US$mn)
Figure 7.43 China Busbar Trunking System by Power Rating Market Forecast 2017-2027 (US$mn)
Figure 7.44 China Busbar Trunking System by Conductor Market Forecast 2017-2027 (US$mn)
Figure 7.45 India Busbar Trunking System by Insulation Market Forecast 2017-2027 (US$mn)
Figure 7.46 India Busbar Trunking System by Power Rating Market Forecast 2017-2027 (US$mn)
Figure 7.47 India Busbar Trunking System by Conductor Market Forecast 2017-2027 (US$mn)
Figure 7.48 Japan Busbar Trunking System by Insulation Market Forecast 2017-2027 (US$mn)
Figure 7.49 Japan Busbar Trunking System by Power Rating Market Forecast 2017-2027 (US$mn)
Figure 7.50 Japan Busbar Trunking System by Conductor Market Forecast 2017-2027 (US$mn)
Figure 7.51 South Korea Busbar Trunking System by Insulation Market Forecast 2017-2027 (US$mn)
Figure 7.52 South Korea Busbar Trunking System by Power Rating Market Forecast 2017-2027 (US$mn)
Figure 7.53 South Korea Busbar Trunking System by Conductor Market Forecast 2017-2027 (US$mn)
Figure 7.54 Rest of Asia Pacific Busbar Trunking System by Insulation Market Forecast 2017-2027 (US$mn)
Figure 7.55 Rest of Asia Pacific Busbar Trunking System by Power Rating Market Forecast 2017-2027 (US$mn)
Figure 7.56 Rest of Asia Pacific Busbar Trunking System by Conductor Market Forecast 2017-2027 (US$mn)
Figure 7.57 Middle East Busbar Trunking System Market by Country AGR Forecast 2017-2027 (AGR %)
Figure 7.58 Middle East Busbar Trunking System Market by Country Forecast 2017-2027 (US$mn, Middle East Total Market Sales AGR %)
Figure 7.59 Middle East Busbar Trunking System Market Share By Country Forecast 2017, 2022, 2027 (% Share)
Figure 7.60 Saudi Arabia Busbar Trunking System by Insulation Market Forecast 2017-2027 (US$mn)
Figure 7.61 Saudi Arabia Busbar Trunking System by Power Rating Market Forecast 2017-2027 (US$mn)
Figure 7.62 Saudi Arabia Busbar Trunking System by Conductor Market Forecast 2017-2027 (US$mn)
Figure 7.63 UAE Busbar Trunking System by Insulation Market Forecast 2017-2027 (US$mn)
Figure 7.64 UAE Busbar Trunking System by Power Rating Market Forecast 2017-2027 (US$mn)
Figure 7.65 UAE Busbar Trunking System by Conductor Market Forecast 2017-2027 (US$mn)
Figure 7.66 Iran Busbar Trunking System by Insulation Market Forecast 2017-2027 (US$mn)
Figure 7.67 Iran Busbar Trunking System by Power Rating Market Forecast 2017-2027 (US$mn)
Figure 7.68 Iran Busbar Trunking System by Conductor Market Forecast 2017-2027 (US$mn)
Figure 7.69 Qatar Busbar Trunking System by Insulation Market Forecast 2017-2027 (US$mn)
Figure 7.70 Qatar Busbar Trunking System by Power Rating Market Forecast 2017-2027 (US$mn)
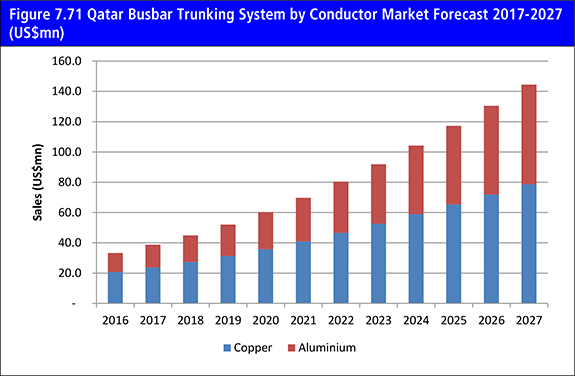
Figure 7.71 Qatar Busbar Trunking System by Conductor Market Forecast 2017-2027 (US$mn)
Figure 7.72 Rest of Middle East Busbar Trunking System by Insulation Market Forecast 2017-2027 (US$mn)
Figure 7.73 Rest of Middle East Busbar Trunking System by Power Rating Market Forecast 2017-2027 (US$mn)
Figure 7.74 Rest of Middle East Busbar Trunking System by Conductor Market Forecast 2017-2027 (US$mn)
Figure 7.75 Africa Busbar Trunking System Market by Country AGR Forecast 2017-2027 (AGR %)
Figure 7.76 Africa Busbar Trunking System Market by Country Forecast 2017-2027 (US$mn, Middle East and Africa Total Market Sales AGR %)
Figure 7.77 Africa Busbar Trunking System Market Share by Country Forecast 2017, 2022, 2027 (% Share)
Figure 7.78 South Africa Busbar Trunking System by Insulation Market Forecast 2017-2027 (US$mn)
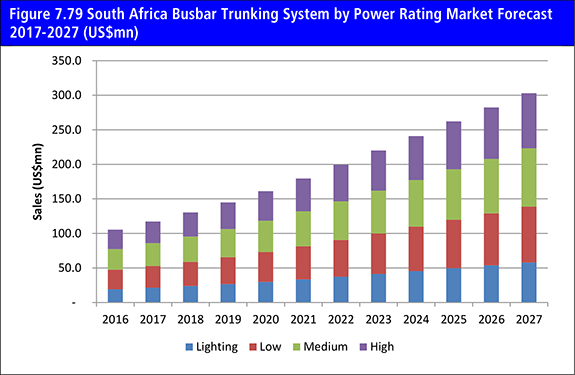
Figure 7.79 South Africa Busbar Trunking System by Power Rating Market Forecast 2017-2027 (US$mn)
Figure 7.80 South Africa Busbar Trunking System by Conductor Market Forecast 2017-2027 (US$mn)
Figure 7.81 Egypt Busbar Trunking System by Insulation Market Forecast 2017-2027 (US$mn)
Figure 7.82 Egypt Busbar Trunking System by Power Rating Market Forecast 2017-2027 (US$mn)
Figure 7.83 Egypt Busbar Trunking System by Conductor Market Forecast 2017-2027 (US$mn)
Figure 7.84 Rest of Africa Busbar Trunking System by Insulation Market Forecast 2017-2027 (US$mn)
Figure 7.85 Rest of Africa Busbar Trunking System by Power Rating Market Forecast 2017-2027 (US$mn)
Figure 7.86 Rest of Africa Busbar Trunking System by Conductor Market Forecast 2017-2027 (US$mn)
Figure 7.87 Latin America Busbar Trunking System Market by Country AGR Forecast 2017-2027 (AGR %)
Figure 7.88 Latin America Busbar Trunking System Market by Country Forecast 2017-2027 (US$mn, Middle East and Africa Total Market Sales AGR %)
Figure 7.89 Latin America Busbar Trunking System Market Share by Country Forecast 2017, 2022, 2027 (% Share)
Figure 7.90 Argentina Busbar Trunking System by Insulation Market Forecast 2017-2027 (US$mn)
Figure 7.91 Argentina Busbar Trunking System by Power Rating Market Forecast 2017-2027 (US$mn)
Figure 7.92 Argentina Busbar Trunking System by Conductor Market Forecast 2017-2027 (US$mn)
Figure 7.93 Brazil Busbar Trunking System by Insulation Market Forecast 2017-2027 (US$mn)
Figure 7.94 Brazil Busbar Trunking System by Power Rating Market Forecast 2017-2027 (US$mn)
Figure 7.95 Brazil Busbar Trunking System by Conductor Market Forecast 2017-2027 (US$mn)
Figure 7.96 Rest of Latin America Busbar Trunking System by Insulation Market Forecast 2017-2027 (US$mn)
Figure 7.97 Rest of Latin America Busbar Trunking System by Power Rating Market Forecast 2017-2027 (US$mn)
Figure 7.98 Rest of Latin America Busbar Trunking System by Conductor Market Forecast 2017-2027 (US$mn)
Figure 10.1 ABB Ltd Total Company Sales 2011-2016 (US$m, AGR %)
Figure 10.2 ABB Ltd Sales in the Busbar Trunking System Market 2015-2016 (US$m, AGR %)
Figure 10.3 Eaton Corporation Plc Total Company Sales 2011-2016 (US$m, AGR %)
Figure 10.4 Eaton Corporation Plc Sales in the Busbar Trunking System Market 2012-2016 (US$m, AGR %)
Figure 10.5 General Electric Company Total Company Sales 2012-2016 (US$m, AGR %)
Figure 10.6 General Electric Company Sales in the Busbar Trunking System Market 2011-2016 (US$m, AGR %)
Figure 10.7 Schneider Electric SE Total Company Sales 2011-2016 (US$m, AGR %)
Figure 10.8 Schneider Electric SE Sales in the Busbar Trunking System Market 2012-2016 (US$m, AGR %)
Figure 10.9 Siemens AG Total Company Sales 2011-2016 (US$m, AGR %)
Figure 10.10 Siemens AG Sales in the Busbar Trunking System Market 2014-2016 (US$m, AGR %)
Figure 10.11 Larsen & Toubro Limited Company Sales 2011-2016 (US$m, AGR %)
Figure 10.12 Larsen & Toubro Limited Sales in the Busbar Trunking System Market 2011-2016 (US$m, AGR %)
Figure 10.13 Godrej & Boyce Manufacturing Co. Ltd. Company Sales 2014-2016 (US$m, AGR %)
Figure 10.14 Godrej & Boyce Manufacturing Co. Ltd. Sales in the Busbar Trunking System Market 2014-2016 (US$m, AGR %)
Figure 10.15 Legrand Company Sales 2011-2016 (US$m, AGR %)
Figure 10.16 WEG Company Sales 2011-2016 (US$m, AGR %)
Figure 10.17 WEG Sales in the Busbar Trunking System Market 2011-2016 (US$m, AGR %)


