Industries > Packaging > Soft Drink Packaging Market Report 2019-2029
Soft Drink Packaging Market Report 2019-2029
Forecasts by Material (Paper, Plastic, Metal, Metal, and Glass) and by Application (Carbonated Soft Drinks, Sports Drinks, Energy Drinks and Others) PLUS Profiles of Leading Companies and Regional and Leading National Market Analysis
• Do you need definitive Soft Drink Packaging market data?
• Succinct Soft Drink Packaging market analysis?
• Technological insight?
• Clear competitor analysis?
• Actionable business recommendations?
Read on to discover how this definitive report can transform your research and save you time.
The global soft drink packaging market is calculated to be worth $25,386m in 2019.
The global soft drink packaging market is anticipated to experience moderate growth over the forecast period. Growth in the market is primarily attributed to increasing consumption of soft drinks, which includes carbonated soft drinks, sports drinks and energy drinks. Packaging protects the quality of beverages and also provides a platform to communicate with consumers by providing information on packs such as details of ingredients or calories. The level of protection decides packaging format. This includes glass, cans, cartons and plastic bottles. The growth is also attributed to the growth in the urban population and a change in consumer lifestyle trends. This, in turn, is anticipated to drive the soft drink packaging market during the forecast period.
Report Highlights
• 183 quantitative tables, charts, and graphs
• Analysis of Key Players in Soft Drink Packaging Technologies
– Amcor Ltd
– Ardagh group SA Company
– Ball Corporation
– Crown Holdings Incorporated
– DS Smith Plc
– Refresco Gerber
– Reynolds Group Holdings
– Stora Enso Oyj
– Tetra Laval
– WestRock Company
• Global Soft Drink Packaging Market Outlook and Analysis From 2019-2029
• Soft Drink Packaging Market Forecasts And Analysis From 2019-2029 by Application
• Carbonated Soft Drink Packaging Forecast 2019-2029
• Sports Drink Soft Drink Packaging Forecast 2019-2029
• Energy Drink Soft Drink Packaging Forecast 2019-2029
• Other types of Soft Drink Packaging Forecast 2019-2029
• Soft Drink Packaging Market Forecasts and Analysis From 2019-2029 by Material
• Paper Soft Drink Packaging Forecast 2019-2029
• Plastic Soft Drink Packaging Forecast 2019-2029
• Metal Soft Drink Packaging Forecast 2019-2029
• Glass Soft Drink Packaging Forecast 2019-2029
• Regional and Leading National Soft Drink Packaging Market Forecasts and Analysis From 2019-2029
• North America Soft Drink Packaging Forecast 2019-2029
• US Soft Drink Packaging Forecast 2019-2029
• Canada Soft Drink Packaging Forecast 2019-2029
• Europe Soft Drink Packaging Forecast 2019-2029
• Germany Soft Drink Packaging Forecast 2019-2029
• UK Soft Drink Packaging Forecast 2019-2029
• France Soft Drink Packaging Forecast 2019 – 2029
• Italy Soft Drink Packaging Forecast 2019-2029
• Russia Soft Drink Packaging Forecast 2019-2029
• Rest of Europe Soft Drink Packaging Forecast 2019-2029
• Asia-Pacific Soft Drink Packaging Forecast 2019-2029
• China Soft Drink Packaging Forecast 2019-2029
• Japan Soft Drink Packaging Forecast 2019-2029
• India Soft Drink Packaging Forecast 2019-2029
• Rest of Asia-Pacific Soft Drink Packaging Forecast 2019-2029
• Latin America Soft Drink Packaging Forecast 2019-2029
• Brazil Soft Drink Packaging Forecast 2019-2029
• Rest of Latin America Soft Drink Packaging Forecast 2019-2029
• MEA Soft Drink Packaging Forecast 2019-2029
• Israel Soft Drink Packaging Forecast 2019-2029
• Saudi Arabia Soft Drink Packaging Forecast 2019-2029
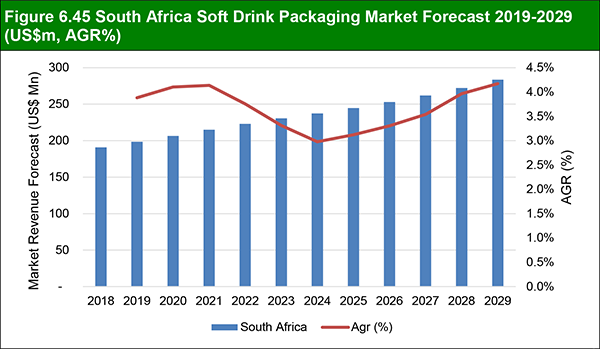
• South Africa Soft Drink Packaging Forecast 2019-2029
• UAE Soft Drink Packaging Forecast 2019-2029
• Rest of MEA Soft Drink Packaging Forecast 2019-2029
Soft Drink Packaging Market is forecasted for high growth. With a Visiongain report, you can learn just how the development of this market could affect you. With 183 charts and graphs, this 153-page report will be of interest to you.
Visiongain is a trading partner with the US Federal Government
CCR Ref number: KD4R6
Do you have any custom requirements we can help you with? Any need for specific country, geo region, market segment or specific company information? Contact us today, we can discuss your needs and see how we can help: sara.peerun@visiongain.com
1.1 Global Soft Drink Packaging Market Overview
1.2 Global Soft Drink Packaging Market Segmentation
1.3 Why You Should Read This Report
1.4 How This Report Delivers
1.5 Key Questions Answered by This Analytical Report Include:
1.6 Who is This Report For?
1.7 Methodology
1.7.1 Secondary Research
1.7.2 Market Evaluation & Forecasting Methodology
1.8 Frequently Asked Questions (FAQ)
1.9 Associated Visiongain Reports
1.10 About Visiongain
2. Introduction to the Soft Drink Packaging Market
2.1 Global Soft Drink Packaging Market Structure
2.2 Soft Drink Packaging Market Definition
2.3 Soft Drink Packaging Market Supply Chain
3. Global Soft Drink Packaging Market 2019-2029
3.1 Global Soft Drink Packaging Market Forecast 2019-2029
3.2 Global Soft Drink Packaging Market Analysis
3.3 Global Soft Drink Packaging Market Drivers & Restraints 2019
3.3.1 Expanding Supply Chain of Soft Drink Manufacturers
3.3.2 Brand Positioning
3.3.3 Increasing Shelf Life
3.3.4 Making Plastic Packaging More Sustainable For Beverage Applications
3.3.5 Smaller Package Size (An Average Of 300-500 Ml/G) Is A Winning Criterion For The Players In The Soft Drink Packaging Industry
3.3.6 Soft Drinks Are Loosing Their Market Share To Other Non-Alcoholic Drinks In The Market
4. Global Soft Drink Packaging Market Forecast by Material 2019-2029
4.1 Global Soft Drink Packaging Market Forecast by Paper Segment 2019-2029
4.2 Global Soft Drink Packaging Market Forecast by Plastic Segment 2019-2029
4.3 Global Soft Drink Packaging Market Forecast by Metal Segment 2019-2029
4.4 Global Soft Drink Packaging Market Forecast by Glass Segment 2019-2029
5. Global Soft Drink Packaging Market Forecast by Application 2019-2029
5.1 Global Soft Drink Packaging Market Forecast by Carbonated Soft Drink Segment 2019-2029
5.2 Global Soft Drink Packaging Market Forecast by Sports Drinks Segment 2019-2029
5.3 Global Soft Drink Packaging Market Forecast by Energy Drinks Segment 2019-2029
5.4 Global Soft Drink Packaging Market Forecast by Others Segment 2019-2029
6. Regional and Leading National Soft Drink Packaging Market Forecasts 2019-2029
6.1 North American Soft Drink Packaging Market Forecast by Material 2019-2029
6.1.1 North America Soft Drink Packaging Market by Application 2019-2029
6.1.2 North America Soft Drink Packaging Market by Country 2019-2029
6.1.3 North American Soft Drink Packaging Market Analysis
6.2 Asia Pacific Soft Drink Packaging Market Forecast 2019-2029
6.2.1 Asia-Pacific Soft Drink Packaging Market by Application 2019-2029
6.2.2 Asia-Pacific Soft Drink Packaging Market by Country 2019-2029
6.2.3 Asia Pacific Soft Drink Packaging Market Analysis
6.3 Europe Soft Drink Packaging Market Forecast 2019-2029
6.3.1 Europe Soft Drink Packaging Market by Application 2019-2029
6.3.2 European Soft Drink Packaging Market by Country 2019-2029
6.3.3 European Soft Drink Packaging Market Analysis
6.4 Latin American Soft Drink Packaging Market Forecast 2019-2029
6.4.1 Latin America Soft Drink Packaging Market by Application 2019-2029
6.4.2 Latin America Soft Drink Packaging Market by Country 2019-2029
6.5 MEA Soft Drink Packaging Market Forecast by Material 2019-2029
6.5.1 MEA Soft Drink Packaging Market by Application 2019-2029
6.5.2 MEA Soft Drink Packaging Market by Country 2019-2029
6.6 Regional Soft Drink Packaging Market Share Forecast 2019, 2024 and 2029
7. SWOT Analysis of the Soft Drink Packaging Market 2019-2029
8. Leading Companies in the Soft Drink Packaging Market 2019
8.1 Leading Soft Drink Packaging Companies 2019
8.2 Amcor Ltd.
8.2.1 Amcor Ltd. Soft Drink Packaging Selected Recent Key Developments 2014-2018
8.2.2 Amcor Ltd. Sales 2015-2018
8.2.3 Amcor Ltd. Net Income 2015-2018
8.2.4 Amcor Ltd. Business Divisions
8.2.5 Amcor Ltd. Soft Drink Packaging Market Products / Services
8.2.6 Amcor Ltd. Overview
8.2.7 Amcor Ltd. Financial Outlook
8.2.8 Amcor Ltd. SWOT Analysis
8.3 Ardagh Group SA Company
8.3.1 Ardagh Group SA Company Key Development
8.3.2 Ardagh Group SA Company Sales 2014-2018
8.3.3 Ardagh Group SA Company Net Income / Loss 2014-2018
8.3.4 Ardagh Group SA Organisational Structure
8.3.5 Ardagh Group SA Company Soft Drink Packaging Products / Services
8.3.6 Ardagh Group SA Company Overview
8.3.7 Ardagh Group SA Financial Outlook
8.3.8 Ardagh Group SA SWOT Analysis
8.4 Ball Corporation
8.4.1 Ball Corporation Soft Drink Packaging Key Developments 2014-2017
8.4.2 Ball Corporation Sales 2014-2018
8.4.3 Ball Corporation Net Income 2014-2018
8.4.4 Ball Corporation Organisational Structure
8.4.5 Ball Corporation Soft Drink Packaging Market Products / Services
8.4.6 Ball Corporation Overview
8.4.7 Ball Corporation Financial Outlook
8.4.8 Ball Corporation SWOT Analysis
8.5 Crown Holdings, Inc.
8.5.1 Crown Holdings, Inc. Soft Drink Packaging Key Developments 2017-2018
8.5.2 Crown Holdings, Inc. Sales 2014-2018
8.5.3 Crown Holdings, Inc. Net Income 2014-2018
8.5.4 Crown Holdings, Inc. Company Structure
8.5.5 Crown Holdings, Inc. Soft Drink Packaging Market Products / Services
8.5.6 Crown Holdings, Inc. Overview
8.5.7 Crown Holdings, Inc. Financial Outlook
8.5.8 Crown Holdings, Inc. SWOT Analysis
8.6 DS Smith Plc
8.6.1 DS Smith Plc Key Developments 2015-2018
8.6.2 DS Smith Plc Sales 2015-2018
8.6.3 DS Smith Plc Net Income 2015-2018
8.6.4 DS Smith Plc Business Sectors
8.6.5 DS Smith Plc Soft Drink Packaging Market Products / Services
8.6.6 DS Smith Plc Overview
8.6.7 DS Smith Plc Financial Outlook
8.6.8 DS Smith Plc SWOT Analysis
8.7 Refresco Gerber
8.7.1 Refresco Gerber Key Developments 2015-2018
8.7.2 Refresco Gerber Soft Drink Packaging Market Products / Services
8.7.3 Refresco Gerber Financial Outlook
8.8 Reynolds Group Holdings
8.8.1 Reynolds Group Holdings Key Developments 2016-2017
8.8.2 Reynolds Group Holdings Sales 2015-2018
8.8.3 Reynolds Group Holdings Company Structure
8.8.4 Reynolds Group Holdings Soft Drink Packaging Market Products / Services
8.8.5 Reynolds Group Holdings Overview.
8.8.6 Reynolds Group Holdings Financial Outlook
8.9 Stora Enso Oyj
8.9.1 Stora Enso Oyj Key Developments
8.9.2 Stora Enso Oyj Sales 2014-2018
8.9.3 Stora Enso Oyj Net Income / Loss 2014-2018
8.9.4 Stora Enso Oyj Overview
8.9.5 Stora Enso Oyj Financial Outlook
8.10. Tetra Laval
8.10.1 Tetra Laval Key Developments 2016-2018
8.10.2 Tetra Laval Sales 2013-2017
8.10.3 Tetra Laval Industry Group Revenue Share 2017
8.10.4 Tetra Laval Packaging Products Segment Information
8.10.5 Tetra Laval Soft Drink Packaging Market Products / Services
8.10.6 Tetra Laval Overview
8.10.6.1 Tetra Pak Top Ten Markets in Packaging Materials
8.10.6.2 Tetra Pak Top Ten Markets in Processing Solutions
8.10.7 Tetra Laval Financial Outlook
8.10.8 Tetra Laval SWOT Analysis
8.11 WestRock Company
8.11.1 WestRock Company Key Developments 2015-2017
8.11.2 WestRock Company Sales 2014-2018
8.11.3 WestRock Company Net Income 2013-2017
8.11.4 WestRock Company Organisational Structure
8.11.5 WestRock Company Soft Drink Packaging Market Products / Services
8.11.6 WestRock Company Overview
8.11.6.1 WestRock Company Corporate and Operating Facilities
8.11.6.2 WestRock Company Consumer Packaging Mills
8.11.7 WestRock Company SWOT Analysis
8.12 Other Leading Companies in the Value Chain
9. Conclusions
9.1 Key Research finding
9.2 Conclusion by Geography
9.3 Conclusion by Application
9.4 Conclusion by Material
9.5 Strategic Recommendations
10. Glossary
Associated Visiongain Reports
Visiongain Report Sales Order Material
Appendix A
About Visiongain
Appendix B
Visiongain Report Evaluation Form
List of Figures
Figure 1.1 Global Soft Drink Packaging Market Segmentation
Figure 2.1 Global Soft Drink Packaging Market Segmentation Overview
Figure 2.2 Global Soft Drink Packaging Market Supply Chain
Figure 3.1 Global Soft Drink Packaging Market Forecast 2019-2029 (US$m, AGR %)
Figure 4.1 Global Soft Drink Packaging Market Share Forecast by Material 2019, 2024, 2029 (% Share)
Figure 4.2 Global Soft Drink Packaging Market Forecast for the Paper Segment by Region 2019, 2024, 2029 (% Share)
Figure 4.3 Global Soft Drink Packaging Market Forecast for the Plastic Segment by Region 2019, 2024, 2029 (% Share)
Figure 4.4 Global Soft Drink Packaging Market Forecast for the Metal Segment by Region 2019, 2024, 2029 (% Share)
Figure 4.5 Global Soft Drink Packaging Market Forecast for the Glass Segment by Region 2019, 2024, 2029 (% Share)
Figure 5.1 Global Soft Drink Packaging Market Share by Application 2019, 2024, 2029 (% Share)
Figure 5.2 Global Soft Drink Packaging Market Share Forecast For Carbonated Soft Drink Segment by Region 2019, 2024, 2029 (% Share)
Figure 5.3 Global Soft Drink Packaging Market Share Forecast For Sports Drinks Segment by Region 2019, 2024, 2029 (% Share)
Figure 5.4 Global Soft Drink Packaging Market Share Forecast For Energy Drinks Segment By Region 2019, 2024, 2029 (% Share)
Figure 5.5 Global Soft Drink Packaging Market Share Forecast For Others Segment by Region 2019-2024-2029 (%)
Figure 6.1 Regional Soft Drink Packaging Market Forecast 2019-2029 (US$m, AGR%)
Figure 6.2 North American Soft Drink Packaging Market Share Forecast by Material 2019, 2024, 2029 (% Share)
Figure 6.3 North American Soft Drink Packaging Market Forecast 2019-2029 (US$m, AGR%)
Figure 6.4 North America Soft Drink Packaging Market Share Forecast by Application 2019, 2024, 2029 (% Share)
Figure 6.5 North America Soft Drink Packaging Market Forecast by Application 2019-2029 (US$m, AGR%)
Figure 6.6 North America Soft Drink Packaging Market Share Forecast by Country 2019, 2024, 2029 (% Share)
Figure 6.7 North America Soft Drink Packaging Market Forecast by Country 2019-2029 (US$m, AGR%)
Figure 6.8 US Soft Drink Packaging Market Forecast 2019-2029 (US$m, AGR%)
Figure 6.9 Canada Soft Drink Packaging Market Forecast 2019-2029 (US$m, AGR%)
Figure 6.10 Asia-Pacific Soft Drink Packaging Market Share Forecast by Material 2019, 2024, 2029 (% Share)
Figure 6.11 Asia-Pacific Soft Drink Packaging Market Forecast by Material 2019-2029 (US$m, AGR%)
Figure 6.12 Asia-Pacific Soft Drink Packaging Market Share Forecast by Application 2019, 2024, 2029 (% Share)
Figure 6.13 Asia-Pacific Soft Drink Packaging Market Forecast by Application 2019-2029 (US$m, AGR%)
Figure 6.14 Asia-Pacific Soft Drink Packaging Market Share Forecast by Country 2019, 2024, 2029 (% Share)
Figure 6.15 Asia-Pacific Soft Drink Packaging Market Forecast by Country 2019-2029 (US$m, AGR%)
Figure 6.16 China Soft Drink Packaging Market Forecast 2019-2029 (US$m, AGR%)
Figure 6.17 India Soft Drink Packaging Market Forecast 2019-2029 (US$m, AGR%)
Figure 6.18 Japan Soft Drink Packaging Market Forecast 2019-2029 (US$m, AGR%)
Figure 6.19 Europe Soft Drink Packaging Market Share Forecast by Material 2019, 2024, 2029 (% Share)
Figure 6.20 European Soft Drink Packaging Market Forecast By Material 2019-2029 (US$m, AGR%)
Figure 6.21 European Soft Drink Packaging Market Share Forecast by Application 2019, 2024, 2029 (% Share)
Figure 6.22 European Soft Drink Packaging Market Forecast by Application 2019-2029 (US$m, AGR%)
Figure 6.23 European Soft Drink Packaging Market Share Forecast by Country 2019, 2024, 2029 (% Share)
Figure 6.24 European Soft Drink Packaging Market Forecast by Country 2019-2029 (US$m, AGR%)
Figure 6.25 Germany Soft Drink Packaging Market Forecast 2019-2029 (US$m, AGR%)
Figure 6.26 UK Soft Drink Packaging Market Forecast 2019-2029 (US$m, AGR%)
Figure 6.27 France Soft Drink Packaging Market Forecast 2019-2029 (US$m, AGR%)
Figure 6.28 Italy Soft Drink Packaging Market Forecast 2019-2029 (US$m, AGR%)
Figure 6.29 Russia Soft Drink Packaging Market Forecast 2019-2029 (US$m, AGR%)
Figure 6.30 Latin American Soft Drink Packaging Market Share Forecast 2019, 2024, 2029 (% Share)
Figure 6.31 Latin American Soft Drink Packaging Market Forecast by Material 2019-2029 (US$m, AGR%)
Figure 6.32 Latin America Soft Drink Packaging Market Share Forecast by Application 2019, 2024, 2029 (% Share)
Figure 6.33 Latin America Soft Drink Packaging Market Forecast by Application 2019-2029 (US$m, AGR%)
Figure 6.34 Latin America Soft Drink Packaging Market Share Forecast by Country 2019, 2024, 2029 (% Share)
Figure 6.35 Latin America Soft Drink Packaging Market Forecast by Country 2019-2029 (US$m, AGR%)
Figure 6.36 Brazil Soft Drink Packaging Market Forecast 2019-2029 (US$m, AGR%)
Figure 6.37 MEA Soft Drink Packaging Market Share Forecast by Material 2019, 2024, 2029 (% Share)
Figure 6.38 MEA Soft Drink Packaging Market Forecast by Material 2019-2029 (US$m, AGR%)
Figure 6.39 MEA Soft Drink Packaging Market Share Forecast by Application 2019, 2024, 2029 (% Share)
Figure 6.40 MEA Soft Drink Packaging Market Forecast by Application 2019-2029 (US$m, AGR%)
Figure 6.41 MEA Soft Drink Packaging Market Share Forecast by Country 2019, 2024, 2029 (% Share)
Figure 6.42 MEA Soft Drink Packaging Market Forecast by Country 2019-2029 (US$m, AGR%)
Figure 6.43 Israel Soft Drink Packaging Market Forecast 2019-2029 (US$m, AGR%)
Figure 6.44 Saudi Arabia Soft Drink Packaging Market Forecast 2019-2029 (US$m, AGR%)
Figure 6.45 South Africa Soft Drink Packaging Market Forecast 2019-2029 (US$m, AGR%)
Figure 6.46 UAE Soft Drink Packaging Market Forecast 2019-2029 (US$m, AGR%)
Figure 6.47 Rest of MEA Soft Drink Packaging Market Forecast 2019-2029 (US$m, AGR%)
Figure 6.48 Regional Soft Drink Packaging Market Share Forecast 2019 (% Share)
Figure 6.49 Regional Soft Drink Packaging Market Share Forecast 2024 (% Share)
Figure 6.50 Regional Soft Drink Packaging Market Share Forecast 2029 (% Share)
Figure 8.1 Amcor Ltd. Sales 2015-2018 (US$m, AGR %)
Figure 8.2 Amcor Ltd. Net Income 2015-2018 (US$m, AGR %)
Figure 8.3 Amcor Ltd. Business Divisions 2017
Figure 8.4 Ardagh Group SA Company Sales 2014-2018 (US$m, AGR %)
Figure 8.5 Ardagh Group SA Net Income / Loss 2014-2018 (US$m)
Figure 8.6 Ardagh Group SA Organisational Structure 2017
Figure 8.7 Ardagh Group SA Segment Performance 2018 (%)
Figure 8.8 Ball Corporation Sales 2014-2018 (US$m, AGR %)
Figure 8.9 Ball Corporation Net Income 2014-2018 (US$m, AGR %)
Figure 8.10 Ball Corporation Organisational Structure 2018
Figure 8.11 Crown Holdings, Inc. Sales 2014-2018 (US$m, AGR %)
Figure 8.12 Crown Holdings, Inc. Net Income 2014-2018 (US$m)
Figure 8.13 Crown Holdings, Inc. Company Structure 2019
Figure 8.14 DS Smith Plc Sales 2015-2018 (US$m, AGR %)
Figure 8.15 DS Smith Plc Net Income 2015-2018 (US$m)
Figure 8.16 DS Smith Plc Business Sectors 2018
Figure 8.17 Reynolds Group Holdings Sales 2015-2018 (US$m, AGR %)
Figure 8.18 Reynolds Group Holdings Company Structure 2018
Figure 8.19 Stora Enso Oyj Sales 2013-2017 (US$m, AGR %)
Figure 8.20 Stora Enso Oyj Net Income / Loss 2014-2018 (US$m)
Figure 8.21 Stora Enso Oyj Segment Performance 2018 (%)
Figure 8.22 Tetra Laval Sales 2013-2017 (US$m, AGR %)
Figure 8.23 Tetra Laval Industry Group Revenue Share 2017 (%)
Figure 8.24 Tetra Laval Packaging Products Segment Information 2018
Figure 8.25 Sidel Group Revenue Share by Region 2017 (%)
Figure 8.26 WestRock Company Sales 2014-2018 (US$m, AGR %)
Figure 8.27 WestRock Company Net Income 2013-2017 (US$m)
Figure 8.28 WestRock Company Organisational Structure 2018
List of Tables
Table 3.1 Global Soft Drink Packaging Market Forecast 2019-2029 (US$Mn, AGR%, CAGR %, Cumulative)
Table 4.1 Global Soft Drink Packaging Market Forecast by Material 2019-2029 (US$Mn, AGR%, CAGR %, Cumulative)
Table 4.2 Global Soft Drink Packaging Market Forecast for the Paper Segment by Region 2019-2029 (US$Mn, AGR%, CAGR %, Cumulative)
Table 4.3 Global Soft Drink Packaging Market Forecast for the Plastic Segment by Region 2019-2029 (US$Mn, AGR%, CAGR %, Cumulative)
Table 4.4 Global Soft Drink Packaging Market Forecast for the Metal Segment by Region 2019-2029 (US$Mn, AGR%, CAGR %, Cumulative)
Table 4.5 Global Soft Drink Packaging Market Forecast for the Glass Segment by Region 2019-2029 (US$Mn, AGR%, CAGR %, Cumulative)
Table 5.1 Global Soft Drink Packaging Market Forecast by Application 2019-2029 (US$Mn, AGR%, CAGR %, Cumulative)
Table 5.2 Global Soft Drink Packaging Market Forecast For Carbonated Soft Drink Segment by Region 2019-2029 (US$Mn, AGR%, CAGR %, Cumulative)
Table 5.3 Global Soft Drink Packaging Forecast for the Sports Drinks Segment by Region 2019-2029 (US$Mn, AGR%, CAGR %, Cumulative)
Table 5.4 Global Soft Drink Packaging Market Forecast For Energy Drinks Segment by Region 2019-2029 (US$Mn, AGR%, CAGR %, Cumulative)
Table 5.5 Global Soft Drink Packaging Market Forecast For Others Segment by Region 2019-2029 (US$Mn, AGR%, CAGR %, Cumulative)
Table 6.1 Regional Soft Drink Packaging Market Forecast 2019-2029 (US$Mn, AGR%, CAGR %, Cumulative)
Table 6.2 North American Soft Drink Packaging Market Forecast by Material 2019-2029 (US$Mn, AGR%, CAGR %, Cumulative)
Table 6.3 North America Soft Drink Packaging Market Forecast By Application 2019-2029 (US$Mn, AGR%, CAGR %, Cumulative)
Table 6.4 North America Soft Drink Packaging Market Forecast By Country 2019-2029 (US$Mn, AGR%, CAGR %, Cumulative)
Table 6.5 Asia-Pacific Soft Drink Packaging Market Forecast By Material 2019-2029 (US$Mn, AGR%, CAGR %, Cumulative)
Table 6.6 Asia-Pacific Soft Drink Packaging Market Forecast By Application 2019-2029 (US$Mn, AGR%, CAGR %, Cumulative)
Table 6.7 Asia-Pacific Soft Drink Packaging Market Forecast By Country 2019-2029 (US$Mn, AGR%, CAGR %, Cumulative)
Table 6.8 Europe Soft Drink Packaging Market Forecast By Material 2019-2029 (US$Mn, AGR%, CAGR %, Cumulative)
Table 6.9 European Soft Drink Packaging Market Forecast By Application 2019-2029 (US$Mn, AGR%, CAGR %, Cumulative)
Table 6.10 European Soft Drink Packaging Market Forecast By Country 2019-2029 (US$Mn, AGR%, CAGR %, Cumulative)
Table 6.11 Latin American Soft Drink Packaging Market Forecast by Material 2019-2029 (US$Mn, AGR%, CAGR %, Cumulative)
Table 6.12 Latin America Soft Drink Packaging Market Forecast By Application 2019-2029 (US$Mn, AGR%, CAGR %, Cumulative)
Table 6.13 Latin America Soft Drink Packaging Market Forecast By Country 2019-2029 (US$Mn, AGR%, CAGR %, Cumulative)
Table 6.14 MEA Soft Drink Packaging Market Forecast by Material 2019-2029 (US$Mn, AGR%, CAGR %, Cumulative)
Table 6.15 MEA Soft Drink Packaging Market Forecast By Application 2019-2029 (US$Mn, AGR%, CAGR %, Cumulative)
Table 6.16 MEA Soft Drink Packaging Market Forecast By Country 2019-2029 (US$Mn, AGR%, CAGR %, Cumulative)
Table 7.1 Global Soft Drink Packaging Market SWOT Analysis 2019-2029
Table 8.1 Leading Soft Drink Packaging Companies 2019 (S.No., Company Name)
Table 8.2 Amcor Ltd. Profile 2019 (CEO, Parent Company Sales US$m, Net Income, Business Segment in the Market, HQ, Founded, No. of Employees, Website)
Table 8.3 Amcor Ltd. Key Developments 2014-2018 (Date, Strategy, Details)
Table 8.4 Amcor Ltd. Sales 2015-2018 (US$m, AGR %)
Table 8.5 Amcor Ltd. Net Income 2015-2018 (US$m, AGR %)
Table 8.6 Amcor Ltd. Soft Drink Packaging Market Products/Services (Segment of Business, Product, Specification / Features)
Table 8.7 Amcor Ltd. SWOT Analysis 2018
Table 8.8 Ardagh Group SA Company Profile 2019 (CEO, Parent Company Sales US$m, Net Income, Business Segment in the Market, HQ, Founded, No. of employees, Website)
Table 8.9 Ardagh Group SA Company Key Development (Date, Strategy, Details)
Table 8.10 Ardagh Group SA Company Sales 2014-2018 (US$m, AGR %)
Table 8.11 Ardagh Group SA Company Net Income / Loss 2014-2018 (US$MN)
Table 8.12 Ardagh Group SA Company Soft Drink Packaging Products/Services (Segment of Business, Product, Specification/ Features)
Table 8.13 Ardagh Group SA SWOT Analysis 2018
Table 8.14 Ball Corporation Profile 2019 (CEO, Parent Company Sales US$m, Net Income, Business Segment in the Market, HQ, Founded, Website)
Table 8.15 Ball Corporation Key Developments (Date, Strategy, Details)
Table 8.16 Ball Corporation Sales 2014-2018 (US$m, AGR %)
Table 8.17 Ball Corporation Net Income 2014-2018 (US$m, AGR %)
Table 8.18 Ball Corporation Soft Drink Packaging Market Products / Services (Segment of Business, Product, Specification / Features)
Table 8.19 Ball Corporation SWOT Analysis 2018
Table 8.20 Crown Holdings, Inc. Profile 2019 (CEO, Parent Company Sales US$m, Net Income, HQ, Founded, No. of Employees, Website)
Table 8.21 Crown Holdings, Inc. Key Developments 2017-2018 (Date, Strategy, Details)
Table 8.22 Crown Holdings, Inc. Sales 2014-2018 (US$m, AGR %)
Table 8.23 Crown Holdings, Inc. Net Income 2014-2018 (US$m)
Table 8.24 Crown Holdings, Inc. Soft Drink Packaging Market Products/Services (Segment of Business, Product, Specification / Features)
Table 8.25 Crown Holdings, Inc. SWOT Analysis 2018
Table 8.26 DS Smith Plc Profile 2019 (CEO, Parent Company Sales US$m, Business Segment in the Market, HQ, Founded, No. of Employees, Website)
Table 8.27 Selected Recent DS Smith Plc Soft Drink Packaging Market Developments 2015-2018 (Date, Strategy, Details)
Table 8.28 DS Smith Plc Sales 2015-2018 (US$m, AGR %)
Table 8.29 DS Smith Plc Net Income 2015-2018 (US$m, AGR %)
Table 8.30 DS Smith Plc Soft Drink Packaging Market Products / Services (Segment of Business, Product, Specification / Features)
Table 8.31 DS Smith Plc SWOT Analysis 2018
Table 8.32 Refresco Gerber Profile 2019 (CEO, Parent Company Sales US$m, Business Segment in the Market, HQ, Founded, No. of Employees, Website)
Table 8.33 Selected Recent Refresco Gerber Soft Drink Packaging Market Developments 2015-2018 (Date, Strategy, Details)
Table 8.34 Refresco Gerber Soft Drink Packaging Market Products / Services (Segment of Business, Product, Specification / Features)
Table 8.35 Reynolds Group Holdings Profile 2019 (CEO, Parent Company Sales US$m, Business Segment in the Market, HQ, Founded, No. of Employees, Website)
Table 8.36 Selected Recent Reynolds Group Holdings Soft Drink Packaging Market Developments 2016-2017 (Date, Strategy, Details)
Table 8.37 Reynolds Group Holdings Sales 2015-2018 (US$m, AGR %)
Table 8.38 Reynolds Group Holdings Soft Drink Packaging Market Products / Services (Segment of Business, Product)
Table 8.39 Stora Enso Oyj Profile 2019 (CEO, Parent Company Sales US$m, Net Income, Business Segment in the Market, HQ, Founded, No. of employees, Website)
Table 8.40 Stora Enso Oyj Key Developments (Date, Strategy, Details)
Table 8.41 Stora Enso Oyj Sales 2014-2018 (US$m, AGR %)
Table 8.42 Stora Enso Oyj Net Income / Loss 2014-2018 (US$ MN)
Table 8.43 Tetra Laval Profile 2019 (CEO, Parent Company Sales US$m, Industry Group in the Market, HQ, No. of Employees, Website)
Table 8.44 Selected Recent Tetra Laval Soft Drink Packaging Market Developments 2016-2018 (Date, Strategy, Details)
Table 8.45 Tetra Laval Sales 2013-2017 (US$m, AGR %)
Table 8.46 Tetra Laval Industry Group Revenue 2017 (US$Mn)
Table 8.47 Tetra Laval Soft Drink Packaging Market Products / Services (Segment of Business, Product, Specification / Features)
Table 8.48 Tetra Pak Top Ten Markets in Packaging Materials (Rank, Countries)
Table 8.49 Tetra Pak Top Ten Markets in Processing Solutions (Rank, Countries)
Table 8.50 Tetra Laval SWOT Analysis 2018
Table 8.51 WestRock Company Profile 2019 (CEO, Parent Company Sales US$m, Business Segment in the Market, HQ, Founded, No. of Employees, Website)
Table 8.52 Selected Recent WestRock Company Soft Drink Packaging Market Developments 2015-2017 (Date, Strategy, Details)
Table 8.53 WestRock Company Sales 2014-2018 (US$m, AGR %)
Table 8.54 WestRock Company Net Income 2014-2018 (US$m)
Table 8.55 WestRock Company Soft Drink Packaging Market Products / Services (Segment of Business, Product, Specification / Features)
Table 8.56 WestRock Company Total Number of Corporate and Operating Facilities (Segment, Number of Facilities)
Table 8.57 WestRock Company Consumer Packaging Mills (Location, Bleached Paperboard, Coated Natural Kraft, Coated Recycled Paperboard, Specialty Recycled Paperboard, Market Pulp, Total Capacity)
Table 8.58 WestRock Company SWOT Analysis 2018
Table 8.59 Other Leading Companies in the Soft Drink Packaging Market Value Chain 2018
Table 9.1 Global Soft Drink Packaging Market Summary 2019, 2024, 2029 ($m, CAGR%)
Table 9.2 Global Soft Drink Packaging Market Summary by Geography (2019, 2029)
Table 9.3 Global Soft Drink Packaging Market Summary by Application (2019, 2029)
Table 9.4 Global Soft Drink Packaging Market Summary by Material (2019, 2029)
Alusa
Amcor Ltd.
Ampac Holdings Llc
AMVIG Holdings Ltd.
AptarGroup Inc.
Ardagh Group SA
Ball Corporation
Bemis Company Inc.,
BERICAP GmbH & Co KG
Berlin Packaging L.L.C.
Bilcare Ltd.
Brødrene Hartmann A/S
Bway Holding Company
CAN-PACK S.A.,
Capsule International Llc
Carton Craft Corporation
Cenveo Packaging
CKS Packaging, Inc.
Claranor
CMEAn Food España Sociedad Anonima.
Colorpak
Consol Glass (Pty) Ltd
Crown Holdings, Inc.
DIS
Dongwon Systems Corp.
DS Smith Plc
Dynapac Co., Ltd.
Encirc Limited
Essel Propack Ltd.
Exal Corporation
Flint Group Germany GmbH
Fortress Global Enterprises, Inc.
Fuji Seal International, Inc.
Gamer Packaging Inc.
G-Box, S.A. de C.V.
GEKA GmbH
Gerber
Gerbo Cermex
Graphic Packaging Holding Company
Groupe Ecco Boites Pliantes Ltée
Grupo Gondi
Grupo Rotoplas SA de CV
Guala Closures Spa
Hanna Group Pty Ltd (Hannapak)
Hindusthan National Glass & Industries Ltd.
Illinois Tool Works Inc.
Innovia Films Limited
Intertape Polymer Group, Inc.
J.L. Clark Llc
Janoschka
Junior Achievement (JA) of Georgia
Kaufman Container Company
Kezzler
Kuantum Papers Ltd.
Latapack-Ball Embalagens
Letica Corporation
Lithocraft, Inc.
Macfarlane Group Plc
Manaksia Ltd.
Master Kong
MeadWestvaco
Microsoft
Multi Packaging Solutions International Limited
Multi-Color Corp.
National Carton and Coating Co.
New Toyo International Holdings Ltd.
Nongfu Spring
Norgraft Packaging, S.A.
ORG Technology
Owens-Illinois
Pacific Can China Holdings Limited,
PepsiCo
Piramal Glass Ltd.
Premier Tech Chronos
Pro-Pac Packaging Ltd.
PSB Industries SA
PT Berlina Tbk
Refresco Ltd.
Rexam PLC
Reynolds Group Holdings
Reynolds Presto Products Inc.
Rhodius Mineralquellen
Richards Packaging Income Fund
RKW SE
RockTenn Company
Schoeller Allibert Group B.V.
Scholle IPN
Seydaco Packaging Corp.
SIG
Signode Industrial Group Holdings (Bermuda) Ltd.
Sks Bottle And Packaging Inc.
Sonoco Products
SP Fiber Holdings, Inc
Stora Enso Oyj
Superior Multi-Packaging Limited
T+ink
Tat Seng Packaging Group Ltd.
Tetra Laval
The Bryce Corporation
The Cola-Cola Company
The Works Stores Ltd
Tricorbraun Inc.
UFP Technologies, Inc.
Vetropack Holding AG
Vidrala SA
W/S Packaging Group Inc.
WestRock Company
List of Other Organisations in this Report
ABRE – Brazilian Packaging Association
Adhesive & Sealant Council
Alliance of Foam Packaging Recyclers
American Bakers Association
American Chemistry Council
American Forest & Paper Association
American Frozen Food Institute
American Hardware Manufacturers Association
American Institute of Food Distributors
American Iron and Steel Institute
American Management Association
American Meat Institute
American National Standards Institute
American Plastics Council (APC)
American Society for Testing and Materials
Association for Suppliers of Printing, Publishing
AICC, The Independent Packaging Association
Association of Industrial Metallizers, Coaters and Laminators (AIMCAL)
Association of Visual Packaging Manufacturers
Automated Identification Manufacturer
Automated Imaging Association
California Film Extruders & Converters Association
Can Manufacturers Institute
Chocolate Manufacturers Association of the U.S.A.
Closure Manufacturers Association
Composite Can & Tube Institute (CCTI)
Consumer Healthcare Products Association
Contract Manufacturing and Packaging Association
Converting Equipment Manufacturers Association
Corrugated Packaging Council
Cosmetic, Toiletry & Fragrance Association
Drug, Chemical & Allied Trade Association
Envelope Manufacturers Association
Environmental Industry Associations
Fibre Box Association
Film and Bag Federation
Flexible Packaging Association
Flexographic Technical Association
Foil Stamping and Embossing Association
Food and Drug Law Institute
Food Institute
Food Marketing Institute
Food Processing Machinery & Supplies Association
Foodservice & Packaging Institute
Glass Packaging Institute
Graphic Arts Technical Foundation
Gravure Association of America
Grocery Manufacturers of America
Health Industry Manufacturers Association
Healthcare Compliance Packaging Council
High Definition Flexo Consortium
Institute of Food Technologists
Institute of Packaging Professionals
International Association of Food Industry Suppliers
International Bottled Water Association
International Dairy Foods Association
International Foodservice Manufacturers Association
International Safe Transit Association
Italian and Machinery Technology
Label Printing Industries of America
Material Handling Industry of America
Molded Pulp Environmental Packaging Association
National Association of Container Distributors
National Association of Manufacturers
National Association of Printers and Lithographers
National Beverage Packaging Association
National Chicken Council
National Coil Coating Association
National Confectioners Association of the U.S.A.
National Food Processors Association
National Freight Claim & Security
National Frozen Food Association
National Institute of Packaging, Handling & Logistics Engineers
National Paper Trade Association
National Paperbox Association
National Soft Drink Association
National Wooden Pallet & Container
Open Modular Architecture Controls (OMAC) Packaging Workgroup
Packaging and Label Gravure Association
Packaging Association of Canada
Paperboard Packaging Council
Paper Shipping Sack Manufacturers
Petroleum Packaging Council
Pharmaceutical Manufacturers Association
Pharmaceutical Research and Manufacturers of America
PMMI: The Association for Packaging and Processing Technologies
Polystyrene Packaging Council
Pressure Sensitive Tape Council
Printing Industries of America
Private Label Manufacturers Association
Processing and Packaging Machinery Association (PPMA)
Produce Marketing Association, Inc.
Research & Development Associates for Military Food & Packaging Systems
Rigid Plastic Packaging Institute
Robotic Industries Association (RIA)
Snack Food Association
Soap & Detergent Association
Society of Glass and Ceramic Decorators
Society of Manufacturing Engineers
Society of Plastics Engineers (SPE)
Society of the Plastics Industry (SPI)
Steel Recycling Institute
Steel Shipping Containers Institute
Tag and Label Manufacturers Institute
Technical Association of the Pulp & Paper Industry
The Aluminium Association
Transportation Consumer Protection Council
Transportation Loss Prevention & Security Association
Tube Council of North America
Uniform Code Council, Inc.
Western Packaging Association (WPA)
Women in Packaging
World Packaging Organisation
Download sample pages
Complete the form below to download your free sample pages for Soft Drink Packaging Market Report 2019-2029
Related reports
-
Aseptic Packaging Market Report 2019-2029
With global, national/regional, and submarket estimates for aseptic packaging market, this report covers key aspects of this market. Also, the...Full DetailsPublished: 05 April 2019 -
Caps & Closures Market Report 2019-2029
With an incredible amount of attention devoted to the Caps & Closures market, deriving market prospects and opportunities can be...Full DetailsPublished: 25 April 2019 -
Top 30 Glass Packaging Companies 2020
The Top 30 Glass Packaging Companies will account for 54.8% of the global market in 2018 according to brand new...
Full DetailsPublished: 11 February 2020 -
Can Packaging Market Report 2019-2029
Can packaging market is forecast for moderate growth. With a Visiongain report, you can learn just how the development of...Full DetailsPublished: 26 March 2019 -
Beverage Packaging Market Report 2020-2030
The global beverage packaging market is expected to grow at a lucrative rate during the forecast period....Full DetailsPublished: 27 July 2020 -
Glass Packaging Market Report 2019-2029
The latest report from business intelligence provider Visiongain offers a comprehensive analysis of the global Glass Packaging market. Visiongain assesses...
Full DetailsPublished: 03 June 2019 -
Retort Packaging Market Report 2019-2029
With an incredible amount of attention devoted to the retort packaging market, deriving market prospects and opportunities can be difficult....Full DetailsPublished: 01 May 2019
Download sample pages
Complete the form below to download your free sample pages for Soft Drink Packaging Market Report 2019-2029
Do you have any custom requirements we can help you with?
Any specific country, geo region, market segment or specific company information?
Email us today, we can discuss your needs and see how we can help: jamie.roberts@visiongain.com
Would you like a free report overview of the report of your choice?
If so, please drop an email to Jamie Roberts stating your chosen report title to jamie.robertsvisiongain.com
Visiongain packaging related reports are compiled using a broad and rich mixture of both primary and secondary information to produce an overall industry outlook. In order to provide our clients with the best product possible product, visiongain analysts reach out to market-leading vendors and industry experts but also review a wealth of financial data and product information from a vast range of sources. To find out more about our reports methodology, please email jamie.roberts@visiongain.com
Would you like to get the latest Visiongain packaging reports catalogue?
What are the dynamic growth sectors? where are the regional business opportunities?
Which technologies will prevail and who are the leading companies succeeding in these sectors and why?
If you want definitive answers to business critical questions, discover Visiongain’s full range of business intelligence reports.
If so, please email Jamie Roberts on jamie.roberts@visiongain.com or call her today on +44 207 336 6100
Adhesive & Sealant Council
Alliance of Foam Packaging Recyclers
American Bakers Association
American Chemistry Council
American Forest & Paper Association
American Frozen Food Institute
American Institute of Food Distributors
American Iron and Steel Institute
American Management Association
American National Standards Institute
American Plastics Council (APC)
American Society for Testing and Materials
Association for Suppliers of Printing, Publishing
AICC, The Independent Packaging Association
Association of Industrial Metallizers, Coaters and Laminators (AIMCAL)
Automated Identification Manufacturer
Automated Imaging Association
Can Manufacturers Institute
Chocolate Manufacturers Association of the U.S.A.
Consumer Healthcare Products Association
Contract Manufacturing and Packaging Association
Converting Equipment Manufacturers Association
Corrugated Packaging Council
Drug, Chemical & Allied Trade Association
Envelope Manufacturers Association
Fibre Box Association
Flexible Packaging Association
Flexographic Technical AssociationFlexographic Technical Association
Foil Stamping and Embossing Association
Food and Drug Law Institute
Food Institute
Food Marketing Institute
Food Processing Machinery & Supplies Association
Foodservice & Packaging Institute
Glass Packaging Institute
Graphic Arts Technical Foundation
Gravure Association of America
Grocery Manufacturers of America
Healthcare Compliance Packaging Council
High Definition Flexo Consortium
Institute of Food Technologists
Institute of Packaging Professionals
International Association of Food Industry Suppliers
International Bottled Water Association
International Dairy Foods Association
International Foodservice Manufacturers Association
International Safe Transit Association
Label Printing Industries of America
Material Handling Industry of America
National Association of Container Distributors
National Association of Manufacturers
National Chicken Council
National Coil Coating Association
National Confectioners Association of the U.S.A.
National Freight Claim & Security
National Institute of Packaging, Handling & Logistics Engineers
National Paper Trade Association
National Wooden Pallet & Container
Open Modular Architecture Controls (OMAC) Packaging Workgroup
Packaging Association of Canada
Paperboard Packaging Council
Petroleum Packaging Council
Pharmaceutical Research and Manufacturers of America
PMMI: The Association for Packaging and Processing Technologies
Polystyrene Packaging Council
Pressure Sensitive Tape Council
Printing Industries of America
Processing and Packaging Machinery Association (PPMA)
Produce Marketing Association, Inc.
Research & Development Associates for Military Food & Packaging Systems
Robotic Industries Association (RIA)
Snack Food Association
Soap & Detergent Association
Society of Glass and Ceramic Decorators
Society of Manufacturing Engineers
Society of Plastics Engineers (SPE)
Society of the Plastics Industry (SPI)
Steel Recycling Institute
Steel Shipping Containers Institute
Tag and Label Manufacturers Institute
Technical Association of the Pulp & Paper Industry
The Aluminum Association
Transportation Consumer Protection Council
Transportation Loss Prevention & Security Association
Tube Council of North America
Uniform Code Council, Inc.
Western Packaging Association (WPA)
World Packaging Organisation
Latest Packaging news
Visiongain Publishes Caps & Closures Market Report 2024-2034
The global caps & closures market was valued at US$80.8 billion in 2023 and is projected to grow at a CAGR of 9% during the forecast period 2024-2034.
22 February 2024
Visiongain Publishes Flexible (Converted) Plastic Packaging Market Report 2024-2034
The global Flexible (Converted) Plastic Packaging market was valued at US$157.3 billion in 2023 and is projected to grow at a CAGR of 5.4% during the forecast period 2024-2034.
04 January 2024
Visiongain Publishes Beverage Packaging Market Report 2023-2033
The global Beverage Packaging market was valued at US$144.3 billion in 2022 and is projected to grow at a CAGR of 4.6% during the forecast period 2023-2033.
28 September 2023
Visiongain Publishes Cosmetics Packaging Market Report 2023-2033
The global Cosmetics Packaging market is projected to grow at a CAGR of 4.3% by 2033
21 July 2023
