The latest research report from business intelligence provider visiongain offers a comprehensive analysis of the global Small Scale LNG market. Visiongain assesses that this market will generate $4.35bn in 2017.
The Small Scale Liquefied Natural Gas (LNG) Market Forecast 2017-2027 responds to your need for definitive market data:
Read on to discover how you can exploit the future business opportunities emerging in this sector. Visiongain’s new study tells you and tells you NOW.
In this brand new report, you find 93 in-Depth tables, charts and graphs all unavailable elsewhere.
The 187-page report provides clear, detailed insight into the global Small Scale LNG market. Discover the key drivers and challenges affecting the market.
By ordering and reading our brand new report today, you stay better informed and ready to act.
Report Scope
1) The report provides CAPEX forecasts and analyses for the small scale LNG market and the five main submarkets from 2017-2027:
• Small Scale Regasification Forecast 2017-2027
• Small Scale Liquefaction Forecast 2017-2027
• LNG Bunkering Stations Forecast 2017-2027
• LNG Fuelling Stations Forecast 2017-2027
• LNG Satellite Stations Forecast 2017-2027
2) The report includes CAPEX forecasts and an analysis of the drivers and restraints of 6 key regional/national markets from 2017 to 2027, including submarket breakdowns for each:
• Chinese Small Scale LNG Market Forecast 2017-2027
• Small Scale Regasification Forecast 2017-2027
• Small Scale Liquefaction Forecast 2017-2027
• LNG Bunkering Stations Forecast 2017-2027
• LNG Fuelling Stations Forecast 2017-2027
• LNG Satellite Stations Forecast 2017-2027
• United States Small Scale LNG Market Forecast 2017-2027
• Small Scale Regasification Forecast 2017-2027
• Small Scale Liquefaction Forecast 2017-2027
• LNG Bunkering Stations Forecast 2017-2027
• LNG Fuelling Stations Forecast 2017-2027
• LNG Satellite Stations Forecast 2017-2027
• European Small Scale LNG Market Forecast 2017-2027
• Small Scale Regasification Forecast 2017-2027
• Small Scale Liquefaction Forecast 2017-2027
• LNG Bunkering Stations Forecast 2017-2027
• LNG Fuelling Stations Forecast 2017-2027
• LNG Satellite Stations Forecast 2017-2027
• Indonesian Small Scale LNG Market Forecast 2017-2027
• Small Scale Regasification Forecast 2017-2027
• Small Scale Liquefaction Forecast 2017-2027
• LNG Bunkering Stations Forecast 2017-2027
• LNG Fuelling Stations Forecast 2017-2027
• LNG Satellite Stations Forecast 2017-2027
• Japanese PHS Market Forecast 2017-2027
• Small Scale Regasification Forecast 2017-2027
• Small Scale Liquefaction Forecast 2017-2027
• LNG Bunkering Stations Forecast 2017-2027
• LNG Fuelling Stations Forecast 2017-2027
• LNG Satellite Stations Forecast 2017-2027
• Rest of the World PHS Market Forecast 2017-2027
• Small Scale Regasification Forecast 2017-2027
• Small Scale Liquefaction Forecast 2017-2027
• LNG Bunkering Stations Forecast 2017-2027
• LNG Fuelling Stations Forecast 2017-2027
• LNG Satellite Stations Forecast 2017-2027
3) The report provides insight into the level of development and existing small scale LNG infrastructure in every regional space
4) The analysis in the report is underpinned by our exclusive interview with leading expert.
5) The report concludes with the profiles of a selection of companies and technology providers operating in the market and lists key companies involved within the respective small scale LNG submarkets.
Who should read this report?
• Who should read this report?
• Anyone within the LNG industry
• CEOs
• COOs
• Business development managers
• Project and site managers
• Suppliers
• Investors
• Contractors
• Government agencies
• Environmental Engineers/Technicians
Visiongain’s study is intended for anyone requiring commercial analyses for the Small Scale LNG market and leading companies. You find data, trends and predictions.
Buy our report today Small Scale Liquefied Natural Gas (LNG) Market Forecast 2017-2027: Liquefaction, Regasification, Satellite Station, Bunkering & Fuelling Station and Small Scale LNG Plus Profiles of Top Companies. Avoid missing out by staying informed – get our report now.
Visiongain is a trading partner with the US Federal Government
CCR Ref number: KD4R6
1. Report Overview
1.1 Small Scale Liquefied Natural Gas (LNG) Market Overview
1.2 Market Structure Overview and Market Definition
1.3 Why You Should Read This Report
1.4 How This Report Delivers
1.5 Key Questions Answered by This Analytical Report Include:
1.6 Who is This Report For?
1.7 Methodology
1.7.1 Primary Research
1.7.2 Secondary Research
1.7.3 Market Evaluation & Forecasting Methodology
1.8 Frequently Asked Questions (FAQ)
1.9 Associated visiongain Reports
1.10 About visiongain
2. Introduction to the Small Scale Liquefied Natural Gas (LNG) Market
2.1 Global Small Scale LNG Market Structure
2.2 Market Definition
2.3 Small Scale LNG Industry Outlook
2.4 Small Scale LNG- Value Chain Analysis
3. Global Overview of Small Scale Liquefied Natural Gas (LNG) Market
3.1 Global Small Scale Liquefied Natural Gas (LNG), Market Attractiveness Analysis
3.2 Global Small Scale Liquefied Natural Gas (LNG) Market Drivers and Restraints
4. Small Scale Liquefied Natural Gas (LNG) Submarkets Forecasts 2017-2027
4.1 Global Small Scale Liquefied Natural Gas (LNG) Submarkets Forecasts, by Type 2017-2027
4.1.1 Global Small Scale Regasification Forecasts 2017-2027
4.1.1.1 Global Small Scale Regasification Drivers and Restraints
4.1.2 Global Small Scale Liquefaction Forecasts 2017-2027
4.1.2.1 Global Small Scale Liquefaction Drivers and Restraints
4.1.3 Global LNG Satellite Stations Forecasts 2017-2027
4.1.3.1 Global LNG Satellite Stations Drivers and Restraints
4.1.4 Global LNG Bunkering Facilities for Vessels Forecasts 2017-2027
4.1.4.1 Global LNG Bunkering Facilities for Vessels Drivers and Restraints
4.1.5 Global Fueling Forecasts 2017-2027
4.1.5.1 Global Fueling Drivers and Restraints
5. Leading Regional Market Forecasts 2017-2027
5.1 China Small Scale Liquefied Natural Gas (LNG) Market
5.1.1 China Small Scale Liquefied Natural Gas (LNG) Submarket Forecast
5.1.2 China Small Scale Liquefied Natural Gas (LNG) Market Analysis
5.2 Indonesia Small Scale Liquefied Natural Gas (LNG) Market
5.2.1 Indonesia Small Scale Liquefied Natural Gas (LNG) Submarket Forecast
5.2.2 Indonesia Small Scale Liquefied Natural Gas (LNG) Market Analysis
5.3 Japan Small Scale Liquefied Natural Gas (LNG) Market
5.3.1 Japan Small Scale Liquefied Natural Gas (LNG) Submarket Forecast
5.3.2 Japan Small Scale Liquefied Natural Gas (LNG) Market Analysis
5.4 U.S. Small Scale Liquefied Natural Gas (LNG) Market
5.4.1 U.S. Small Scale Liquefied Natural Gas (LNG) Submarket Forecast
5.4.2 U.S. Small Scale Liquefied Natural Gas (LNG) Market Analysis
5.5 Europe Small Scale Liquefied Natural Gas (LNG) Market
5.5.1 Europe Small Scale Liquefied Natural Gas (LNG) Submarket Forecast
5.5.2 Europe Small Scale Liquefied Natural Gas (LNG) Market Analysis
5.6 Rest of the World Small Scale Liquefied Natural Gas (LNG) Market
5.6.1 Rest of the World Small Scale Liquefied Natural Gas (LNG) Submarket Forecast
5.6.2 Rest of the World Small Scale Liquefied Natural Gas (LNG) Market Analysis
6. PESTEL Analysis of the Small Scale LNG Market
7. Expert Opinion
7.1 Primary Correspondents
7.2 Small Scale LNG Market Outlook
7.3 Driver & Restraints
7.4 Dominant Region in the Small Scale LNG Market
7.5 By Type Market Scenario
7.6 Overall Growth Rate, Globally
8. Leading Companies in Small Scale Liquefied Natural Gas (LNG) Market
8.1 Gasnor Shell
8.2 Skangas
8.3 Gazprom
8.4 Wartsila
8.5 Prometheus Energy Company
8.6 PETRONAS
8.7 EcoElectrica Inc.
8.8 Air Products and Chemicals, Inc.
8.9 ENN Energy Holdings Limited
8.10 Kunlun Energy Company Limited
8.11 Global Small Scale LNG Market, Company Market Share (%), 2015
8.12 Other Leading Companies
9. Conclusion & Recommendations
10. Glossary
Associated visiongain Reports
visiongain Report Sales Order Form
Appendix A
About visiongain
Appendix B
visiongain report evaluation form
List of Tables
Table 1.1The Small Scale LNG Market by Regional Market Forecast 2017-2027 ($mn, AGR %, CAGR)
Table 3.1 Global Small Scale Liquefied Natural Gas (LNG) Market, by Region Forecast 2017-2027 ($mn, AGR %, CAGR %, Cumulative)
Table 3.2 Global Small Scale Liquefied Natural Gas (LNG) Market Drivers and Restraints
Table 4.1 Global Small Scale Liquefied Natural Gas (LNG) Market Forecast 2017-2027($mn, AGR %, Cumulative)
Table 4.2 Global Small Scale Regasification Forecast 2017-2027($mn, AGR %, CAGR %, Cumulative)
Table 4.3 Small Scale Regasification Projects Examples (Name, Country, Start Date, Company, Status)
Table 4.4 Small Scale Regasification Projects Examples (Plant Name, Location, Country, Receiving Capacity, Start Date, Company, Status)
Table 4.5 Global Small Scale Regasification Drivers and Restraints
Table 4.6 Global Small Scale Liquefaction Forecast 2017-2027($mn, AGR %, CAGR %, Cumulative)
Table 4.7Small Scale Liquefaction Projects Examples (Name, Country, Start Date, Company, Status)
Table 4.8 Small Scale Liquefaction Projects Examples (Name, Country, Liquefaction Capacity, Start Date, Company, Status)
Table 4.9 Global Small Scale Liquefaction Drivers and Restraints
Table 4.10 Global LNG Satellite Stations Forecast 2017-2027($mn, AGR %, CAGR %, Cumulative)
Table 4.11 Global LNG Satellite Stations Drivers and Restraints
Table 4.12 Global LNG Bunkering Facilities for Vessels Forecast 2017-2027($mn, AGR %, CAGR %, Cumulative)
Table 4.13 Operational LNG Bunkering Facilities for Vessels (Name, Location, Country, Company, Date, Notes)
Table 4.14 Operational LNG Bunkering Facilities for Vessels (Name, Location, Country, Company, Date, Notes)
Table 4.15 Global LNG Bunkering Facilities for Vessels Drivers and Restraints
Table 4.16 Global Fuelling Forecast 2017-2027($mn, AGR %, CAGR %, Cumulative)
Table 4.17 LNG Refueling Stations (Station Name, Year Built, Country, Location, Operator)
Table 4.18 Global Fuelling Drivers and Restraints
Table 5.1 Leading National Small Scale Liquefied Natural Gas (LNG) Market Forecast by Submarket 2017-2027 ($mn, AGR )
Table 5.2 China Small Scale Liquefied Natural Gas (LNG) Market by Forecast 2017-2027($mn, AGR %, CAGR %, Cumulative)
Table 5.3 China Small Scale Liquefied Natural Gas (LNG) Market, by Type Forecast 2017-2027($mn, AGR %, CAGR %, Cumulative)
Table 5.4 Indonesia Small Scale Liquefied Natural Gas (LNG) Market by Forecast 2017-2027($mn, AGR %, CAGR %, Cumulative)
Table 5.5 Indonesia Small Scale Liquefied Natural Gas (LNG) Market, by Type Forecast 2017-2027($mn, AGR %, CAGR %, Cumulative)
Table 5.6 Japan Small Scale Liquefied Natural Gas (LNG) Market by Forecast 2017-2027($mn, AGR %, CAGR %, Cumulative)
Table 5.7 Japan Small Scale Liquefied Natural Gas (LNG) Market, by Type Forecast 2017-2027($mn, AGR %, CAGR %, Cumulative)
Table 5.8 U.S. Small Scale Liquefied Natural Gas (LNG) Market by Forecast 2017-2027($mn, AGR %, CAGR %, Cumulative)
Table 5.9 U.S. Small Scale Liquefied Natural Gas (LNG) Market, by Type Forecast 2017-2027($mn, AGR %, CAGR %, Cumulative)
Table 5.10 Europe Small Scale Liquefied Natural Gas (LNG) Market by Forecast 2017-2027($mn, AGR %, CAGR %, Cumulative)
Table 5.11 Europe Small Scale Liquefied Natural Gas (LNG) Market, by Type Forecast 2017-2027($mn, AGR %, CAGR %, Cumulative)
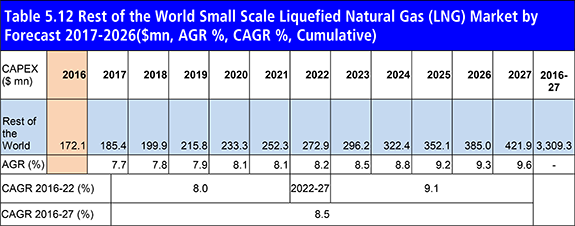
Table 5.12 Rest of the World Small Scale Liquefied Natural Gas (LNG) Market by Forecast 2017-2027($mn, AGR %, CAGR %, Cumulative)
Table 5.13 Rest of the World Small Scale Liquefied Natural Gas (LNG) Market, by Type Forecast 2017-2027($mn, AGR %, CAGR %, Cumulative)
Table 5.14 Global Projects Scenario
Table 6.1 PESTEL Analysis, Small Scale LNG Market
Table 8.1 Gasnor Shell Profile 2016(Market Entry, Public/Private, Headquarters, Total Company Sales $mn, Change in Revenue, Geography, Key Market, Company Sales from Small Scale Liquefied Natural Gas Market, Listed on, Products/Services Strongest Business Region, Business Segment in the Market, Submarket Involvement, No. of Employees)
Table 8.2 Skangass2015(Market Entry, Public/Private, Headquarters, Total Company Sales $mn, Change in Revenue, Geography, Key Market, Company Sales from Small Scale Liquefied Natural Gas Market, Listed on, Products/Services Strongest Business Region, Business Segment in the Market, Submarket Involvement, No. of Employees)
Table 8.3 Skangass AS LNG Operations
Table 8.4 Gazprom2015(Market Entry, Public/Private, Headquarters, Total Company Sales $bn, Change in Revenue, Geography, Key Market, Company Sales from Small Scale Liquefied Natural Gas Market, Listed on, Products/Services Strongest Business Region, Business Segment in the Market, Submarket Involvement, No. of Employees)
Table 8.5 Gazprom, Total Company Sales 2011-2015 ($bn, AGR %)
Table 8.6 Wartsila Profile 2016(Market Entry, Public/Private, Headquarters, Total Company Sales US$mn, Change in Revenue, Geography, Key Market, Company Sales from Small Scale Liquefied Natural Gas Market, Listed on, Products/Services Strongest Business Region, Business Segment in the Market, Submarket Involvement, No. of Employees)
Table 8.7 Wartsila Total Company Sales 2012-2016 ($bn, AGR %)
Table 8.8 Prometheus Energy Company Profile 2016(Market Entry, Public/Private, Headquarters, Total Company Sales $mn, Change in Revenue, Geography, Key Market, Company Sales from Small Scale Liquefied Natural Gas Market, Listed on, Products/Services Strongest Business Region, Business Segment in the Market, Submarket Involvement, No. of Employees)
Table 8.9 PETRONAS Profile 2015(Market Entry, Public/Private, Headquarters, Total Company Sales $mn, Change in Revenue, Geography, Key Market, Company Sales from Small Scale Liquefied Natural Gas Market, Listed on, Products/Services Strongest Business Region, Business Segment in the Market, Submarket Involvement, No. of Employees)
Table 8.10 PETRONAS Total Company Revenue 2011-2015 ($bn, AGR %)
Table 8.11 EcoElectrica Inc. 2015(Market Entry, Public/Private, Headquarters, Total Company Sales $bn, Change in Revenue, Geography, Key Market, Company Sales from Small Scale LNG Market, Listed on, Products/Services Strongest Business Region, Business Segment in the Market, Submarket Involvement, No. of Employees)
Table 8.12 Air Products and Chemicals, Inc. Profile 2016(Market Entry, Public/Private, Headquarters, Total Company Sales $mn, Change in Revenue, Geography, Key Market, Company Sales from Small Scale Liquefied Natural Gas Market, Listed on, Products/Services Strongest Business Region, Business Segment in the Market, Submarket Involvement, No. of Employees)
Table 8.13 Air Products and Chemicals, Inc Total Company Revenue 2012-2016 ($bn, AGR %)
Table 8.14 ENN Energy Holdings Limited Profile 2015(Market Entry, Public/Private, Headquarters, Total Company Sales $mn, Change in Revenue, Geography, Key Market, Company Sales from Small Scale Liquefied Natural Gas Market, Listed on, Products/Services Strongest Business Region, Business Segment in the Market, Submarket Involvement, No. of Employees)
Table 8.15 ENN Energy Holdings Limited Total Company Revenue 2012-2016 ($bn, AGR %)
Table 8.16 Kunlun Energy Company Limited 2015(Market Entry, Public/Private, Headquarters, Total Company Sales $bn, Change in Revenue, Geography, Key Market, Company Sales from Small Scale Liquefied Natural Gas Market, Listed on, Products/Services Strongest Business Region, Business Segment in the Market, Submarket Involvement, No. of Employees)
Table 8.17 Kunlun Energy Company Limited, Total Company Sales 2012-2016 ($bn, AGR %)
List of Figures
Figure 1.1 The Small Scale LNG Market by Country/Region Market Share Forecast 2017, 2022, 2027 (% Share)
Figure 2.1 Global Small Scale LNG market Segmentation Overview
Figure 2.1 Small Scale LNG, Value Chain Analysis
Figure 3.1 Global Small Scale Liquefied Natural Gas (LNG) Forecast 2017-2027 ($mn, AGR %)
Figure 3.2 Small Scale Liquefied Natural Gas (LNG) Market by Regional Market Share Forecast 2017, 2022, 2027 (% Share)
Figure 3.3 Global Small Scale Liquefied Natural Gas (LNG) Market, Market Attractiveness, By Region
Figure 4.1 Global Small Scale Liquefied Natural Gas (LNG) Submarket Forecast 2017-2027 ($mn, AGR%)
Figure 4.2 Global Small Scale Liquefied Natural Gas (LNG) Market by Type Share Forecast 2017, 2022, 2027 (% Share)
Figure 4.3 Small Scale Liquefied Natural Gas (LNG) Market, By Small Scale Regasification Forecast 2017-2027 ($mn, AGR%)
Figure 4.4 Small Scale Liquefied Natural Gas (LNG) Market, By Small Scale Liquefaction Forecast 2017-2027 ($mn, AGR%)
Figure 4.5 Small Scale Liquefied Natural Gas (LNG) Market, By LNG Satellite Stations Forecast 2017-2027 ($mn, AGR%)
Figure 4.6 Small Scale Liquefied Natural Gas (LNG) Market, By LNG Bunkering Facilities for Vessels Forecast 2017-2027 ($mn, AGR%)
Figure 4.7 Small Scale Liquefied Natural Gas (LNG) Market, By Fuelling Forecast 2017-2027 ($mn, AGR%)
Figure 5.1 Leading Regional Players in Small Scale Liquefied Natural Gas (LNG) Market, % Share, 2017
Figure 5.2 Leading Regional Players in Small Scale Liquefied Natural Gas (LNG) Market, % Share, 2022
Figure 5.3 Leading Regional Players in Small Scale Liquefied Natural Gas (LNG) Market, Share, 2027
Figure 5.4 China Small Scale Liquefied Natural Gas (LNG) Market Forecast 2017-2027 ($mn, AGR %)
Figure 5.5 Indonesia Small Scale Liquefied Natural Gas (LNG) Market Forecast 2017-2027 ($mn, AGR %)
Figure 5.6 Japan Small Scale Liquefied Natural Gas (LNG) Market Forecast 2017-2027 ($mn, AGR %)
Figure 5.7 U.S. Small Scale Liquefied Natural Gas (LNG) Market Forecast 2017-2027 ($mn, AGR %)
Figure 5.8 Europe Small Scale Liquefied Natural Gas (LNG) Market Forecast 2017-2027 ($mn, AGR %)
Figure 5.9 Rest of the World Small Scale Liquefied Natural Gas (LNG) Market Forecast 2017-2027 ($mn, AGR %)
Figure 8.1 Gazprom, Revenue, ($bn& AGR %), 2011-2015
Figure 8.2 Wartsila, Revenue,($bn& AGR %), 2012-2016
Figure 8.3 Wartsila Revenue %Share, by Business Segment, 2016
Figure 8.4 Wartsila Revenue %Share, by Regional Segment, 2016
Figure 8.5 PETRONAS Total Company Revenue, ($bn & AGR %), 2011-2015
Figure 8.6 Petronas Revenue % Share, by Product Segment, 2015
Figure 8.7 Petronas Revenue % Share, by Geographical Trade, 2015
Figure 8.8 Petronas Revenue % Share, by Business Segment, 2015
Figure 8.9 Petronas Revenue % Share, by Geographic Segment, 2015
Figure 8.10 Air Products and Chemicals, Inc Total Company Revenue,($bn, AGR %), 2012-2016
Figure 8.11 Air Products and Chemicals, Inc Revenue % Share, by Regional Segment, 2016
Figure 8.12 Air Products and Chemicals, Inc Revenue % Share, by Business Segment, 2016
Figure 8.13 ENN Energy Holdings Limited Total Company Revenue,($bn& AGR %), 2012-2016
Figure 8.14 Kunlun Energy Company Limited Revenue % Share, by Business Segment, 2016
Figure 8.15 Kunlun Energy Company Limited, Revenue, ($bn& AGR %), 2012-2016
Figure 8.16 Leading Companies Market Share, 2015 Small Scale LNG Market
Figure 9.1 Global small scale LNG Market Forecast 2017-2027 ($ mn, AGR %)


