• Do you need market data on the small satellite market?
• Succinct small satellite market analysis?
• Technological insight?
• Clear company analysis?
• Actionable business information?
Read on to discover how this definitive report can transform your own research and save you time.
Continued venture capital investment has led visiongain to publish this timely report.
Visiongain has assessed that the small satellite market will exceed $1.76 Billion in 2018 and is expected to flourish over the next few years due to continued market interest and also because of the sheer potential of small satellites. If you want to be part of this growing industry, then read on to discover how you can maximise your investment potential.
Report highlights
• 127 tables, charts, and graphs
• Analysis of key players developing small satellite technologies
• Aerospace Corporation
• GeoOptics LLC
• Oneweb LLC
• ORBCOMM Inc.
• Planet Labs Inc.
• Spire Global Inc.
• Surrey Satellite Technology Limited (SSTL)
• The Boeing Company
• Global Small Satellite market outlook and analysis from 2018-2028
• Small Satellite application forecasts and analysis from 2018-2028
• Meteorology
• Security/Surveillance
• Earthquake/Seismic Monitoring
• Scientific Research
• Other Applications
• Small Satellite Classification projections from 2018-2028
• Nanosatellite
• Microsatellite
• Minisatellite
• Picosatellite
• Femtosatellite
• National Small Satellite market forecasts from 2018-2028
• U.S.
• Canada
• U.K.
• Russia
• Denmark
• Japan
• China
• India
• Indonesia
• Singapore
• Rest of the World (RoW)
• Key questions answered
– What does the future hold for the Small Satellite industry?
– Where should you target your business strategy?
– Which Small Satellite applications should you focus upon?
– Which disruptive technologies should you invest in?
– Which Small Satellite company is likely to prevail and why?
– What industry trends should you be aware of?
• Target audience
– Anyone within the Small Satellite value chain
– Small Satellite companies
– Payload suppliers
– Aerospace companies
– Security companies
– Scientific institutions
– Meteorological organisations
– Component Suppliers
– Contractors
– Technologists
– R&D staff
– Consultants
– Analysts
– CEO’s
– CIO’s
– COO’s
– Business development managers
– Investors
– Governments
– Agencies
– Industry organisations
– Banks
Visiongain is a trading partner with the US Federal Government
CCR Ref number: KD4R6
1. Report Overview
1.1 Global Small Satellite Market Overview
1.2 Why You Should Read This Report
1.3 How This Report Delivers
1.4 Key Questions Answered by This Analytical Report Include:
1.5 Who is This Report For?
1.6 Methodology
1.6.1 Primary Research
1.6.2 Secondary Research
1.6.3 Market Evaluation & Forecasting Methodology
1.7 Frequently Asked Questions (FAQ)
1.8 Associated Visiongain Reports
2. Introduction to the Small Satellite Market
2.1 Introduction to the Small Satellite Market
2.2 Small Satellite Market Structure
2.3 Small Satellite Market Definition
2.4 Small Satellite Classification Market Definition
2.4.1 Small Satellite Application Market Definition
2.5 Significant Current and Future Developments in Small Satellite Technology
2.5.1 Development of Dedicated Launch Vehicles for Small Satellites
2.5.2 Use of 3D Printing Technology to Develop Small Satellites
3. Global Small Satellite Market 2018-2028
3.1 Global Small Satellite Market Forecast 2018-2028
3.2 Global Small Satellite Market Drivers & Restraints 2018
3.2.1 Sources of Growth & Contraction in the Global Small Satellite Market
4. Global Small Satellite Classification Submarket Forecast 2018-2028
4.1 Nanosatellite Launches Expected to Surge Due to Availability of Dedicated Launch Vehicles
5. Global Small Satellite Application Submarket Forecast 2018-2028
5.1 Commercial Applications of Small Satellites Expected to Witness a High Demand Owing to Cheaper Costs and Enhanced Performance Capabilities
6. Leading National Small Satellite Market Forecast 2018-2028
6.1 Global Small Satellite Market by Country Market Share Forecast 2018-2028
6.2 U.S. Small Satellite Market Forecast 2018-2028
6.2.1 U.S. Small Satellite Market Contracts & Programmes
6.2.2 Commercial Sector To Lead The Way In Terms Of Small Satellite Development And Launch In The U.S.
6.2.3 U.S. Small Satellite Market Drivers & Restraints
6.3 Canada Small Satellite Market Forecast 2018-2028
6.3.1 Canadian Small Satellite Market Contracts & Programmes
6.3.2 Partnerships Between CSA And Other Space Agencies Such As NASA Expected To Contribute To The Growth Of The Canadian Small Satellite Market
6.3.3 Canadian Small Satellite Market Drivers & Restraints
6.4 U.K. Small Satellite Market Forecast 2018-2028
6.4.1 U.K. Small Satellite Market Contracts & Programmes
6.4.2 Collaborations Between Academia And Commercial Sector To Bolster The Development Of Small Satellites In The U.K.
6.4.3 U.K. Small Satellite Market Drivers & Restraints
6.5 Russian Small Satellite Market Forecast 2018-2028
6.5.1 Russian Small Satellite Market Contracts & Programmes
6.5.2 Russia’s Expertise In Developing Launch Vehicles To Bolster Its Growth Prospects In The Small Satellite Market
6.5.3 Russian Small Satellite Market Drivers & Restraints
6.6 Denmark Small Satellite Market Forecast 2018-2028
6.6.1 Denmark Small Satellite Market Contracts & Programmes
6.6.2 Partnerships Between Academic Institutions And Private Players To Help Strengthen Denmark’s Ability To Develop Small Satellites
6.6.3 Denmark Small Satellite Market Drivers & Restraints
6.7 Japanese Small Satellite Market Forecast 2018-2028
6.7.1 Japanese Small Satellite Market Contracts & Programmes
6.7.2 Government Initiatives In Japan Set To Bolster The Growth Of The Small Satellite Market
6.7.3 Japanese Small Satellite Market Drivers & Restraints
6.8 Chinese Small Satellite Market Forecast 2018-2028
6.8.1 Chinese Small Satellite Market Contracts & Programmes
6.8.2 Government Owned Companies Lead The Way In The Chinese Small Satellite Market
6.8.3 Chinese Small Satellite Market Drivers & Restraints
6.9 Indian Small Satellite Market Forecast 2018-2028
6.9.1 Indian Small Satellite Market Contracts & Programmes
6.9.2 Indian Launch Capability To Provide A Fillip To The Indian Small Satellite Market
6.9.3 Indian Small Satellite Market Drivers & Restraints
6.10 Indonesian Small Satellite Market Forecast 2018-2028
6.10.1 Indonesian Small Satellite Market Contracts & Programmes
6.10.2 Increasing Demand For Remote Sensing Images Expected To Drive The Indonesian Small Satellite Market
6.10.3 Indonesian Small Satellite Market Drivers & Restraints
6.11 Singapore Small Satellite Market Forecast 2018-2028
6.11.1 Singapore Small Satellite Market Contracts & Programmes
6.11.2 Collaborations Between Private Firms And Academia Create A Healthy Ecosystem For The Singaporean Small Satellite Market
6.11.3 Singapore Small Satellite Market Drivers & Restraints
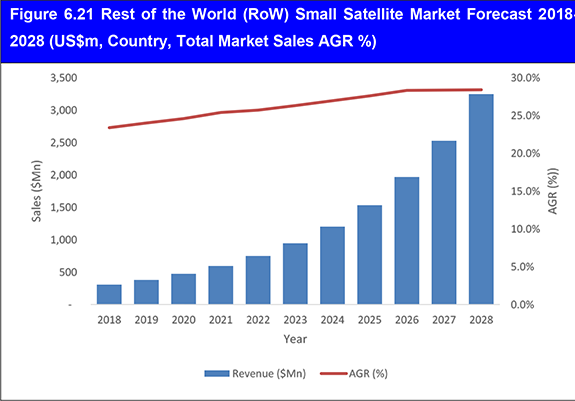
6.12 Rest of the World (RoW) Small Satellite Market Forecast 2018-2028
6.12.1 Rest of the World (RoW)Small Satellite Market Contracts & Programmes
6.12.2 Nano And Picosatellites Expected To Be The Key Areas Of Focus By Countries In The Row Small Satellite Market
6.12.3 Rest of the World (RoW) Small Satellite Market Drivers & Restraints
7. PEST Analysis of the Small Satellite Market 2018-2028
8. Leading 8 Small Satellite Companies
8.1 Leading 8 Small Satellite Companies 2018
8.2 The Boeing Company
8.2.1 The Boeing Company Small Satellite Selected Recent Contracts / Projects / Programmes 2014
8.2.2 The Boeing Company Total Company Sales 2013-2017
8.2.3 The Boeing Company Sales by Segment of Business 2013-2017
8.2.4 The Boeing Company Net Income 2013-2017
8.2.5 The Boeing Company Cost of Research & Development 2013-2017
8.2.6 The Boeing Company Organisational Structure
8.2.7 The Boeing Company Analysis
8.3 ORBCOMM Inc.
8.3.1 ORBCOMM Inc. Small Satellite Selected Recent Contracts / Projects / Programmes 2016
8.3.2 ORBCOMM Inc. Total Company Sales 2013-2017
8.3.3 ORBCOMM Inc. Net Income / Loss 2013-2017
8.3.4 ORBCOMM Inc. Cost of Research & Development 2013-2017
8.3.5 ORBCOMM Inc. Analysis
8.4 Aerospace Corporation
8.4.1 Aerospace Corporation Small Satellite Selected Recent Contracts / Projects / Programmes
8.4.2 Aerospace Corporation Analysis
8.5 Surrey Satellite Technology Limited (SSTL)
8.5.1 Surrey Satellite Technology Limited (SSTL) Small Satellite Selected Recent Contracts / Projects / Programmes 2014-2016
8.5.2 Surrey Satellite Technology Limited Analysis
8.6 Planet Labs Inc.
8.6.1 Planet Labs Inc. Small Satellite Selected Recent Contracts / Projects / Programmes 2016
8.6.2 Planet Labs Inc. Analysis
8.7 Spire Global Inc.
8.7.1 Spire Global Inc. Small Satellite Selected Recent Contracts / Projects / Programmes
8.7.2 Spire Global Analysis
8.8 GeoOptics LLC
8.8.1 GeoOptics LLC Small Satellite Selected Recent Contracts / Projects / Programmes 2013-2014
8.8.2 GeoOptics LLC Analysis
8.9 OneWeb LLC
8.9.1 OneWeb LLC Small Satellite Selected Recent Contracts / Projects / Programmes
8.9.2 OneWeb Analysis
8.10 Other Companies Involved in the Small Satellite Market 2018
9. Conclusions and Recommendations
9.1 Dedicated Launch for Small Satellites
9.2 3D Printing in Manufacturing Satellite Parts
10. Glossary
Associated Visiongain Reports
visiongain Report Sales Order Form
Appendix A
About visiongain
Appendix B
visiongain report evaluation form
List of Tables
Table 3.1 Global Small Satellite Market Forecast 2018-2028 (US$m, AGR %, CAGR %, Cumulative)
Table 3.2 Global Small Satellite Market Drivers & Restraints 2018
Table 4.1 Global Small Satellite Classification Submarket Forecast 2018-2028 (US$m, AGR %,
Cumulative)
Table 4.2 Global Small Satellite Classification Submarket CAGR Forecast 2018-2023, 2023-2028, 2018-2028 (CAGR %)
Table 5.1 Global Small Satellite Application Submarket Forecast 2018-2028 (US$m, AGR %, CAGR %,
Cumulative)
Table 5.2 Global Small Satellite Application Submarket CAGR Forecast 2018-2023, 2023-2028, 2018-2028 (CAGR %)
Table 6.1 Leading National Small Satellite Market Forecast 2018-2028 (US$m, AGR %,
CAGR %, Cumulative)
Table 6.2 Leading National Small Satellite Markets Percentage Change in Market Share 2018-2023, 2023-2028, 2018-2028 (% Change)
Table 6.3 U.S. Small Satellite Market Forecast 2018-2028 (US$m, AGR %, CAGR %, Cumulative)
Table 6.4 U.S. Small Satellite Market Major Contracts & Programmes 2016 (Date, Company, Value US$m, Details)
Table 6.5 U.S. Small Satellite Market Drivers & Restraints 2018
Table 6.6 Canada Small Satellite Market Forecast 2018-2028 (US$m, AGR %, CAGR %, Cumulative)
Table 6.7 Canadian Small Satellite Market Major Contracts & Programmes 2016 (Date, Company, Value US$m, Details)
Table 6.8 Canadian Small Satellite Market Drivers & Restraints 2018
Table 6.9 U.K. Small Satellite Market Forecast 2018-2028 (US$m, AGR %, CAGR %, Cumulative)
Table 6.10 U.K. Small Satellite Market Major Contracts & Programmes 2016 (Date, Company, Value US$m, Details)
Table 6.11 U.K. Small Satellite Market Drivers & Restraints 2018
Table 6.12 Russian Small Satellite Market Forecast 2018-2028 (US$m, AGR %, CAGR %, Cumulative)
Table 6.13 Russian Small Satellite Market Major Contracts & Programmes 2015-2016 (Date, Company, Value US$m, Details)
Table 6.14 Russian Small Satellite Market Drivers & Restraints 2018
Table 6.15 Denmark Small Satellite Market Forecast 2018-2028 (US$m, AGR %, CAGR %, Cumulative)
Table 6.16 Denmark Small Satellite Market Major Contracts & Programmes 2016 (Date, Company, Value US$m, Details)
Table 6.17 Denmark Small Satellite Market Drivers & Restraints 2018
Table 6.18 Japanese Small Satellite Market Forecast 2018-2028 (US$m, AGR %, CAGR %, Cumulative)
Table 6.19 Japanese Small Satellite Market Major Contracts & Programmes 2015 (Date, Company, Value US$m, Details)
Table 6.20 Japanese Small Satellite Market Drivers & Restraints 2018
Table 6.21 Chinese Small Satellite Market Forecast 2018-2028 (US$m, AGR %, CAGR %, Cumulative)
Table 6.22 Chinese Small Satellite Market Major Contracts & Programmes 2016 (Date, Company, Value US$m, Details)
Table 6.23 Chinese Small Satellite Market Drivers & Restraints 2018
Table 6.24 Indian Small Satellite Market Forecast 2018-2028 (US$m, AGR %, CAGR %, Cumulative)
Table 6.25 Indian Small Satellite Market Major Contracts & Programmes 2016 (Date, Company, Value US$m, Details)
Table 6.26 Indian Small Satellite Market Drivers & Restraints 2018
Table 6.27 Indonesian Small Satellite Market Forecast 2018-2028 (US$m, AGR %, CAGR %, Cumulative)
Table 6.28 Indonesian Small Satellite Market Major Contracts & Programmes 2014 (Date, Company, Details)
Table 6.29 Indonesian Small Satellite Market Drivers & Restraints 2018
Table 6.30 Singapore Small Satellite Market Forecast 2018-2028 (US$m, AGR %, CAGR %, Cumulative)
Table 6.31 Singapore Small Satellite Market Major Contracts & Programmes 2014 (Date, Company, Value US$m, Details)
Table 6.32 Singapore Small Satellite Market Drivers & Restraints 2018
Table 6.33 Rest of the World (RoW) Small Satellite Market Forecast 2018-2028 (US$m, AGR %, CAGR %, Cumulative)
Table 6.34 Rest of the World (RoW) Small Satellite Market Major Contracts & Programmes (Date, Country, Company, Value US$m, Details)
Table 6.35 Rest of the World (RoW) Small Satellite Market Drivers & Restraints 2018
Table 7.1 Global Small Satellite Market PEST Analysis 2018-2028
Table 8.1 Leading 8 Small Satellite Companies Listed Alphabetically (Company, FY2015 Total Company Sales US$m, HQ)
Table 8.2 The Boeing Company 2018 (CEO, Total Company Sales US$m, Sales in the Defense and Space Market US$m, Share of Total Company Sales from Defense and Space Segment %, Strongest Business Region, Net Income US$m, Business Segment in the Market, Submarket Involvement, HQ, Founded, IR Contact, Ticker, Website)
Table 8.3 Selected Recent The Boeing Company Small Satellite Contracts / Projects / Programmes (Date, Country, Subcontractor, Value US$m, Details)
Table 8.4 The Boeing Company Total Company Sales 2013-2017 (US$m, AGR %)
Table 8.5 The Boeing Company Sales by Segment of Business 2013-2017 (US$m, AGR %)
Table 8.6 The Boeing Company Net Income 2013-2017 (US$m, AGR %)
Table 8.7 The Boeing Company Cost of Research & Development 2013-2017 (US$m, AGR %)
Table 8.8 The Boeing Company Sales by Geographical Location 2013-2017 (US$m, AGR %)
Table 8.9 ORBCOMM Inc. 2017 (CEO, Total Company Sales US$m, Strongest Business Region, Net Income / Loss US$m, Submarket Involvement, HQ, Founded, IR Contact, Ticker, Website)
Table 8.10 Selected Recent ORBCOMM Inc. Small Satellite Contracts / Projects / Programmes (Date, Country, Subcontractor, Value US$m, Details)
Table 8.11 ORBCOMM Inc. Total Company Sales 2013-2017 (US$m, AGR %)
Table 8.12 ORBCOMM Inc.Net Income / Loss 2013-2017 (US$m)
Table 8.13 ORBCOMM Inc. Cost of Research & Development 2013-2017 (US$m, AGR %)
Table 8.14 ORBCOMM Inc. Sales by Geographical Location 2013-2017 (US$m, AGR %)
Table 8.15 Aerospace Corporation Profile 2017 (CEO, Strongest Business Region, Business Segment in the Market, Submarket Involvement, HQ, Founded, Website)
Table 8.16 Selected Recent Aerospace Corporation Small Satellite Contracts / Projects / Programmes 2012 (Date, Country, Subcontractor, Value US$m, Product, Details)
Table 8.17 Surrey Satellite Technology Limited (SSTL) Profile 2017 (CEO, Strongest Business Region, Submarket Involvement, HQ, Founded, Website)
Table 8.18 Selected Recent Surrey Satellite Technology Limited (SSTL) Small Satellite Contracts / Projects / Programmes (Date, Country, Subcontractor, Value US$m, Details)
Table 8.19 Planet Labs Inc. Profile 2016 (CEO, Strongest Business Region, Submarket Involvement, HQ, Founded, Website)
Table 8.20 Selected Recent Planet Labs Inc. Small Satellite Contracts / Projects / Programmes 2016 (Date, Country, Subcontractor, Value US$m, Details)
Table 8.21 Spire Global Inc. Profile 2016 (CEO, Strongest Business Region, Submarket Involvement, HQ, Founded, Website)
Table 8.22 Selected Recent Spire Global Inc. Small Satellite Contracts / Projects / Programmes 2016 (Date, Country, Subcontractor, Value US$m, Details)
Table 8.23 GeoOptics LLC Profile 2016 (CEO, Strongest Business Region, Submarket Involvement, HQ, Founded, Website)
Table 8.24 Selected Recent GeoOptics LLC Small Satellite Contracts / Projects / Programmes 2013-2014 (Date, Country, Subcontractor, Value US$m, Details)
Table 8.25 OneWeb LLC Profile 2017 (CEO, Strongest Business Region, Submarket Involvement, HQ, Founded, Website)
Table 8.26 Selected Recent OneWeb LLC Small Satellite Contracts / Projects / Programmes (Date, Country, Subcontractor, Value US$m, Details)
Table 8.27 Other Companies Involved in the Small Satellite Market 2018 (Company, Submarket Involvement, Location)
List of Figures
Figure 2.1 Global Small Satellite Market Segmentation Overview
Figure 3.1 Global Small Satellite Market Forecast 2018-2028 (US$m, AGR %)
Figure 4.1 Global Small Satellite Classification Submarket AGR Forecast 2018-2028 (AGR %)
Figure 4.2 Global Small Satellite Classification Submarket Forecast 2018-2028 (US$m, Global AGR %)
Figure 4.3 Global Small Satellite Submarket Share Forecast 2018 (% Share)
Figure 4.4 Global Small Satellite Submarket Share Forecast 2023 (% Share)
Figure 4.5 Global Small Satellite Submarket Share Forecast 2028 (% Share)
Figure 4.6 Global Small Satellite Classification Submarket CAGR Forecast 2018-2023 (CAGR %)
Figure 4.7 Global Small Satellite Classification Submarket CAGR Forecast 2023-2028 (CAGR %)
Figure 4.8 Global Small Satellite Classification Submarket CAGR Forecast 2018-2028 (CAGR %)
Figure 4.9 Global Small Satellite Classification Submarket Percentage Change in Market Share 2018-2023 (% Change)
Figure 4.10 Global Small Satellite Classification Submarket Percentage Change in Market Share 2023-2028 (% Change)
Figure 4.11 Global Small Satellite Classification Submarket Percentage Change in Market Share 2018-2028 (% Change)
Figure 5.1 Global Small Satellite Application Submarket AGR Forecast 2018-2028 (AGR %)
Figure 5.2 Global Small Satellite Application Submarket 2018-2028 (US$m, Global AGR %)
Figure 5.3 Global Small Satellite Application Market Share Forecast 2018 (% Share)
Figure 5.4 Global Small Satellite Application Market Share Forecast 2023 (% Share)
Figure 5.5 Global Small Satellite Application Market Share Forecast 2028 (% Share)
Figure 5.6 Global Small Satellite Application Submarket CAGR Forecast 2018-2023 (CAGR %)
Figure 5.7 Global Small Satellite Application Submarket CAGR Forecast 2023-2028 (CAGR %)
Figure 5.8 Global Small Satellite Application Submarket CAGR Forecast 2018-2028 (CAGR %)
Figure 5.9 Global Small Satellite Application Submarket Percentage Change in Market Share 2018-2023 (% Change)
Figure 5.10 Global Small Satellite Application Submarket Percentage Change in Market Share 2023-2028 (% Change)
Figure 5.11 Global Small Satellite Application Submarket Percentage Change in Market Share 2018-2028 (% Change)
Figure 6.1 Global Small Satellite Market by National Markets AGR Forecast 2018-2028 (AGR %)
Figure 6.2 Global Small Satellite Market by Country Market Share Forecast 2018 (% Share)
Figure 6.2 Global Small Satellite Market by Country Market Share Forecast 2023 (% Share)
Figure 6.4 Global Small Satellite Market by Country Market Share Forecast 2028 (% Share)
Figure 6.5 Global Small Satellite National Markets CAGR Forecast 2018-2023 (CAGR %)
Figure 6.6 Global Small Satellite National Markets CAGR Forecast 2023-2028 (CAGR %)
Figure 6. 7Global Small Satellite National Markets CAGR Forecast 2018-2028 (CAGR %)
Figure 6.8Global Small Satellite National Markets Percentage Change in Market Share 2018-2023 (% Change)
Figure 6.9 Global Small Satellite National Markets Percentage Change in Market Share 2023-2028 (% Change)
Figure 6.10 Global Small Satellite National Markets Percentage Change in Market Share 2018-2028 (% Change)
Figure 6.11 U.S. Small Satellite Market Forecast 2018-2028 (US$m, Country, Total Market Sales AGR %)
Figure 6.12 Canada Small Satellite Market Forecast 2018-2028 (US$m, Country, Total Market Sales AGR %)
Figure 6.13 U.K. Small Satellite Market Forecast 2018-2028 (US$m, Country, Total Market Sales AGR %)
Figure 6.14 Russian Small Satellite Market Forecast 2018-2028 (US$m, Country, Total Market Sales AGR %)
Figure 6.15 Denmark Small Satellite Market Forecast 2018-2028 (US$m, Country, Total Market Sales AGR %)
Figure 6.16 Japanese Small Satellite Market Forecast 2018-2028 (US$m, Country, Total Market Sales AGR %)
Figure 6.17 Chinese Small Satellite Market Forecast 2018-2028 (US$m, Country, Total Market Sales AGR %)
Figure 6.18 Indian Small Satellite Market Forecast 2018-2028 (US$m, Country, Total Market Sales AGR (%)
Figure 6.19 Indonesian Small Satellite Market Forecast 2018-2028 (US$m, Country, Total Market Sales AGR %)
Figure 6.20 Singapore Small Satellite Market Forecast 2018-2028 (US$m, Country, Total Market Sales AGR %)
Figure 6.21 Rest of the World (RoW) Small Satellite Market Forecast 2018-2028 (US$m, Country, Total Market Sales AGR %)
Figure 8.1 The Boeing Company Total Company Sales 2011-2015 (US$m, AGR %)
Figure 8.2 The Boeing Company Sales by Segment of Business 2011-2015 (US$m, Total Company Sales AGR %)
Figure 8.3 The Boeing Company Sales AGR by Segment of Business 2012-2015 (AGR %)
Figure 8.4 The Boeing Company Net Income 2011-2015 (US$m, AGR %)
Figure 8.5 The Boeing Company Cost of Research & Development 2011-2015 (US$m, AGR %)
Figure 8.6 The Boeing Company Sales AGR by Geographical Location 2011-2015 (AGR %)
Figure 8.7 The Boeing Company Sales by Geographical Location 2011-2015 (US$m, Total Company Sales AGR %)
Figure 8.8 The Boeing Company Organisational Structure 2016
Figure 8.9 ORBCOMM Inc. Total Company Sales 2013-2017 (US$m, AGR %)
Figure 8.10 ORBCOMM Inc.Net Income / Loss 2011-2015 (US$m)
Figure 8.11 ORBCOMM Inc. Cost of Research & Development 2011-2015 (US$m, AGR %)
Figure 8.12 ORBCOMM Inc. Company Sales by Geographical Location 2011-2015 (US$m, AGR %)
Figure 8.13 ORBCOMM Inc. Company Sales AGR by Geographical Location 2012-2015 (US$m, Total Company Sales AGR %)