Industries > Chemicals > Silicone Market 2017-2027

Silicone Market 2017-2027
Forecasts by Application (Chemicals, Medical & Personal Care, Automotive & Transportation, Building & Construction, Electrical & Electronics, Plastics, Textile and Others), by Type (Elastomers, Fluids, Resins, Gels and Others) and by Region Plus Profiles of Top Companies
Visiongain’s new 240 pages report assesses that the global Silicone market will reach $17.52 billion in 2017.
Are you involved in Silicone or need to understand its market dynamics? If so, then you must read this report
It’s vital that you keep your knowledge up to date. You need this report.
Market scope: This brand new report from Visiongain is a completely fresh market assessment of the Silicone market based upon the latest information. Our new market study contains forecasts, original analysis, company profiles and, most crucially, fresh conclusions. The report gives detailed forecasts and analysis of the Silicone markets by region and end-use sectors.
Silicone Market Forecast 2017-2027 report responds to your need for definitive market data:
• Where are the Silicone market opportunities?
• 306 tables, charts, and graphs reveal market data allowing you to target your strategy more effectively
• When will the Silicone market grow?
• Global, national and the Silicone submarket forecasts and analysis from 2017-2027 illustrate the market progression
• Which Silicone submarkets will flourish from 2017-2027?
• Chemicals Submarket 2017-2027
• Medical & Personal Care Submarket 2017-2027
• Automotive & Transportation Submarket 2017-2027
• Building & Construction Submarket 2017-2027
• Electrical & Electronics Submarket 2017-2027
• Plastics Submarket 2017-2027
• Textile Submarket 2017-2027
• Others Application Submarket 2017-2027
• Elastomers Submarket 2017-2027
• Fluids Submarket 2017-2027
• Resins Submarket 2017-2027
• Gels Submarket 2017-2027
• Others Type Submarket 2017-2027
• Where are the regional Silicone market opportunities from 2017-2027?
Focused regional forecasts and analysis explore the future opportunities
• Asia Pacific forecast 2017-2027
• Middle East and Africa forecast 2017-2027
• Central & South America forecast 2017-2027
• Europe forecast 2017-2027
• North America forecast 2017-2027
• What are the factors influencing Silicone market dynamics?
• SWOT analysis explores the factors.
• Research and development (R&D) strategy
• Supply and demand dynamics
• Advances in product quality
• Who are the leading Silicone companies?
• We reveal market share, positioning, capabilities, product portfolios, R&D activity, services, focus, strategies, M&A activity, and future outlook.
• Asia Pacific
• North America
• Africa
• Middle East
• Latin America
• Shin-Etsu Chemical Co.
• Dow Corning Corporation
• Wacker Chemie
• 3M Company
• BASF
• DOW Chemical Company
• Who should read this report?
• Anyone within the Silicone value chain, including
• Raw material suppliers
• R&D specialists
• CEO’s
• COO’s
• CIO’s
• Business development managers
• Marketing managers
• Technologists
• Investors
• Banks
• Government agencies
• Contractors
Get our report today Silicone Market 2017-2027: Forecasts by Application (Chemicals, Medical & Personal Care, Automotive & Transportation, Building & Construction, Electrical & Electronics, Plastics, Textile and Others), by Type (Elastomers, Fluids, Resins, Gels and Others) and by Region Plus Profiles of Top Companies. Avoid missing out – order our report now.
Visiongain is a trading partner with the US Federal Government
CCR Ref number: KD4R6
1. Report Overview
1.1 Global Silicone Market Overview
1.2 Why You Should Read This Report
1.3 How This Report Delivers
1.4 Key Questions Answered by This Analytical Report Include:
1.5 Who is This Report For?
1.6 Methodology
1.6.1 Primary Research
1.6.2 Secondary Research
1.6.3 Market Evaluation & Forecasting Methodology
1.7 Frequently Asked Questions (FAQ)
1.8 Associated Visiongain Reports
1.9 About Visiongain
2. Introduction to the Silicone Market
2.1 Silicone Market Structure
2.2 Silicone Market Definition
2.3 Silicone Types
2.3.1 Elastomers Overview
2.3.2 Silicone Fluids Overview
2.3.3 Silicone Resins Overview
2.3.4 Silicone Gels Overview
2.3.5 Others Overview
2.4 Silicone Applications
2.4.1 Chemicals Overview
2.4.2 Medical & Personal Care Overview
2.4.3 Automotive & Transportation Overview
2.4.4 Building & Construction Overview
2.4.5 Electrical & Electronics Overview
2.4.6 Plastics Overview
2.4.7 Textiles Overview
2.3.8 Others Overview
3. Global Silicones Market 2017-2027
3.1 Global Silicones Market Forecast 2017-2027
3.2 Global Silicones Drivers & Restraints
3.2.1 Global Silicones Market Drivers
3.2.1.1 Growth due to emerging economies such as Asia-Pacific, the Middle East
3.2.1.2 Expertise in modern technologies & formulations
3.2.1.3 Growth in end-user industry namely automotive, personal care, chemicals, and construction
3.2.2 Global Silicones Market Restraints
3.2.2.1 Lack of Quality Control across developing countries
3.2.3 Global Silicones Market Opportunities
3.2.3.1 Growth opportunity for emerging economies as China, India, and Indonesia
3.2.3.2 Innovation in applications as well as product grades
3.2.4 Global Silicones Market Price Forecast Analysis 2017-2027
3.2.5 SWOT Analysis of the Silicones Market 2017-2027
3.2.6 Market Life Cycle Analysis of the Silicones Market
4. Global Silicones Application Forecast 2017-2027
4.1 Global Silicone Chemicals Application Sales Forecast 2017-2027
4.2 Global Silicone Chemicals Application Consumption Forecast 2017-2027
4.3 Global Silicone Medical & Personal Care Application Sales Forecast 2017-2027
4.4 Global Silicone Medical & Personal Care Application Consumption Forecast 2017-2027
4.5 Global Silicone Automotive & Transportation Application Sales Forecast 2017-2027
4.6 Global Silicone Automotive & Transportation Application Consumption Forecast 2017-2027
4.7 Global Silicone Building & Construction Application Sales Forecast 2017-2027
4.8 Global Silicone Building & Construction Application Consumption Forecast 2017-2027
4.9 Global Silicone Electrical & Electronics Application Sales Forecast 2017-2027
4.10 Global Silicone Electrical & Electronics Application Consumption Forecast 2017-2027
4.11 Global Silicone Plastics Application Sales Forecast 2017-2027
4.12 Global Silicone Plastics Application Consumption Forecast 2017-2027
4.13 Global Silicone Textiles Application Sales Forecast 2017-2027
4.14 Global Silicone Textiles Application Consumption Forecast 2017-2027
4.15 Global Silicone Others Application Sales Forecast 2017-2027
4.16 Global Silicone Others Application Consumption Forecast 2017-2027
5. Global Silicone Types Forecast 2017-2027
5.1 Global Silicone Elastomers Sales Forecast 2017-2027
5.2 Global Silicone Elastomers Consumption Forecast 2017-2027
5.3 Global Silicone Fluids Sales Forecast 2017-2027
5.4 Global Silicone Fluids Consumption Forecast 2017-2027
5.5 Global Silicone Resins Sales Forecast 2017-2027
5.6 Global Silicone Resins Consumption Forecast 2017-2027
5.7 Global Silicone Gels Sales Forecast 2017-2027
5.8 Global Silicone Gels Consumption Forecast 2017-2027
5.9 Global Silicone Others Sales Forecast 2017-2027
5.10 Global Silicone Others Consumption Forecast 2017-2027
6. Regional Silicone Market Forecast 2017-2027
6.1 North America Silicones Market Forecast 2017-2027
6.2 Asia-Pacific Silicones Market Forecast 2017-2027
6.3 Europe Silicones Market Forecast 2017-2027
6.5 Middle East Silicones Market Forecast 2017-2027
6.5 Africa Silicones Market Forecast 2017-2027
6.6 Latin America Silicones Market Forecast 2017-2027
6.7 Dominance of the Asia-Pacific due to growing domestic markets, rising population, and increasing income levels of people in the region
7. Expert Opinions
7.1 Silicone Industry Expert
7.2 Other Insights by Industry Experts
8. Leading Companies in the Silicones Market
8.1 Leading Silicone Manufacturer Sales in 2016
8.1.1 Market Share Analysis
8.2 Shin-Etsu Chemical Co., Ltd
8.2.1 Shin-Etsu Chemical Co., Ltd. Sales by Segment of Business 2012-2016
8.2.2 Shin-Etsu Chemical Co., Ltd. Cost of Research & Development 2012-2016
8.2.3 Shin-Etsu Chemical Co., Ltd. Sales Share by Geographical Location 2016
8.2.4 Shin-Etsu Chemical Co., Ltd. Primary Market Competitors
8.2.5 Shin-Etsu Chemical Co., Ltd. Silicone Products/Services
8.3 Dow Corning Corporation
8.3.1 Dow Corning Corporation Sales by Segment of Business 2012-2015
8.3.2 Dow Corning Corporation Cost of Research & Development 2012-2015
8.3.3 Dow Corning Corporation Sales Share by Geographical Location 2015
8.3.4 Dow Corning Corporation Primary Market Competitors
8.3.5 Dow Corning Corporation Silicone Products/Services
8.4 Wacker Chemie AG
8.4.1 Wacker Chemie AG Sales by Segment of Business 2012-2015
8.4.2 Wacker Chemie AG Cost of Research & Development 2012-2015
8.4.3 Wacker Chemie AG Sales Share by Geographical Location 2015
8.4.4 Wacker Chemie AG Primary Market Competitors
8.4.5 Wacker Chemie AG Silicone Products/Services
8.5 3M Company
8.5.1 3M Company Sales by Segment of Business 2012-2015
8.5.2 3M Company Cost of Research & Development 2012-2015
8.5.3 3M Company Sales Share by Geographical Location 2015
8.5.4 3M Company Primary Market Competitors
8.5.5 3M Company Silicone Products/Services
8.6 BASF SE
8.6.1 BASF SE Sales in Chemicals Business Segment 2012-2015
8.6.2 BASF SE Sales by Segment of Business 2012-2015
8.6.3 BASF SE Cost of Research & Development 2011-2015
8.6.4 BASF SE Primary Market Competitors
8.6.5 BASF SE Silicone Products/Services
8.7 Bluestar Silicones International
8.7.1 Bluestar Silicones International Primary Market Competitors
8.7.2 Bluestar Silicones International Silicone Products/Services
8.8 Kaneka Corporation
8.8.1 Kaneka Corporation Sales by Segment of Business 2012-2016
8.8.2 Kaneka Corporation Cost of Research & Development 2012-2016
8.8.3 Kaneka Corporation Sales Share by Geographical Location 2016
8.8.4 Kaneka Corporation Primary Market Competitors
8.8.5 Kaneka Corporation Silicone Products/Services
8.9 KCC Corporation
8.9.1 KCC Corporation Net Income of Business 2012-2015
8.9.2 KCC Corporation Primary Market Competitors
8.9.3 KCC Corporation Silicone Products/Services
8.10 Momentive Performance Materials Inc.
8.10.1 Momentive Performance Materials Inc. Sales by Segment of Business 2012-2015
8.10.2 Momentive Performance Materials Inc. Cost of Research & Development 2012-2015
8.10.3 Momentive Performance Materials Inc. Geographical Sales, 2015
8.10.4 Momentive Performance Materials Inc. Primary Market Competitors
8.10.5 Momentive Performance Materials Inc. Silicone Products/Services
8.11 Evonik Industries
8.11.1 Evonik Industries Sales by Segment of Business 2010-2014
8.11.2 Evonik Industries Cost of Research & Development 2010-2014
8.11.3 Evonik Industries Sales by Geographical Location 2015
8.11.4 Evonik Industries Primary Market Competitors
8.11.5 Evonik Industries Silicone Products/Services
8.12 Developments in the Silicones Market
8.12.1 Mergers and Acquisitions, Partnership/Joint Venture/Collaboration
8.12.2 Investment and Expansions
8.12.3 New Product Launches
8.13. Other Leading Companies
9. Conclusions and Recommendations
9.1 The Global Silicones Overview
9.2 The Global Silicones Consumption by Application
9.3 The Summary of Global Silicones Market by Region and Type
9.4 Drivers and Restraints of the Global Silicones Market 2017-2027
10. Glossary
Associated Visiongain Reports
Visiongain Report Sales Order Form
Appendix A
About Visiongain
Appendix B
Visiongain report evaluation form
List of Tables
Table 1.1 Example of Silicone Market by Regional Market Forecast 2017-2027 (US$m, AGR %, Cumulative)
Table 1.2 Example of Leading National Silicone Market Forecast by Submarket 2017-2027 (US$m, AGR %, Cumulative)
Table 3.1 Global Silicones Market Forecast 2017-2027 (US$m, AGR %, CAGR %, Cumulative)
Table 3.2 Top 9 Economies by GDP in PPP Terms, 2010 & 2020)
Table 3.3 Top 10 Economies by GDP in PPP Terms, 2014 & 2030
Table 3.4 Average Prices of Silicone Types in 2017 & 2027 ($/Kg)
Table 3.5 Global Silicones Market SWOT Analysis 2017-2027
Table 4.1 Global Silicones Application Market Forecast 2017-2027 (US$m, AGR %, Cumulative)
Table 4.2 Global Silicones Application Consumption Forecast 2017-2027 (Kilotons, AGR %, Cumulative)
Table 4.3 Global Silicones Application by Region Market Forecast 2017-2027 (US$m, Cumulative, Global AGR %)
Table 4.4 Global Silicones Application by Region Consumption Forecast 2017-2027 (Kilotons, Cumulative, Global AGR %)
Table 4.5 Global Silicones Application CAGR Sales Forecast 2017-2022, 2022-2027, 2017-2027 (CAGR %)
Table 4.6 Global Silicones Application CAGR Consumption Forecast 2017-2022, 2022-2027, 2017-2027 (CAGR %)
Table 4.7 Global Silicones Chemicals Application by Region Market Sales Forecast 2017-2027 (US$m, AGR %, CAGR %, Cumulative)
Table 4.8 Global Silicones Chemicals Application by Region Consumption Forecast 2017-2027 (Kilotons, AGR %, CAGR %, Cumulative)
Table 4.9 Global Silicone Medical & Personal Care Application by Region Sales Forecast 2017-2027 (US$m, AGR %, CAGR %, Cumulative)
Table 4.10 Global Silicone Medical & Personal Care Application by Region Consumption Forecast 2017-2027 (Kilotons, AGR %, CAGR %, Cumulative)
Table 4.11 Global Silicone Automotive & Transportation Application by Region Market Sales Forecast 2017-2027 (US$m, AGR %, CAGR %, Cumulative)
Table 4.12 Global Silicone Automotive & Transportation Application by Region Consumption Forecast 2017-2027 (Kilotons, AGR %, CAGR %, Cumulative)
Table 4.13 Global Silicone Building & Construction Application by Region Market Sales Forecast 2017-2027 (US$m, AGR %, CAGR %, Cumulative)
Table 4.14 Global Silicone Building & Construction Application by Region Consumption Forecast 2017-2027 (Kilotons, AGR %, CAGR %, Cumulative)
Table 4.15 Global Silicone Electrical & Electronics Application by Region Market Sales Forecast 2017-2027 (US$m, AGR %, CAGR %, Cumulative)
Table 4.16 Global Silicone Electrical & Electronics Application by Region Consumption Forecast 2017-2027 (Kilotons, AGR %, CAGR %, Cumulative)
Table 4.17 Global Silicone Plastics Application by Region Market Sales Forecast 2017-2027 (US$m, AGR %, CAGR %, Cumulative)
Table 4.18 Global Silicone Plastics Application by Region Consumption Forecast 2017-2027 (Kilotons, AGR %, CAGR %, Cumulative)
Table 4.19 Global Silicone Textiles Application by Region Market Sales Forecast 2017-2027 (US$m, AGR %, CAGR %, Cumulative)
Table 4.20 Global Silicone Textiles Application by Region Consumption Forecast 2017-2027 (Kilotons, AGR %, CAGR %, Cumulative)
Table 4.21 Global Silicone Others Application by Region Market Sales Forecast 2017-2027 (US$m, AGR %, CAGR %, Cumulative)
Table 4.22 Global Silicone Others Application by Region Consumption Forecast 2017-2027 (Kilotons, AGR %, CAGR %, Cumulative)
Table 5.1 Global Silicone Types by Region Market Forecast 2017-2027 (US$mn, Cumulative, Global AGR %)
Table 5.2 Global Silicone Types by Region Consumption Forecast 2017-2027 (Kilotons, Cumulative, Global AGR %)
Table 5.3 Global Silicone Types CAGR Sales Forecast 2017-2022, 2022-2027, 2017-2027 (CAGR %)
Table 5.4 Global Silicone Types CAGR Consumption Forecast 2017-2022, 2022-2027, 2017-2027 (CAGR %)
Table 5.5 Global Silicone Elastomers by Region Market Sales Forecast 2017-2027 (US$mn, AGR %, CAGR %, Cumulative)
Table 5.6 Global Silicone Elastomers by Region Consumption Forecast 2017-2027 (Kilotons, AGR %, CAGR %, Cumulative)
Table 5.7 Global Silicone Fluids by Region Market Sales Forecast 2017-2027 (US$mn, AGR %, CAGR %, Cumulative)
Table 5.8 Global Silicone Fluids by Region Consumption Forecast 2017-2027 (Kilotons, AGR %, CAGR %, Cumulative)
Table 5.9 Global Silicone Resins by Region Market Sales Forecast 2017-2027 (US$mn, AGR %, CAGR %, Cumulative)
Table 5.10 Global Silicone Resins by Region Consumption Forecast 2017-2027 (Kilotons, AGR %, CAGR %, Cumulative)
Table 5.11 Global Silicone Gels by Region Market Sales Forecast 2017-2027 (US$mn, AGR %, CAGR %, Cumulative)
Table 5.12 Global Silicone Gels by Region Consumption Forecast 2017-2027 (Kilotons, AGR %, CAGR %, Cumulative)
Table 5.13 Global Silicone Others by Region Market Sales Forecast 2017-2027 (US$mn, AGR %, CAGR %, Cumulative)
Table 5.14 Global Silicone Others by Region Consumption Forecast 2017-2027 (Kilotons, AGR %, CAGR %, Cumulative)
Table 6.1 Leading Regional Silicones Market by Region Forecast 2017-2027 (US$m, Global AGR %)
Table 6.2 Leading Regional Silicones Consumption by Region Forecast 2017-2027 (Kilotons, Global AGR %)
Table 6.3 Global Silicone Applications CAGR Sales Forecast 2017-2022, 2022-2027, 2017-2027 (CAGR %)
Table 6.4 Global Silicone Regional CAGR Consumption Forecast 2017-2022, 2022-2027, 2017-2027 (CAGR %)
Table 6.5 North America Silicones Market by Types Forecast 2017-2027 (US$m, Global AGR %)
Table 6.6 North America Silicones Consumption by Types Forecast 2017-2027 (Kilotons, Global AGR %)
Table 6.7 Global Silicone Types CAGR Sales Forecast 2017-2022, 2022-2027, 2017-2027 (CAGR %)
Table 6.8 North America Silicone Types CAGR Consumption Forecast 2017-2022, 2022-2027, 2017-2027 (CAGR %)
Table 6.9 North America Silicones Market by Application Forecast 2017-2027 (US$m, North America AGR %)
Table 6.10 North America Silicones Consumption by Application Forecast 2017-2027 (Kilotons, North America AGR %)
Table 6.11 North America Silicone Application CAGR Sales Forecast 2017-2022, 2022-2027, 2017-2027 (CAGR %)
Table 6.12 North America Silicone Application CAGR Consumption Forecast 2017-2022, 2022-2027, 2017-2027 (CAGR %)
Table 6.13 Asia-Pacific Silicones Market by Types Forecast 2017-2027 (US$m, Asia-Pacific AGR %)
Table 6.14 Asia-Pacific Silicones Consumption by Types Forecast 2017-2027 (Kilotons, Asia-Pacific AGR %)
Table 6.15 Asia-Pacific Silicone Types CAGR Sales Forecast 2017-2022, 2022-2027, 2017-2027 (CAGR %)
Table 6.16 Asia-Pacific Silicone Types CAGR Consumption Forecast 2017-2022, 2022-2027, 2017-2027 (CAGR %)
Table 6.17 Asia-Pacific Silicones Market by Application Forecast 2017-2027 (US$m, Asia-Pacific AGR %)
Table 6.18 Asia-Pacific Silicones Consumption by Application Forecast 2017-2027 (Kilotons, Asia-Pacific AGR %)
Table 6.19 Asia-Pacific Silicone Application CAGR Sales Forecast 2017-2022, 2022-2027, 2017-2027 (CAGR %)
Table 6.20 Asia-Pacific Silicone Application CAGR Consumption Forecast 2017-2022, 2022-2027, 2017-2027 (CAGR %)
Table 6.21 Europe Silicones Market by Types Forecast 2017-2027 (US$m, Europe AGR %)
Table 6.22 Europe Silicones Consumption by Types Forecast 2017-2027 (Kilotons, Europe AGR %)
Table 6.23 Europe Silicone Types CAGR Sales Forecast 2017-2022, 2022-2027, 2017-2027 (CAGR %)
Table 6.24 Europe Silicone Types CAGR Consumption Forecast 2017-2022, 2022-2027, 2017-2027 (CAGR %)
Table 6.25 Europe Silicones Market by Application Forecast 2017-2027 (US$m, Europe AGR %)
Table 6.26 Europe Silicones Consumption by Application Forecast 2017-2027 (Kilotons, Europe AGR %)
Table 6.27 Europe Silicone Application CAGR Sales Forecast 2017-2022, 2022-2027, 2017-2027 (CAGR %)
Table 6.28 Europe Silicone Application CAGR Consumption Forecast 2017-2022, 2022-2027, 2017-2027 (CAGR %)
Table 6.29 Middle East Silicones Market by Types Forecast 2017-2027 (US$m, Middle East AGR %)
Table 6.30 Middle East Silicones Consumption by Types Forecast 2017-2027 (Kilotons, Middle East AGR %)
Table 6.31 Middle East Silicone Types CAGR Sales Forecast 2017-2022, 2022-2027, 2017-2027 (CAGR %)
Table 6.32 Middle East Silicone Types CAGR Consumption Forecast 2017-2022, 2022-2027, 2017-2027 (CAGR %)
Table 6.33 Middle East Silicones Market by Application Forecast 2017-2027 (US$m, Middle East AGR %)
Table 6.34 Middle East Silicones Consumption by Application Forecast 2017-2027 (Kilotons, Middle East AGR %)
Table 6.35 Middle East Silicone Application CAGR Sales Forecast 2017-2022, 2022-2027, 2017-2027 (CAGR %)
Table 6.36 Middle East Silicone Application CAGR Consumption Forecast 2017-2022, 2022-2027, 2017-2027 (CAGR %)
Table 6.37 Africa Silicones Market by Types Forecast 2017-2027 (US$m, Africa AGR %)
Table 6.38 Africa Silicones Consumption by Types Forecast 2017-2027 (Kilotons, Africa AGR %)
Table 6.39 Africa Silicone Types CAGR Sales Forecast 2017-2022, 2022-2027, 2017-2027 (CAGR %)
Table 6.40 Africa Silicone Types CAGR Consumption Forecast 2017-2022, 2022-2027, 2017-2027 (CAGR %)
Table 6.41 Africa Silicones Market by Application Forecast 2017-2027 (US$m, Africa AGR %)
Table 6.42 Africa Silicones Consumption by Application Forecast 2017-2027 (Kilotons, Africa AGR %)
Table 6.43 Africa Silicone Application CAGR Sales Forecast 2017-2022, 2022-2027, 2017-2027 (CAGR %)
Table 6.44 Africa Silicone Application CAGR Consumption Forecast 2017-2022, 2022-2027, 2017-2027 (CAGR %)
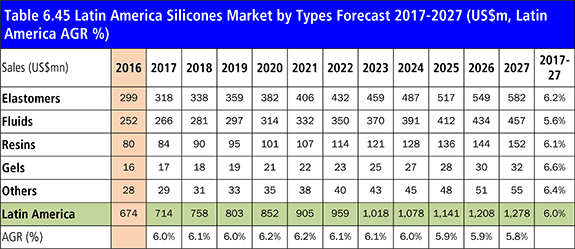
Table 6.45 Latin America Silicones Market by Types Forecast 2017-2027 (US$m, Latin America AGR %)
Table 6.46 Latin America Silicones Consumption by Types Forecast 2017-2027 (Kilotons, Latin America AGR %)
Table 6.47 Latin America Silicone Types CAGR Sales Forecast 2017-2022, 2022-2027, 2017-2027 (CAGR %)
Table 6.48 Latin America Silicone Types CAGR Consumption Forecast 2017-2022, 2022-2027, 2017-2027 (CAGR %)
Table 6.49 Latin America Silicones Market by Application Forecast 2017-2027 (US$m, Latin America AGR %)
Table 6.50 Latin America Silicones Consumption by Application Forecast 2017-2027 (Kilotons, Latin America AGR %)
Table 6.51 Latin America Silicone Application CAGR Sales Forecast 2017-2022, 2022-2027, 2017-2027 (CAGR %)
Table 6.52 Latin America Silicone Application CAGR Consumption Forecast 2017-2022, 2022-2027, 2017-2027 (CAGR %)
Table 8.1 Leading Silicone Manufacturer Sales in 2016 (Ranking, Company, Headquarters, FY2016 Total Company Sales US$m)
Table 8.2 Shin-Etsu Chemical Co., Ltd Company Profile 2016 (Chairman, Total Company Sales US$m, Share of Company Sales from Silicones Business Market %, Net Income US$m, Net Capital Expenditure US$m, Strongest Business Region, Business Segment in the Market, HQ, Founded, No. of Employees, IR Contact, Ticker, Website)
Table 8.3 Shin-Etsu Chemical Co., Ltd. Total Company Sales 2012-2016 (US$m, AGR %)
Table 8.4 Shin-Etsu Chemical Co., Ltd. Sales by Segment of Business 2012-2016 (US$m, AGR %)
Table 8.5 Shin-Etsu Chemical Co., Ltd. Cost of Research & Development 2012-2016 (US$m, AGR %)
Table 8.6 Shin-Etsu Chemical Co., Ltd. Silicone Products/Services (Segment of Business, Product, and Specifications/Features)
Table 8.7 Dow Corning Corporation Company Profile 2016 (CEO, Total Company Sales US$m, Share of Company Sales from Silicones Business Market %, Net Income US$m, Net Capital Expenditure US$m, Strongest Business Region, Business Segment in the Market, Submarket Involvement, HQ, Founded, No. of Employees, IR Contact, Ticker, Website)
Table 8.8 Dow Corning Corporation Total Company Sales 2012-2015 (US$m, AGR %)
Table 8.9 Dow Corning Corporation Sales by Segment of Business 2012-2015 (US$m, AGR %)
Table 8.10 Dow Corning Corporation Cost of Research & Development 2012-2016 (US$m, AGR %)
Table 8.11 Dow Corning Corporation Silicone Products/Services (Segment of Business, Product, and Specifications/Features)
Table 8.12 Wacker Chemie AG Company Profile 2016 (CEO, Total Company Sales US$m, Share of Company Sales from Silicones Business Market %, Net Income US$m, Net Capital Expenditure US$m, Strongest Business Region, Business Segment in the Market, HQ, Founded, No. of Employees, IR Contact, Ticker, Website)
Table 8.13 Wacker Chemie AG Total Company Sales 2012-2015 (US$m, AGR %)
Table 8.14 Wacker Chemie AG Sales by Segment of Business 2011-2015 (US$m, AGR %)
Table 8.15 Wacker Chemie AG Cost of Research & Development 2012-2016 (US$m, AGR %)
Table 8.16 Wacker Chemie AG Silicone Products/Services (Segment of Business, Product, and Specifications/Features)
Table 8.17 3M Company Profile 2016 (CEO, Total Company Sales US$m, Share of Company Sales from Industrial Business %, Net Income US$m, Net Capital Expenditure US$m, Strongest Business Region, Business Segment in the Market, HQ, Founded, No. of Employees, IR Contact, Ticker, Website)
Table 8.18 3M Company Total Company Sales 2012-2015 (US$m, AGR %)
Table 8.19 3M Company Sales by Segment of Business 2012-2015 (US$m, AGR %)
Table 8.20 3M Company Cost of Research & Development 2012-2015 (US$m, AGR %)
Table 8.21 3M Company Silicone Products/Services (Segment of Business, Product, and Specifications/Features)
Table 8.22 BASF SE Profile 2016 (CEO, Total Company Sales US$m, Sales in the Market US$m, Share of Company Sales from Chemicals Market %, Net Income US$m, Net Capital Expenditure US$m, Strongest Business Region, Business Segment in the Market, HQ, Founded, No. of Employees, IR Contact, Ticker, Website)
Table 8.23 BASF SE Total Company Sales 2011-2015 (US$m, AGR %)
Table 8.24 BASF SE Sales in Chemicals Business Segment 2012-2015 (US$m, AGR %)
Table 8.25 BASF SE Sales by Segment of Business 2012-2015 (US$m, AGR %)
Table 8.26 BASF SE Cost of Research & Development 2011-2015 (US$m, AGR %)
Table 8.27 BASF SE Silicone Products/Services (Segment of Business, Product, and Specifications/Features)
Table 8.28 Bluestar Silicones International Company Profile 2016 (President, Total Company Sales US$m, Strongest Business Region, Business Segment in the Market, HQ, Founded, No. of Employees and Website)
Table 8.29 Bluestar Silicones International Silicone Products/Services (Segment of Business, Product, and Specifications/Features)
Table 8.30 Kaneka Corporation Company Profile 2015 (CEO, Total Company Sales US$m, Share of Company Sales from Silicones Business Market %, Net Income US$m, Net Capital Expenditure US$m, Strongest Business Region, Business Segment in the Market, HQ, Founded, No. of Employees, IR Contact, Ticker, Website)
Table 8.31 Kaneka Corporation Total Company Sales 2012-2016 (US$m, AGR %)
Table 8.32 Kaneka Corporation Sales by Segment of Business 2011-2015 (US$m, AGR %)
Table 8.33 Kaneka Corporation Cost of Research & Development 2012-2016 (US$m, AGR %)
Table 8.34 Kaneka Corporation Silicone Products/Services (Segment of Business, Product, and Specifications/Features)
Table 8.35 KCC Corporation Company Profile 2016 (CEO, Total Company Sales US$m, Net Income US$m, Net Capital Expenditure US$m, Strongest Business Region, Business Segment in the Market, HQ, Founded, No. of Employees, IR Contact, Ticker, Website)
Table 8.36 KCC Corporation Total Company Sales 2012-2016 (US$m, AGR %)
Table 8.37 KCC Corporation Net Income of Business 2012-2015 (US$m, AGR %)
Table 8.38 KCC Corporation Silicone Products/Services (Segment of Business, Product, and Specifications/Features)
Table 8.39 Momentive Performance Materials Inc. Company Profile 2016 (CEO, Total Company Sales US$m, Share of Company Sales from Silicones Business Market %, Strongest Business Region, Business Segment in the Market, HQ, Founded, No. of Employees, IR Contact, Ticker, Website)
Table 8.40 Momentive Performance Materials Inc. Total Company Sales 2012-2015 (US$m, AGR %)
Table 8.41 Momentive Performance Materials Inc. Sales by Segment of Business 2011-2015 (US$m, AGR %)
Table 8.42 Momentive Performance Materials Inc. Cost of Research & Development 2012-2015 (US$m, AGR %)
Table 8.43 Momentive Performance Materials Inc. Silicone Products/Services (Segment of Business, Product, and Specifications/Features)
Table 8.44 Evonik Industries Profile 2016 (CEO, Total Company Sales US$m, Share of Company Sales from Performance Materials Market %, Net Income/Loss US$m, Net Capital Expenditure US$m, Strongest Business Region, Business Segment in the Market, HQ, Founded, No. of Employees, IR Contact, Ticker, Website)
Table 8.45 Evonik Industries Total Company Sales 2012-2015 (US$m, AGR %)
Table 8.46 Evonik Industries Sales by Segment of Business 2010-2014 (US$m, AGR %)
Table 8.47 Evonik Industries Cost of Research & Development 2010-2014 (US$m, AGR %)
Table 8.48 Evonik Industries Silicone Products/Services (Segment of Business, Product, and Specifications/Features)
Table 8.49 Mergers and Acquisitions, Partnership/Joint Venture/Collaboration
Table 8.50 Investment and Expansions
Table 8.51 New Product Launches
Table 9.1 Global Silicones Consumption Forecast Summary 2017, 2022, 2027 (Kilotons, CAGR %)
Table 9.2 Global Silicones Consumption Application Forecast Summary 2017, 2022, 2027 (Kilotons, CAGR %)
Table 9.3 Global Silicones Market Regional Forecast Summary 2017, 2022, 2027 (US$m, CAGR %)
Table 9.4 Global Silicones Market by Type Forecast Summary 2017, 2022, 2027 (US$m, CAGR %)
List of Figures
Figure 1.1 Example of Silicone Market by Regional Market Share Forecast 2017, 2022, 2027 (% Share)
Figure 1.2 Example of National vs Global Silicone Market CAGR Forecast 2017-2027, 2017-2022, 2022-2027 (CAGR %)
Figure 1.3 Example of National Silicone Market by Submarket Forecast 2017-2027 (US$m, AGR %)
Figure 2.1 Global Silicone Market Segmentation Overview
Figure 2.2 Properties of Silicone Fluids
Figure 2.3 Silicone Resins Applications Overview
Figure 2.4 Medical & Personal Care Application by Types Overview
Figure 3.1 Global Silicones Market Forecast 2017-2027 (US$m, AGR %)
Figure 3.2 Price Analysis of Silicone (2017, 2022, and 2027)
Figure 3.3 Silicones Market Life Cycle Analysis, By Region
Figure 4.1 Global Silicones Application Market AGR Forecast 2017-2027 (AGR %)
Figure 4.2 Global Silicones Application Market Forecast 2017-2027 (US$m, Global AGR %)
Figure 4.3 Global Silicones Application Consumption AGR Forecast 2017-2027 (AGR %)
Figure 4.4 Global Silicones Application Consumption Forecast 2017-2027 (Kilotons, Global AGR %)
Figure 4.5 Global Silicones Application Share Sales Forecast 2017 (% Share)
Figure 4.6 Global Silicones Application Share Sales Forecast 2022 (% Share)
Figure 4.7 Global Silicones Application Share Sales Forecast 2027 (% Share)
Figure 4.8 Global Silicones Chemicals Application by Region AGR Sales Forecast 2017-2027 (AGR %)
Figure 4.9 Global Silicones Chemicals Application by Region Consumption AGR Forecast 2017-2027 (AGR %)
Figure 4.10 Global Market Silicones Chemicals Application Forecast by Region 2017-2027 (US$m, Global AGR %)
Figure 4.11 Global Silicone Medical & Personal Care Application by Region Market AGR Sales Forecast 2017-2027 (AGR %)
Figure 4.12 Global Silicone Medical & Personal Care Application by Region Consumption AGR Forecast 2017-2027 (AGR %)
Figure 4.13 Global Market Silicone Medical & Personal Care Application Forecast by Region Market 2017-2027 (US$m, Global AGR %)
Figure 4.14 Global Silicone Automotive & Transportation Application by Region Market AGR Sales Forecast 2017-2027 (AGR %)
Figure 4.15 Global Silicone Automotive & Transportation Application by Region Consumption AGR Forecast 2017-2027 (AGR %)
Figure 4.16 Global Market Silicone Automotive & Transportation Application Forecast by Region Market 2017-2027 (US$m, Global AGR %)
Figure 4.17 Global Silicone Building & Construction Application by Region Market AGR Sales Forecast 2017-2027 (AGR %)
Figure 4.18 Global Silicone Building & Construction Application by Region Consumption AGR Forecast 2017-2027 (AGR %)
Figure 4.19 Global Market Silicone Building & Construction Application Forecast by Region Market 2017-2027 (US$m, Global AGR %)
Figure 4.20 Global Silicone Electrical & Electronics Application by Region Market AGR Sales Forecast 2017-2027 (AGR %)
Figure 4.21 Global Silicone Electrical & Electronics Application by Region Consumption AGR Forecast 2017-2027 (AGR %)
Figure 4.22 Global Market Silicone Electrical & Electronics Application Forecast by Region Market 2017-2027 (US$m, Global AGR %)
Figure 4.23 Global Silicone Plastics Application by Region Market AGR Sales Forecast 2017-2027 (AGR %)
Figure 4.24 Global Silicone Plastics Application by Region Consumption AGR Forecast 2017-2027 (AGR %)
Figure 4.25 Global Market Silicone Plastics Application Forecast by Region Market 2017-2027 (US$m, Global AGR %)
Figure 4.26 Global Silicone Textiles Application by Region Market AGR Sales Forecast 2017-2027 (AGR %)
Figure 4.27 Global Silicone Textiles Application by Region Consumption AGR Forecast 2017-2027 (AGR %)
Figure 4.28 Global Silicone Textiles Application Forecast by Region Market 2017-2027 (US$m, Global AGR %)
Figure 4.29 Global Silicone Others Application by Region Market AGR Sales Forecast 2017-2027 (AGR %)
Figure 4.30 Global Silicone Others Application by Region Consumption AGR Forecast 2017-2027 (AGR %)
Figure 4.31 Global Market Silicone Others Application Forecast by Region Market 2017-2027 (US$m, Global AGR %)
Figure 5.1 Global Silicone Types Market Forecast 2017-2027 (US$mn, Global AGR %)
Figure 5.2 Global Silicone Types Consumption Forecast 2017-2027 (Kilotons, Global AGR %)
Figure 5.3 Global Silicone Types Share Sales Forecast 2017 (% Share)
Figure 5.4 Global Silicone Types Share Sales Forecast 2022 (% Share)
Figure 5.5 Global Silicone Types Share Sales Forecast 2027 (% Share)
Figure 5.6 Global Silicone Elastomers by Region Market AGR Sales Forecast 2017-2027 (AGR %)
Figure 5.7 Global Silicone Elastomers by Region Consumption AGR Forecast 2017-2027 (AGR %)
Figure 5.8 Global Market Silicone Elastomers Forecast by Region Market 2017-2027 (US$mn, Global AGR %)
Figure 5.9 Global Silicone Fluids by Region Market AGR Sales Forecast 2017-2027 (AGR %)
Figure 5.10 Global Silicone Fluids by Region Consumption AGR Forecast 2017-2027 (AGR %)
Figure 5.11 Global Market Silicone Fluids Forecast by Region Market 2017-2027 (US$mn, Global AGR %)
Figure 5.12 Global Silicone Resins by Region Market AGR Sales Forecast 2017-2027 (AGR %)
Figure 5.13 Global Silicone Resins by Region Consumption AGR Forecast 2017-2027 (AGR %)
Figure 5.14 Global Market Silicone Resins Forecast by Region Market 2017-2027 (US$mn, Global AGR %)
Figure 5.15 Global Silicone Gels by Region Market AGR Sales Forecast 2017-2027 (AGR %)
Figure 5.16 Global Silicone Gels by Region Consumption AGR Forecast 2017-2027 (AGR %)
Figure 5.17 Global Market Silicone Gels Forecast by Region Market 2017-2027 (US$mn, Global AGR %)
Figure 5.18 Global Silicone Others by Region Market AGR Sales Forecast 2017-2027 (AGR %)
Figure 5.19 Global Silicone Others by Region Consumption AGR Forecast 2017-2027 (AGR %)
Figure 5.20 Global Market Silicone Others Forecast by Region Market 2017-2027 (US$mn, Global AGR %)
Figure 6.1 Leading Regional Silicones Market by Region AGR Sales Forecast 2017-2027 (AGR %)
Figure 6.2 Leading Regional Silicones Market by Region AGR Consumption Forecast 2017-2027 (AGR %)
Figure 6.3 Global Silicone Regional Share Sales Forecast 2017 (% Share)
Figure 6.4 Global Silicone Applications Share Sales Forecast 2022 (% Share)
Figure 6.5 Global Silicone Applications Share Sales Forecast 2027 (% Share)
Figure 6.6 Global Silicone Regional Share Consumption Forecast 2017 (% Share)
Figure 6.7 Global Silicone Regional Share Consumption Forecast 2022 (% Share)
Figure 6.8 Global Silicone Regional Share Consumption Forecast 2027 (% Share)
Figure 6.9 Global Market Silicone Sales Forecast by Region 2017-2027 (US$mn, Global AGR %)
Figure 6.10 Global Market Silicone Consumption Forecast by Region 2017-2027 (Kilotons, Global AGR %)
Figure 6.11 North America Silicones Market by Types AGR Sales Forecast 2017-2027 (AGR %)
Figure 6.12 North America Silicones Market by Types AGR Consumption Forecast 2017-2027 (AGR %)
Figure 6.13 North America Silicones Market by Application AGR Sales Forecast 2017-2027 (AGR %)
Figure 6.14 North America Silicones Market by Application AGR Consumption Forecast 2017-2027 (AGR %)
Figure 6.15 North America Market Share by Country Forecast 2017, 2022, 2027 (% Share)
Figure 6.16 Asia-Pacific Silicones Market by Types AGR Sales Forecast 2017-2027 (AGR %)
Figure 6.17 Asia-Pacific Silicones Market by Application AGR Consumption Forecast 2017-2027 (AGR %)
Figure 6.18 Asia-Pacific Silicones Market by Application AGR Sales Forecast 2017-2027 (AGR %)
Figure 6.19 Asia-Pacific Silicones Market by Application AGR Consumption Forecast 2017-2027 (AGR %)
Figure 6.20 Asia-Pacific Market Share Forecast 2017, 2022, 2027 (% Share)
Figure 6.21 Europe Silicones Market by Types AGR Sales Forecast 2017-2027 (AGR %)
Figure 6.22 Europe Silicones Market by Types AGR Consumption Forecast 2017-2027 (AGR %)
Figure 6.23 Europe Silicones Market by Application AGR Sales Forecast 2017-2027 (AGR %)
Figure 6.24 Europe Silicones Market by Application AGR Consumption Forecast 2017-2027 (AGR %)
Figure 6.25 Europe Market Share Forecast 2017, 2022, 2027 (% Share)
Figure 6.26 Middle East Silicones Market by Types AGR Sales Forecast 2017-2027 (AGR %)
Figure 6.27 Middle East Silicones Market by Types AGR Consumption Forecast 2017-2027 (AGR %)
Figure 6.28 Middle East Silicones Market by Application AGR Consumption Forecast 2017-2027 (AGR %)
Figure 6.29 Middle East Silicones Market by Application AGR Consumption Forecast 2017-2027 (AGR %)
Figure 6.30 Middle East Market Share Forecast 2017, 2022, 2027 (% Share)
Figure 6.31 Africa Silicones Market by Types AGR Sales Forecast 2017-2027 (AGR %)
Figure 6.32 Africa Silicones Market by Types AGR Consumption Forecast 2017-2027 (AGR %)
Figure 6.33 Africa Silicones Market by Application AGR Sales Forecast 2017-2027 (AGR %)
Figure 6.34 Africa Silicones Market by Application AGR Consumption Forecast 2017-2027 (AGR %)
Figure 6.35 Africa Market Share Forecast 2017, 2022, 2027 (% Share)
Figure 6.36 Latin America Silicones Market by Types AGR Sales Forecast 2017-2027 (AGR %)
Figure 6.37 Latin America Silicones Market by Types AGR Consumption Forecast 2017-2027 (AGR %)
Figure 6.38 Latin America Silicones Market by Application AGR Sales Forecast 2017-2027 (AGR %)
Figure 6.39 Latin America Silicones Market by Application AGR Consumption Forecast 2017-2027 (AGR %)
Figure 6.40 Latin America Market Share Forecast 2017, 2022, 2027 (% Share)
Figure 8.1 Market Share Analysis of Silicone Manufacturers 2017
Figure 8.2 Shin-Etsu Chemical Co., Ltd. Total Company Sales 2012-2016 (US$m, AGR %)
Figure 8.3 Shin-Etsu Chemical Co., Ltd. Sales by Segment of Business 2012-2016 (US$m)
Figure 8.4 Shin-Etsu Chemical Co., Ltd. Sales AGR by Segment of Business 2012-2016 (AGR %)
Figure 8.5 Shin-Etsu Chemical Co., Ltd. Cost of Research & Development 2012-2016 (US$m, AGR %)
Figure 8.6 Shin-Etsu Chemical Co., Ltd. Sales Share by Geographical Location 2016 (Sales %)
Figure 8.7 Shin-Etsu Chemical Co., Ltd. Primary Market Competitors
Figure 8.8 Dow Corning Corporation Total Company Sales 2012-2015 (US$m, AGR %)
Figure 8.9 Dow Corning Corporation Sales by Segment of Business 2012-2015 (US$m, Total Company Sales AGR %)
Figure 8.10 Dow Corning Corporation Sales AGR by Segment of Business 2012-2015 (AGR %)
Figure 8.11 Dow Corning Corporation Cost of Research & Development 2012-2015 (US$m, AGR %)
Figure 8.12 Dow Corning Corporation Sales Share by Geographical Location 2015 (Sales %)
Figure 8.13 Dow Corning Corporation Primary Market Competitors
Figure 8.14 Wacker Chemie AG Total Company Sales 2012-2015 (US$m, AGR %)
Figure 8.15 Wacker Chemie AG Sales by Segment of Business 2012-2015 (US$m, Total Company Sales AGR %)
Figure 8.16 Wacker Chemie AG Sales AGR by Segment of Business 2012-2015 (AGR %)
Figure 8.17 Wacker Chemie AG Cost of Research & Development 2012-2015 (US$m, AGR %)
Figure 8.18 Wacker Chemie AG Sales Share by Geographical Location 2015 (Sales %)
Figure 8.19 Wacker Chemie AG Primary Market Competitors
Figure 8.20 3M Company Total Company Sales 2012-2015 (US$m, AGR %)
Figure 8.21 3M Company Sales by Segment of Business 2012-2015 (US$m, Total Company Sales AGR %)
Figure 8.22 3M Company Sales AGR by Segment of Business 2012-2015 (AGR %)
Figure 8.23 3M Company Cost of Research & Development 2012-2015 (US$m, AGR %)
Figure 8.24 3M Company Sales Share by Geographical Location 2015 (Sales %)
Figure 8.25 3M Company Primary Market Competitors
Figure 8.26 BASF SE Total Company Sales 2012-2015 (US$m, AGR %)
Figure 8.27 BASF SE Sales in Chemicals Business Segment 2012-2015(US$m, AGR %)
Figure 8.28 BASF SE Sales by Segment of Business 2012-2015 (US$m, Total Company Sales AGR %)
Figure 8.29 BASF SE Sales AGR by Segment of Business 2012-2015 (AGR %)
Figure 8.30 BASF SE Cost of Research & Development 2011-2015 (US$m, AGR %)
Figure 8.31 BASF SE Sales Share by Geographical Location 2015
Figure 8.32 BASF SE Primary Market Competitors
Figure 8.33 Bluestar Silicones International Primary Market Competitors
Figure 8.34 Kaneka Corporation Total Company Sales 2012-2016 (US$m, AGR %)
Figure 8.35 Kaneka Corporation Sales by Segment of Business 2012-2016 (US$m, Total Company Sales AGR %)
Figure 8.36 Kaneka Corporation Sales AGR by Segment of Business 2012-2016 (AGR %)
Figure 8.37 Kaneka Corporation Cost of Research & Development 2012-2016 (US$m, AGR %)
Figure 8.38 Kaneka Corporation Sales Share by Geographical Location 2016 (Sales %)
Figure 8.39 Kaneka Corporation Primary Market Competitors
Figure 8.40 KCC Corporation Total Company Sales 2012-2015 (US$m, AGR %)
Figure 8.41 KCC Corporation Net Income of Business 2012-2015 (US$m, Net Income AGR %)
Figure 8.42 KCC Corporation Primary Market Competitors
Figure 8.43 Momentive Performance Materials Inc. Total Company Sales 2012-2015 (US$m, AGR %)
Figure 8.44 Momentive Performance Materials Inc. Sales by Segment of Business 2012-2015 (US$m, Total Company Sales AGR %)
Figure 8.45 Momentive Performance Materials Inc. Sales AGR by Segment of Business 2012-2016 (AGR %)
Figure 8.46 Momentive Performance Materials Inc. Cost of Research & Development 2012-2015 (US$m, AGR %)
Figure 8.47 Momentive Performance Materials Inc. Geographical Sales, 2015
Figure 8.48 Momentive Performance Materials Inc. Primary Market Competitors
Figure 8.49 Evonik Industries Total Company Sales 2012-2015 (US$m, AGR %)
Figure 8.50 Evonik Industries Sales by Segment of Business 2010-2014 (US$m, Total Company Sales AGR %)
Figure 8.51 Evonik Industries Sales AGR by Segment of Business 2011-2014 (AGR %)
Figure 8.52 Evonik Industries Cost of Research & Development 2010-2014 (US$m, AGR %)
Figure 8.53 Evonik Industries Sales by Geographical Location 2015 (US$m, Total Company Sales AGR %)
Figure 8.54 Evonik Industries Primary Market Competitors
Figure 9.1 Drivers and Restraints of the Global Silicones Market 2017-2027
AB Specialty Silicones
ACC Silicones
Actavis plc
Aica Kogyo Co., Ltd.
Allergan
Amber Chemical
Applied Silicone Corporation
ARAKAWA CHEMICAL INDUSTRIES, LTD.
Arkema SA
Bluestar Silicones
Bodo Moller Chemie GmbH
Bostik
BRB International BV
Britacel Silicones Ltd
CEMEDINE CO., LTD.
China National Bluestar Group Company Limited
Clariant International Limited
CRI-SIL Silicone Technologies LLC
CSL Silicones Inc.
Dongyue Group Limited
Dow Corning Corporation
DYFLEX Co.,Ltd
Elkay Silicones
Elkem
Ellsworth Adhesives
Emerald Performance Materials LLC
Evonik Industries AG
GB Silicone Technology
Gelest Inc.
Graf & Co. GmbH
Handy & Harman Limited
Henkel AG & Co.
Henkel AG & Company KGaA
Hungarian Silicones
ICM Products Inc.
Jiangsu Hongda New Material Company Limited
Jiangxi Xing Huo Organic Silicon Factory
Johnson & Johnson
Kaneka Corporation
KCC Corporation
Kemira Oyj
Lubrizol
Master Bond Inc.
McCoy Group
Mentor Worldwide
Milliken & Company
Milliken Chemical
Momentive Performance Materials Inc.
MVQ Silicones GmbH
North Cost Medical Inc.
Novaguard Solutions
NuSil
NuSil Technology LLC
Palmo Industrial Silicones Pvt. Ltd.
Provista SA de CV
Resil Chemicals
Rogers Corporation
Shin-Etsu Chemical Company Limited
Silchem Incorporated
Silex Silicones Ltd
Silicone Solutions
Sil-Mid Limited
Siltech Corporation
SIMTEC Silicone
SiSiB Silicones
Specialty Silicone Products Inc.
Stockwell Elastomerics Inc
Supreme Silicones
Tilement Corp.
Toko Sangyo Co., Ltd.
Total SA
Wacker Chemie AG
Winroy Industrial Polymers Ltd
Zhejiang Xinan Chemica Industrial Group
Download sample pages
Complete the form below to download your free sample pages for Silicone Market 2017-2027Download sample pages
Complete the form below to download your free sample pages for Silicone Market 2017-2027Do you have any custom requirements we can help you with?
Any specific country, geo region, market segment or specific company information?
Email us today, we can discuss your needs and see how we can help: jamie.roberts@visiongain.com
Would you like a free report overview of the report of your choice?
If so, please drop an email to Jamie Roberts stating your chosen report title to jamie.roberts@visiongain.com
Visiongain chemicals reports are compiled using a broad and rich mixture of both primary and secondary information to produce an overall industry outlook. In order to provide our clients with the best product possible product, we do not rely on any one single source of information. Visiongain analysts reach out to market-leading vendors and automotive industry experts but also review a wealth of financial data and product information from a vast range of sources. To find out more about our reports methodology please email jamie.roberts@visiongain.com
Would you like to get the latest Visiongain chemicals reports catalogue?
What are the dynamic growth sectors? where are the regional business opportunities?
Which technologies will prevail and who are the leading companies succeeding in these sectors and why?
If you want definitive answers to business critical questions, discover Visiongain’s full range of business intelligence reports.
If so, please email Jamie Roberts on jamie.roberts@visiongain.com or call her today on +44 207 336 6100
Latest Chemicals news
Visiongain Publishes Industrial Coatings Market Report 2023-2033
The global Industrial Coatings market was valued at US$93 billion in 2022 and is projected to grow at a CAGR of 5.2% during the forecast period 2023-2033.
14 August 2023
Visiongain Publishes Water Treatment Chemicals Market Report 2023-2033
The global Water Treatment Chemicals market is projected to grow at a CAGR of 3.9% by 2033
21 July 2023
Visiongain Publishes Propylene Glycol Market Report 2023-2033
The global Propylene Glycol market was valued at US$4,931.7 million in 2022 and is projected to grow at a CAGR of 4.1% during the forecast period 2023-2033.
14 June 2023
Visiongain Publishes Optical Coatings Market Report 2023-2033
The global Optical Coatings market was valued at US$13,564 million in 2022 and is projected to grow at a CAGR of % during the forecast period 2023-2033.
17 April 2023


