This latest report by business intelligence provider Visiongain assesses that Sand Control Systems Market spending will reach USD 5.1 billion by 2020. Increasing exploration operations are expected during the forecast period to fuel the sand control system industry. Training sand monitoring is always one of the manufacturing engineers ‘ primary issues. There are various ways to stop the manufacture of sand. Depending on distinct reservoir parameters and political and financial circumstances, choosing a technique for stopping building sand manufacturing. Economic and political circumstances are sometimes more efficient than reservoir parameters in choosing an optimum. Often, concurrent inquiry with reservoir parameters of political and financial circumstances has distinct outcomes with what is anticipated.
Increasing exploration activity globally is anticipated to push the sand control industry over the next six years owing to strong supply for crude oil. The supply for crude oil is rising due to increased supply for energy worldwide. Sand monitoring scheme stops the motion of tank wind into the wellboard and increases its efficiency. With effective results of greater flow rate and manufacturing in oil extraction operations, this scheme has achieved wide recognition since the last century. Deployment of the sand control system on oil fields has resulted in the suppression of downhole cavities that result in process inefficiencies and premature well maturation. This setup of the scheme decreases the total expense of exploration & manufacturing and also enables to delay the carrying and attrition of the machinery used. Offshore sand control system is anticipated to experience the greatest development as it decreases well errors due to concentration of sand in wellbores, particularly in profound and ultra-deep basins. Due to big capability onshore reservoirs, onshore oil extraction areas represented the biggest market share in 2019.
It is therefore critical that you have your timescales correct and your forecasting plans ready. This report will ensure that you do. Visiongain’s report will ensure that you keep informed and ahead of your competitors. Gain that competitive advantage.
One of the main components of the oil & gas manufacturing scheme is sand monitoring devices. It helps to eliminate the wellbore sand manufacturing. In the closure phase, the scheme performs a significant part and recovers the well’s efficiency and productivity. Nowadays, most of the world’s unconsolidated sandstone oil and gas wells generate mud with reservoir liquids. Problems connected with the manufacturing of sand include plugging of perforation pipes, concentration of soil separators, sanding of manufacturing intervals, and prospective erosion collapse of downhole and ground machinery. These issues can present hazards to the economy and safety.
There are several methods available to minimize the output of sand from springs. The decisions vary from easy modifications to costly completions in working methods, such as strengthening of sand or gravel filling. The chosen technique of sand monitoring relies on circumstances specific to the site, working methods and financial factors.
The industry for sand monitoring devices is expanding at a large rate and over the forecast period is anticipated to proceed to expand at the same rate. Because of fluctuating crude oil prices, the worldwide industry for sand monitoring devices is getting traction from significant oil producers to boost effective oilfield manufacturing. According to Visiongain analysis, the global sand control systems market is estimated to expand at a CAGR of 4.7% during the estimated period (2020-2030).
The industry was segmented across North America, Europe, Asia Pacific, and the rest of the world on the grounds of the region. In 2019, Asia Pacific dominates the worldwide industry for sand monitoring devices. Increasing population and fast manufacturing growth lead to higher requirements for energy, which drive oil and gas exploration operations. Exploration of oil and gas in nations like Malaysia, Australia, Indonesia, and Myanmar is well ongoing. This fuels the industry for sand monitoring devices.
Another prominent region for sand regulate technologies is Middle East & Africa. Nigeria, Saudi Arabia and UAE, are the biggest oil and gas exporters. Growing investments in the region by various companies such as Saudi Aramco, a national petroleum & natural gas firm in Saudi Arabia, are driving the market.
Read on to discover how you can exploit the future business opportunities emerging in this sector. Visiongain’s new study tells you and tells you NOW. The 215-pages report provides clear, detailed insight into the global Sand Control Systems market. Discover the key drivers and challenges affecting the market.
By ordering and reading our brand-new report today, you stay better informed and ready to act.
Report Scope
The report delivers considerable added value by revealing:
77 tables, charts and graphs are analyzing and revealing the growth prospects and outlook for the Sand Control Systems market.
Global Sand Control Systems market forecasts and analysis from 2020-2030.
Sand Control Systems market provides revenue estimates, forecasts and analysis from 2020-2030 for Sand Control Systems submarkets:
Forecasts and analysis of Sand Control Systems market by Techniques between 2020-2030
Gravel Pack Market, 2020-2030
Frac Pack Market, 2020-2030
Sand Screens Market, 2020-2030
Inflow Control Devices Market, 2020-2030
Others Market, 2020-2030
Forecasts and analysis of Sand Control Systems market by Type between 2020-2030
Open Hole Market, 2020-2030
Cased Hole Market, 2020-2030
Other Market, 2020-2030
Forecasts and analysis of Sand Control Systems market by Sand Control Method between 2020-2030
Passive Sand Control Market, 2020-2030
Active Sand Control Market, 2020-2030
Other Market, 2020-2030
Forecasts and analysis of Sand Control Systems market by Deployment between 2020-2030
Onshore Market, 2020-2030
Offshore Market, 2020-2030
Regional Sand Control Systems market forecasts from 2020-2030 with drivers and restraints for the countries including:
Geographic Breakdown
Focused regional forecasts and analysis explore the future opportunities:
North America Market, 2020-2030
US Market, 2020-2030
Canada Market, 2020-2030
Europe Market, 2020-2030
The UK Market, 2020-2030
Germany Market, 2020-2030
France Market, 2020-2030
Italy Market, 2020-2030
Spain Market, 2020-2030
Rest of Europe Market, 2020-2030
Asia-Pacific Market, 2020-2030
China Market, 2020-2030
India Market, 2020-2030
Japan Market, 2020-2030
Australia & New Zealand Market, 2020-2030
Rest of Asia-Pacific Market, 2020-2030
LAMEA Market, 2020-2030
Latin America Market, 2020-2030
Middle East Market, 2020-2030
Africa Market, 2020-2030

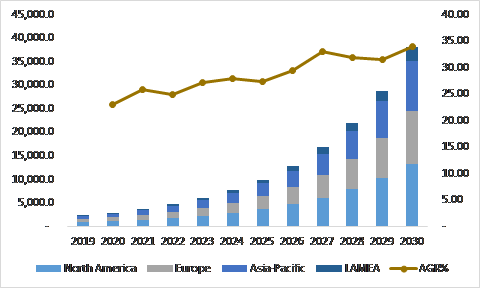
Figure:- Sand Control Systems Market Size and Forecast by Region, 2020-2030
Increasing digging operations worldwide are probable to drive market growth in the sand control system over the timeframe prediction. For example, over the last 1 month (July 2016), North America, led by the U.S. and Canada, has witnessed a significant increase in rig counts. Increasing well-finished operation due to strong supply for crude oil from the United States, Mexico and Canada. Offshore oil & gas deposits are expected to be discovered in nations like Tanzania and Mozambique to fuel sector development. In addition, rising supply for oil and gas from emerging nations like India and China could increase the worldwide market for sand monitoring systems from 2020 to 2030.
Because of growing building operations in 2019, Asia Pacific was the biggest sand control system industry. Increasing population in emerging countries improved energy demand and hence enhanced imports of crude oil. India, China, Japan, and South Korea have exported the region’s biggest quantity of crude oil, offering enormous possibilities for business members in sand command. This scheme was built by major respondents in crude oil extraction, which improved effectiveness and avoided harm to machinery. Because of increasing exploration operations in Brazil, Venezuela, and Argentina, South America is anticipated to see important development. At the start of the digging, major market players mounted the scheme on offshore oil fields to preserve optimum effectiveness. Chances are expected to be created by advancing technology in the scheme according to the sort of earth crust in different areas.
North American drilling operations have risen in the midst of rising oil & gas rates. In the first week of May 2018, the North American rig count reached 1118. The US paid for 1032 rigs while 86 rigs and 19 rigs were working simultaneously in Canada and the Gulf of Mexico. The number rose by 114 out of the 974 numbers reported in May 2017’s first week. This rise in exploration operations has developed optimism in the North American Oil & Gas industry and during the prediction era will assist the area dominate the industry in wind monitoring technologies.
Company profiles for the leading Sand Control Systems companies
Company Profiles of Leading Players
Superior Energy
RGL Reservoir Management Inc.
Welltec A/S
Baker Hughes – a GE Co.
Schlumberger Ltd.
Weatherford International Ltd.
National Oilwell Varco Inc.
Halliburton Company
Dialog
Interwell
Mitchell
Other Key Players in the market
Oil States International
Packers Plus
Tendeka
Variprem
Hebei Shengkai
GOES GmbH
China Oilfield Services Limited (COSL)
MTW Heavy type Trapezium Mill
OASIS OIL TOOLS CO., LTD.
ARC Specialties
Delta Screens
Foshan Keenhai Metal Products Co., Limited
Luoyang Longzhong Heavy Machinery Co., Ltd.
Jinan Junda Industrial Technology Co., Ltd.
Conclusions and recommendations which will aid decision-making
How will you benefit from this report?
Keep your knowledge base up to speed. Don’t get left behind
Reinforce your strategic decision-making with definitive and reliable market data
Learn how to exploit new technological trends
Realise your company’s full potential within the market
Understand the competitive landscape and identify potential new business opportunities & partnerships
Who should read this report?
Anyone with involvement in the Sand Control Systems
Energy operators
Engineering contractors
Investment managers
Arbitrage companies and divisions
Sand Control System price reporting companies
Sand Control System company managers
Sand Control System consultants
Sand Control System company executives and analysts
Heads of strategic development
Business development managers
Marketing managers
Market analysts,
Technologists
Suppliers
Investors
Banks
Government agencies
Visiongain’s study is intended for anyone requiring commercial analyses for the Sand Control Systems market and leading companies. You find data, trends and predictions.
Buy our report today the Sand Control Systems Market Forecast 2020-2030. Avoid missing out by staying informed – get our report now.
Visiongain is a trading partner with the US Federal Government
CCR Ref number: KD4R6
Do you have any custom requirements we can help you with? Any need for specific country, geo region, market segment or specific company information? Contact us today, we can discuss your needs and see how we can help sara.peerun@visiongain.com
Report Overview
1.1 Global Sand Control Systems Market
1.2 Global Sand Control Systems Market Overview
1.3 Global Sand Control Systems Market Segmentation
1.4 The Emergence of Sand Control Systems in the Industry
1.5 Why You Should Read This Report
1.6 How This Report Delivers
1.7 Key Questions Answered by This Analytical Report
1.8 Methodology
1.8.1 Secondary Research
1.8.2 Market Evaluation & Forecasting Methodology
1.9 Frequently Asked Questions (FAQ)
1.10 Associated Visiongain Reports
1.11 About Visiongain
2. Introduction to Sand Control Systems Market
2.1 Market Definition
2.2 Industry Outlook
2.3 Value Chain Analysis
2.4 Industry Structure
2.5 Current Status & Trends
2.6 Demand & Supply Analysis
2.7 Trade Analysis
2.8 Price Trend Analysis
2.9 Methods Of Sand Production Control
2.9.1 Resin-Coated Sand
2.9.2 Stand Alone Screens
2.9.3 Expandable Screens
2.9.4 Cased Hole Gravel Pack
2.9.5 Open Hole Gravel Pack
2.9.6 Frac Pack
3. Global Sand Control Systems Market Analysis
3.1 PEST Analysis of the Sand Control Systems Market
3.2 Expert Opinion
3.2.1 Primary Correspondents
3.3 Market Outlook
3.4 Drivers & Restraints
3.5 Dominant Region/Country
3.6 Market Scenario
3.7 Overall Growth Rate, Globally
3.8 SWOT Analysis of the Sand Control Systems Market
3.8.1 Strengths
3.8.2 Weaknesses
3.8.3 Opportunities
3.8.4 Threats
3.9 Porter’s Five Forces Analysis
3.9.1 Competitive Rivalry
3.9.2 Supplier Power
3.9.3 Buyer Power
3.9.4 Threat of Substitute
3..9.5 Threat of New Entrant
3.10 Fundaments
3.10.1 Causes Of Sand Production
3.10.2 Consequences Of Sand Production
3.10.3 Rock Strength And Sand Production Prediction
3.10.4 Characterization And Identification Of Friable Formations
3.10.5 Techniques For Monitoring And Detecting Sand Production
3.10.6 Mitigating Sand Production Without Screens
4. Sand Control Systems: Global Market Analysis by Segments
4.1 Global Sand Control Systems Market Forecast, by Techniques 2020-2030
4.1.1 Techniques Overview
4.1.2 Gravel Pack Market, 2020-2030
4.1.3 Frac Pack Market, 2020-2030
4.1.4 Sand Screens Market, 2020-2030
4.1.5 Inflow Control Devices Market, 2020-2030
4.1.6 Others Market, 2020-2030
4.2 Global Sand Control Systems Market Forecast, by Type 2020-2030
4.2.1 Type Overview
4.2.2 Open Hole Market, 2020-2030
4.2.3 Cased Hole Market, 2020-2030
4.2.4 Other Market, 2020-2030
4.3 Global Sand Control Systems Market Forecast, by Sand Control Method 2020-2030
4.3.1 Sand Control Method Overview
4.3.2 Passive Sand Control Market, 2020-2030
4.3.3 Active Sand Control Market, 2020-2030
4.3.4 Other Market, 2020-2030
4.4 Global Sand Control Systems Market Forecast, by Deployment 2020-2030
4.4.1 Deployment Overview
4.4.2 Onshore Market, 2020-2030
4.4.3 Offshore Market, 2020-2030
5. Leading Regions in Sand Control Systems Market 2020-2030
5.1 Regional Overview
5.1.1 North America
5.1.2 Europe
5.1.3 Asia Pacific
5.1.4 LAMEA
5.1.5 Leading Countries/ Regions
5.2 U.S. Sand Control Systems Market Forecast, 2020-2030
5.2.1 U.S. Sand Control Systems Submarket, By Techniques Forecast 2020-2030
5.2.2 U.S. Sand Control Systems Submarket, By Type Forecast 2020-2030
5.2.3 U.S. Sand Control Systems Submarket, By Sand Control Method Forecast 2020-2030
5.2.4 U.S. Sand Control Systems Submarket, By Deployment Forecast 2020-2030
5.3 Canada Sand Control Systems Market Forecast, 2020-2030
5.3.1 Canada Sand Control Systems Submarket, By Techniques Forecast 2020-2030
5.3.2 Canada Sand Control Systems Submarket, By Type Forecast 2020-2030
5.3.3 Canada Sand Control Systems Submarket, By Sand Control Method Forecast 2020-2030
5.3.4 Canada Sand Control Systems Submarket, By Deployment Forecast 2020-2030
5.4 The UK Sand Control Systems Market Forecast, 2020-2030
5.4.1 The UK Sand Control Systems Submarket, By Techniques Forecast 2020-2030
5.4.2 The UK Sand Control Systems Submarket, By Type Forecast 2020-2030
5.4.3 The UK Sand Control Systems Submarket, By Sand Control Method Forecast 2020-2030
5.4.4 The UK Sand Control Systems Submarket, By Deployment Forecast 2020-2030
5.5 Germany Sand Control Systems Market Forecast, 2020-2030
5.5.1 Germany Sand Control Systems Submarket, By Techniques Forecast 2020-2030
5.5.2 Germany Sand Control Systems Submarket, By Type Forecast 2020-2030
5.5.3 Germany Sand Control Systems Submarket, By Sand Control Method Forecast 2020-2030
5.5.4 Germany Sand Control Systems Submarket, By Deployment Forecast 2020-2030
5.6 France Sand Control Systems Market Forecast, 2020-2030
5.6.1 France Sand Control Systems Submarket, By Techniques Forecast 2020-2030
5.6.2 France Sand Control Systems Submarket, By Type Forecast 2020-2030
5.6.3 France Sand Control Systems Submarket, By Sand Control Method Forecast 2020-2030
5.6.4 France Sand Control Systems Submarket, By Deployment Forecast 2020-2030
5.7 Italy Sand Control Systems Market Forecast, 2020-2030
5.7.1 Italy Sand Control Systems Submarket, By Techniques Forecast 2020-2030
5.7.2 Italy Sand Control Systems Submarket, By Type Forecast 2020-2030
5.7.3 Italy Sand Control Systems Submarket, By Sand Control Method Forecast 2020-2030
5.7.4 Italy Sand Control Systems Submarket, By Deployment Forecast 2020-2030
5.8 Spain Sand Control Systems Market Forecast, 2020-2030
5.8.1 Spain Sand Control Systems Submarket, By Techniques Forecast 2020-2030
5.8.2 Spain Sand Control Systems Submarket, By Type Forecast 2020-2030
5.8.3 Spain Sand Control Systems Submarket, By Sand Control Method Forecast 2020-2030
5.8.4 Spain Sand Control Systems Submarket, By Deployment Forecast 2020-2030
5.9 Rest of Europe Sand Control Systems Market Forecast, 2020-2030
5.9.1 Rest of Europe Sand Control Systems Submarket, By Techniques Forecast 2020-2030
5.9.2 Rest of Europe Sand Control Systems Submarket, By Type Forecast 2020-2030
5.9.3 Rest of Europe Sand Control Systems Submarket, By Sand Control Method Forecast 2020-2030
5.9.4 Rest of Europe Sand Control Systems Submarket, By Deployment Forecast 2020-2030
5.10 China Sand Control Systems Market Forecast, 2020-2030
5.10.1 China Sand Control Systems Submarket, By Techniques Forecast 2020-2030
5.10.2 China Sand Control Systems Submarket, By Type Forecast 2020-2030
5.10.3 China Sand Control Systems Submarket, By Sand Control Method Forecast 2020-2030
5.10.4 China Sand Control Systems Submarket, By Deployment Forecast 2020-2030
5.11 India Sand Control Systems Market Forecast, 2020-2030
5.11.1 India Sand Control Systems Submarket, By Techniques Forecast 2020-2030
5.11.2 India Sand Control Systems Submarket, By Type Forecast 2020-2030
5.11.3 India Sand Control Systems Submarket, By Sand Control Method Forecast 2020-2030
5.11.4 India Sand Control Systems Submarket, By Deployment Forecast 2020-2030
5.12 Japan Sand Control Systems Market Forecast, 2020-2030
5.12.1 Japan Sand Control Systems Submarket, By Techniques Forecast 2020-2030
5.12.2 Japan Sand Control Systems Submarket, By Type Forecast 2020-2030
5.12.3 Japan Sand Control Systems Submarket, By Sand Control Method Forecast 2020-2030
5.12.4 Japan Sand Control Systems Submarket, By Deployment Forecast 2020-2030
5.13 Australia & New Zealand Sand Control Systems Market Forecast, 2020-2030
5.13.1 Australia & New Zealand Sand Control Systems Submarket, By Techniques Forecast 2020-2030
5.13.2 Australia & New Zealand Sand Control Systems Submarket, By Type Forecast 2020-2030
5.13.3 Australia & New Zealand Sand Control Systems Submarket, By Sand Control Method Forecast 2020-2030
5.13.4 Australia & New Zealand Sand Control Systems Submarket, By Deployment Forecast 2020-2030
5.14 Rest of Asia-Pacific Sand Control Systems Market Forecast, 2020-2030
5.14.1 Rest of Asia-Pacific Sand Control Systems Submarket, By Techniques Forecast 2020-2030
5.14.2 Rest of Asia-Pacific Sand Control Systems Submarket, By Type Forecast 2020-2030
5.14.3 Rest of Asia-Pacific Sand Control Systems Submarket, By Sand Control Method Forecast 2020-2030
5.14.4 Rest of Asia-Pacific Sand Control Systems Submarket, By Deployment Forecast 2020-2030
5.15 Latin America Sand Control Systems Market Forecast, 2020-2030
5.15.1 Latin America Sand Control Systems Submarket, By Techniques Forecast 2020-2030
5.15.2 Latin America Sand Control Systems Submarket, By Type Forecast 2020-2030
5.15.3 Latin America Sand Control Systems Submarket, By Sand Control Method Forecast 2020-2030
5.15.4 Latin America Sand Control Systems Submarket, By Deployment Forecast 2020-2030
5.16 Middle East Sand Control Systems Market Forecast, 2020-2030
5.16.1 Middle East Sand Control Systems Submarket, By Techniques Forecast 2020-2030
5.16.2 Middle East Sand Control Systems Submarket, By Type Forecast 2020-2030
5.16.3 Middle East Sand Control Systems Submarket, By Sand Control Method Forecast 2020-2030
5.16.4 Middle East Sand Control Systems Submarket, By Deployment Forecast 2020-2030
5.17 Africa Sand Control Systems Market Forecast, 2020-2030
5.17.1 Africa Sand Control Systems Submarket, By Techniques Forecast 2020-2030
5.17.2 Africa Sand Control Systems Submarket, By Type Forecast 2020-2030
5.17.3 Africa Sand Control Systems Submarket, By Sand Control Method Forecast 2020-2030
5.17.4 Africa Sand Control Systems Submarket, By Deployment Forecast 2020-2030
Superior Energy
RGL Reservoir Management Inc.
Welltec A/S
Baker Hughes - a GE Co.
Schlumberger Ltd.
Weatherford International Ltd.
National Oilwell Varco Inc.
Halliburton Company
Dialog
Interwell
Mitchell
7. Leading Companies in The Sand Control Systems Market
7.1 Superior Energy
7.1.1 Superior Energy Products and Services
7.1.2 Analysis of Superior Energy within the Sand Control Systems Market
7.1.3 Superior Energy M&A Activity
7.1.4 Future Outlook for Superior Energy
7.1.5 Superior Energy Projects
7.2 RGL Reservoir Management Inc.
7.2.1 RGL Reservoir Management Inc. Products and Services
7.2.2 Analysis of RGL Reservoir Management Inc. within the Sand Control Systems Market
7.2.3 RGL Reservoir Management Inc. M&A Activity
7.2.4 Future Outlook for RGL Reservoir Management Inc.
7.2.5 RGL Reservoir Management Inc. Projects
7.3 Welltec A/S
7.3.1 Welltec A/S Products and Services
7.3.2 Analysis of Welltec A/S within the Sand Control Systems Market
7.3.3 Welltec A/S M&A Activity
7.3.4 Future Outlook for Welltec A/S
7.3.5 Welltec A/S Projects
7.4 Baker Hughes - a GE Co.
7.4.1 Baker Hughes - a GE Co. Products and Services
7.4.2 Analysis of Baker Hughes - a GE Co. within the Sand Control Systems Market
7.4.3 Baker Hughes - a GE Co. M&A Activity
7.4.4 Future Outlook for Baker Hughes - a GE Co.
7.4.5 Baker Hughes - a GE Co. Projects
7.5 Schlumberger Ltd.
7.5.1 Schlumberger Ltd. Products and Services
7.5.2 Analysis of Schlumberger Ltd. within the Sand Control Systems Market
7.5.3 Schlumberger Ltd. M&A Activity
7.5.4 Future Outlook for Schlumberger Ltd.
7.5.5 Schlumberger Ltd. Projects
7.6 Weatherford International Ltd.
7.6.1 Weatherford International Ltd. Products and Services
7.6.2 Analysis of Weatherford International Ltd. within the Sand Control Systems Market
7.6.3 Weatherford International Ltd. M&A Activity
7.6.4 Future Outlook for Weatherford International Ltd.
7.6.5 Weatherford International Ltd. Projects
7.7 National Oilwell Varco Inc.
7.7.1 National Oilwell Varco Inc. Products and Services
7.7.2 Analysis of National Oilwell Varco Inc. within the Sand Control Systems Market
7.7.3 National Oilwell Varco Inc. M&A Activity
7.7.4 Future Outlook for National Oilwell Varco Inc.
7.7.5 National Oilwell Varco Inc. Projects
7.8 Halliburton Company
7.8.1 Halliburton Company Products and Services
7.8.2 Analysis of Halliburton Company within the Sand Control Systems Market
7.8.3 Halliburton Company M&A Activity
7.8.4 Future Outlook for Halliburton Company
7.8.5 Halliburton Company Projects
7.9 Dialog
7.9.1 Dialog Products and Services
7.9.2 Analysis of Dialog within the Sand Control Systems Market
7.9.3 Dialog M&A Activity
7.9.4 Future Outlook for Dialog
7.9.5 Dialog Projects
7.10 Interwell
7.10.1 Interwell Products and Services
7.10.2 Analysis of Interwell within the Sand Control Systems Market
7.10.3 Interwell M&A Activity
7.10.4 Future Outlook for Interwell
7.10.5 Interwell Projects
7.11 Mitchell
7.11.1 Mitchell Products and Services
7.11.2 Analysis of Mitchell within the Sand Control Systems Market
7.11.3 Mitchell M&A Activity
7.11.4 Future Outlook for Mitchell
7.11.5 Mitchell Projects
8. Conclusions and Recommendations
8.1 Global Sand Control Systems Market Outlook
8.2 Recommendations
9. Glossary
Associated Visiongain Reports
Visiongain Report Sales Order Form
Appendix A
About Visiongain
Appendix B
Visiongain Report Evaluation Form
List of Tables
Table 1.0 Key Highlights
Table 3.1 PEST Analysis, Sand Control Systems Market
Table 3.2 SWOT Analysis
Table 4.1 Global Sand Control Systems Market Forecast 2020-2030 ($Bn, AGR %, CAGR %, Cumulative)
Table 4.2 Global Sand Control Systems Submarket, By Techniques Forecast 2020-2030 ($billion, AGR %, Cumulative)
Table 4.3 Global Sand Control Systems Submarket, By Sand Control Method Forecast 2020-2030 ($billion, AGR %, Cumulative)
Table 4.4 Global Sand Control Systems Submarket, By Deployment Forecast 2020-2030 ($billion, AGR %, Cumulative)
Table 5.1 Global Sand Control Systems Market, by Country/Region Forecast 2020-2030 ($billion, AGR %, Cumulative)
Table 5.2 Global Sand Control Systems Market, by Country/Region Forecast 2020-2030 ($billion, AGR %, Cumulative)
Table 5.3 Canada Sand Control Systems Market Forecast 2020-2030 ($billion, , AGR %, CAGR %, Cumulative)
Table 5.4 Canada Sand Control Systems Submarket, By Techniques Forecast 2020-2030 ($billion, AGR %, Cumulative)
Table 5.5 Canada Sand Control Systems Submarket, By Type Forecast 2020-2030 ($billion, AGR %, Cumulative)
Table 5.6 US Sand Control Systems Market Submarket, By Sand Control Method Forecast 2020-2030 ($billion, , AGR %, CAGR %, Cumulative)
Table 5.7 US Sand Control Systems Submarket, By Techniques Forecast 2020-2030 ($billion, AGR %, Cumulative)
Table 5.8 US Sand Control Systems Submarket, By Type Forecast 2020-2030 ($billion, AGR %, Cumulative)
Table 5.9 Latin America Sand Control Systems Market Forecast 2020-2030 ($billion, , AGR %, CAGR %, Cumulative)
Table 5.10 Latin America Sand Control Systems Submarket, By Techniques Forecast 2020-2030 ($billion, AGR %, Cumulative)
Table 5.11 Latin America Sand Control Systems Submarket, By Type Forecast 2020-2030 ($billion, AGR %, Cumulative)
Table 5.12 Germany Sand Control Systems Market Submarket, By Sand Control Method Forecast 2020-2030 ($billion, , AGR %, CAGR %, Cumulative)
Table 5.13 Germany Sand Control Systems Submarket, By Techniques Forecast 2020-2030 ($billion, AGR %, Cumulative)
Table 5.14 Germany Sand Control Systems Submarket, By Type Forecast 2020-2030 ($billion, AGR %, Cumulative)
Table 5.15 UK Sand Control Systems Market Submarket, By Sand Control Method Forecast 2020-2030 ($billion, , AGR %, CAGR %, Cumulative)
Table 5.16 UK Sand Control Systems Submarket, By Techniques Forecast 2020-2030 ($billion, AGR %, Cumulative)
Table 5.17 UK Sand Control Systems Submarket, By Type Forecast 2020-2030 ($billion, AGR %, Cumulative)
Table 5.18 Spain Sand Control Systems Market Submarket, By Sand Control Method Forecast 2020-2030 ($billion, , AGR %, CAGR %, Cumulative)
Table 5.19 Spain Sand Control Systems Submarket, By Techniques Forecast 2020-2030 ($billion, AGR %, Cumulative)
Table 5.20 Spain Sand Control Systems Submarket, By Type Forecast 2020-2030 ($billion, AGR %, Cumulative)
Table 5.21 UK Sand Control Systems Submarket, By Sand Control Method Forecast 2020-2030 ($billion, , AGR %, CAGR %, Cumulative)
Table 5.22 UK Sand Control Systems Submarket, By Techniques Forecast 2020-2030 ($billion, AGR %, Cumulative)
Table 5.23 UK Sand Control Systems Submarket, By Type Forecast 2020-2030 ($billion, AGR %, Cumulative)
Table 5.24 China Sand Control Systems Submarket, By Sand Control Method Forecast 2020-2030 ($billion, , AGR %, CAGR %, Cumulative)
Table 5.25 China Sand Control Systems Submarket, By Techniques Forecast 2020-2030 ($billion, AGR %, Cumulative)
Table 5.26 China Sand Control Systems Submarket, By Type Forecast 2020-2030 ($billion, AGR %, Cumulative)
Table 5.27 Australia Sand Control Systems Submarket, By Sand Control Method Forecast 2020-2030 ($billion, , AGR %, CAGR %, Cumulative)
Table 5.28 Australia Sand Control Systems Submarket, By Techniques Forecast 2020-2030 ($billion, AGR %, Cumulative)
Table 5.29 Australia Sand Control Systems Submarket, By Type Forecast 2020-2030 ($billion, AGR %, Cumulative)
Table 5.30 South Korea Sand Control Systems Submarket, By Sand Control Method Forecast 2020-2030 ($billion, , AGR %, CAGR %, Cumulative)
Table 5.31 South Korea Sand Control Systems Submarket, By Techniques Forecast 2020-2030 ($billion, AGR %, Cumulative)
Table 5.32 South Korea Sand Control Systems Submarket, By Type Forecast 2020-2030 ($billion, AGR %, Cumulative)
Table 5.33 Japan Sand Control Systems Submarket, By Sand Control Method Forecast 2020-2030 ($billion, , AGR %, CAGR %, Cumulative)
Table 5.34 Japan Sand Control Systems Submarket, By Techniques Forecast 2020-2030 ($billion, AGR %, Cumulative)
Table 5.35 Japan Sand Control Systems Submarket, By Type Forecast 2020-2030 ($billion, AGR %, Cumulative)
Table 5.36 India Sand Control Systems Submarket, By Sand Control Method Forecast 2020-2030 ($billion, , AGR %, CAGR %, Cumulative)
Table 5.37 India Sand Control Systems Submarket, By Techniques Forecast 2020-2030 ($billion, AGR %, Cumulative)
Table 5.38 India Sand Control Systems Submarket, By Type Forecast 2020-2030 ($billion, AGR %, Cumulative)
Table 5.39 Middle East Sand Control Systems Submarket, By Sand Control Method Forecast 2020-2030 ($billion, , AGR %, CAGR %, Cumulative)
Table 5.40 Middle East Sand Control Systems Submarket, By Techniques Forecast 2020-2030 ($billion, AGR %, Cumulative)
Table 5.41 Middle East Sand Control Systems Submarket, By Type Forecast 2020-2030 ($billion, AGR %, Cumulative)
Table 5.42 Rest of Asia-Pacific Sand Control Systems Submarket, By Sand Control Method Forecast 2020-2030 ($billion , , AGR %, CAGR %, Cumulative)
Table 5.43 Rest of Asia-Pacific Sand Control Systems Submarket, By Techniques Forecast 2020-2030 ($billion , AGR %, Cumulative)
Table 5.44 Rest of Asia-Pacific Sand Control Systems Submarket, By Type Forecast 2020-2030 ($billion , AGR %, Cumulative)
Table 5.45 Rest of Europe Sand Control Systems Submarket, By Sand Control Method Forecast 2020-2030 ($billion, , AGR %, CAGR %, Cumulative)
Table 5.46 Rest of Europe Sand Control Systems Submarket, By Techniques Forecast 2020-2030 ($billion, AGR %, Cumulative)
Table 5.47 Rest of Europe Sand Control Systems Submarket, By Type Forecast 2020-2030 ($billion, AGR %, Cumulative)
Table 5.48 Africa Sand Control Systems Submarket, By Sand Control Method Forecast 2020-2030 ($billion, , AGR %, CAGR %, Cumulative)
Table 5.49 Africa Sand Control Systems Submarket, By Techniques Forecast 2020-2030 ($billion, AGR %, Cumulative)
Table 5.50 Africa Sand Control Systems Submarket, By Type Forecast 2020-2030 ($billion, AGR %, Cumulative)
Table 5.51 Spain Sand Control Systems Submarket, By Sand Control Method Forecast 2020-2030 ($billion , , AGR %, CAGR %, Cumulative)
Table 5.52 Spain Sand Control Systems Submarket, By Techniques Forecast 2020-2030 ($billion , AGR %, Cumulative)
Table 5.53 Spain Sand Control Systems Submarket, By Type Forecast 2020-2030 ($billion , AGR %, Cumulative)
Table 7.1 Superior Energy Profile 2019 (Market Entry, Public/Private, Headquarters, Geography, Key Market, Listed on, Products/Services
Table 7.2 Superior Energy Profile 2019 (Market Entry, Public/Private, Headquarter, Total Company Revenue $billion, Change in Revenue, Geography, Key Market, Listed on, Products/Services)
Table 7.3 Superior Energy Products and Services (Product/Service, Notes)
Table 7.4 Superior Energy Total Company Sales 2015-2019 (US$billion, AGR %)
Table 7.5 Superior Energy Total Company Recent Development 2015-2019
Table 7.6 RGL Reservoir Management Inc. Profile 2019 (Market Entry, Public/Private, Headquarter, Total Company Revenue $billion, Change in Revenue, Geography, Key Market, Listed on, Products/Services)
Table 7.7 RGL Reservoir Management Inc. Products and Services (Product/Service, Notes)
Table 7.8 RGL Reservoir Management Inc. Total Company Sales 2015-2019 (US$billion, AGR %)
Table 7.9 RGL Reservoir Management Inc. Total Company Recent Development 2015-2019
Table 7.10 Welltec A/S Profile 2019 (Market Entry, Public/Private, Headquarter, Total Company Revenue $billion, Change in Revenue, Geography, Key Market, Listed on, Products/Services)
Table 7.11 Welltec A/S Products and Services (Product/Service, Notes)
Table 7.12 Welltec A/S Total Company Sales 2015-2019 (US$billion, AGR %)
Table 7.13 Welltec A/S Total Company Recent Development 2015-2019
Table 7.14 Baker Hughes - a GE Co. Profile 2019 (Market Entry, Public/Private, Headquarter, Total Company Revenue $billion, Change in Revenue, Geography, Key Market, Listed on, Products/Services)
Table 7.15 Baker Hughes - a GE Co. Products and Services (Product/Service, Notes)
Table 7.16 Baker Hughes - a GE Co. Total Company Sales 2015-2019 (US$billion, AGR %)
Table 7.17 Baker Hughes - a GE Co. Total Company Recent Development 2015-2019
Table 7.18 Schlumberger Ltd. Profile 2019 (Market Entry, Public/Private, Headquarter, Total Company Revenue $billion, Change in Revenue, Geography, Key Market, Listed on, Products/Services)
Table 7.19 Schlumberger Ltd. Products and Services (Product/Service, Notes)
Table 7.20 Schlumberger Ltd. Total Company Sales 2015-2019 (US$billion, AGR %)
Table 7.21 Schlumberger Ltd. Total Company Recent Development 2015-2019
Table 7.22 Weatherford International Ltd. Profile 2019 (Market Entry, Public/Private, Headquarter, Total Company Revenue $billion, Change in Revenue, Geography, Key Market, Listed on, Products/Services)
Table 7.23 Weatherford International Ltd. Products and Services (Product/Service, Notes)
Table 7.24 Weatherford International Ltd. Total Company Sales 2015-2019 (US$billion, AGR %)
Table 7.25 Weatherford International Ltd. Total Company Recent Development 2015-2019
Table 7.26 National Oilwell Varco Inc. Profile 2019 (Market Entry, Public/Private, Headquarter, Total Company Revenue $billion, Change in Revenue, Geography, Key Market, Listed on, Products/Services)
Table 7.27 National Oilwell Varco Inc. Products and Services (Product/Service, Notes)
Table 7.28 National Oilwell Varco Inc. Total Company Sales 2015-2019 (US$billion, AGR %)
Table 7.29 National Oilwell Varco Inc. Total Company Recent Development 2015-2019
Table 7.30 Halliburton Company Profile 2019 (Market Entry, Public/Private, Headquarter, Total Company Revenue $billion, Change in Revenue, Geography, Key Market, Listed on, Products/Services)
Table 7.31 Halliburton Company Products and Services (Product/Service, Notes)
Table 7.32 Halliburton Company Total Company Sales 2015-2019 (US$billion, AGR %)
Table 7.33 Halliburton Company Total Company Recent Development 2015-2019
Table 7.34 Dialog Profile 2019 (Market Entry, Public/Private, Headquarter, Total Company Revenue $billion, Change in Revenue, Geography, Key Market, Listed on, Products/Services)
Table 7.35 Dialog Products and Services (Product/Service, Notes)
Table 7.36 Dialog Total Company Sales 2015-2019 (US$billion, AGR %)
Table 7.37 Dialog Total Company Recent Development 2015-2019
Table 7.38 Interwell Profile 2019 (Market Entry, Public/Private, Headquarter, Total Company Revenue $billion, Change in Revenue, Geography, Key Market, Listed on, Products/Services)
Table 7.39 Interwell Products and Services (Product/Service, Notes)
Table 7.40 Interwell Total Company Sales 2015-2019 (US$billion, AGR %)
Table 7.41 Interwell Total Company Recent Development 2015-2019
Table 7.42 Mitchell Profile 2019 (Market Entry, Public/Private, Headquarter, Total Company Revenue $billion, Change in Revenue, Geography, Key Market, Listed on, Products/Services)
Table 7.43 Mitchell Products and Services (Product/Service, Notes)
Table 7.44 Mitchell Total Company Sales 2015-2019 (US$billion, AGR %)
Table 7.45 Mitchell Total Company Recent Development 2015-2019
List of Figures
Figure 1.1 Global Sand Control Systems Market Segmentation
Figure 2.1 Sand Control Systems Value Chain Analysis
Figure 3.1 Sand Control Systems Supply-Demand Analysis
Figure 4.1 Global Sand Control Systems Forecast 2020-2030 ($billion, AGR %)
Figure 4.2 Global Sand Control Systems Market Forecast 2020-2030
Figure 4.3 Global Sand Control Systems Submarket Forecast by 2020-2030 ($ billion)
Figure 4.4 Global Sand Control Systems Market By Techniques Share Forecast 2020, 2025, 2030 (% Share)
Figure 4.19 Global Sand Control Systems by Submarket By Techniques Forecast 2020-2030 ($ million)
Figure 4.20 Global Sand Control Systems Market, by Share Forecast 2020, 2025, 2030 (% Share)
Figure 4.21 Sand Control Systems Market, By Techniques Forecast 2020-2030 ($billion, AGR%)
Figure 4.23 Sand Control Systems Market, By Techniques Forecast 2020-2030 ($billion, AGR%)
Figure 4.25 Sand Control Systems Market, By Techniques Forecast 2020-2030 ($billion, AGR%)
Figure 4.27 Sand Control Systems Market, By Techniques Forecast 2020-2030 ($billion, AGR%)
Figure 5.1 Regional/Country Sand Control Systems Market, by 2020-2030
Figure 5.3 Leading Country/Regional Sand Control Systems Market Share, by 2020
Figure 5.4 Leading Country/Regional Sand Control Systems Market Share, by 2025
Figure 5.5 Leading Country/Regional Sand Control Systems Market Share, by 2030
Figure 5.6 Canada Sand Control Systems Market Forecast 2020-2030 ($billion, AGR%)
Figure 5.7 Canada Sand Control Systems Market, by Forecast 2020-2030
Figure 5.8 Canada Sand Control Systems Submarket, By Techniques Forecast 2020-2030
Figure 5.9 Canada Sand Control Systems Submarket , By Type Forecast 2020-2030
Figure 5.10 Canada Sand Control Systems Submarket , By Sand Control Method 2020-2030 ($billion, AGR%)
Figure 5.10 U.S. Sand Control Systems Market Forecast 2020-2030 ($billion, AGR%)
Figure 5.11 U.S. Sand Control Systems Market, by Forecast 2020-2030
Figure 5.12 U.S. Sand Control Systems Submarket, By Techniques Forecast 2020-2030
Figure 5.13 U.S. Sand Control Systems Submarket , By Type Forecast 2020-2030
Figure 5.13 U.S. Sand Control Systems Submarket , By Sand Control Method Forecast 2020-2030
Figure 5.14 Latin America Sand Control Systems Market Forecast 2020-2030 ($billion , AGR%)
Figure 5.15 Latin America Sand Control Systems Market, by Forecast 2020-2030
Figure 5.16 Latin America Sand Control Systems Submarket, By Techniques Forecast 2020-2030
Figure 5.17 Latin America Sand Control Systems Submarket , By Type Forecast 2020-2030
Figure 5.17 Latin America Sand Control Systems Submarket , By Sand Control Method Forecast 2020-2030
Figure 5.18 Germany Sand Control Systems Market Forecast 2020-2030 ($billion, AGR%)
Figure 5.19 Germany Sand Control Systems Market, by Forecast 2020-2030
Figure 5.20 Germany Sand Control Systems Submarket, By Techniques Forecast 2020-2030
Figure 5.21 Germany Sand Control Systems Submarket , By Type Forecast 2020-2030
Figure 5.21 Germany Sand Control Systems Submarket , By Sand Control Method Forecast 2020-2030
Figure 5.22 U.K. Sand Control Systems Market Forecast 2020-2030 ($billion, AGR%)
Figure 5.23 U.K. Sand Control Systems Market, by Forecast 2020-2030
Figure 5.24 U.K. Sand Control Systems Submarket, By Techniques Forecast 2020-2030
Figure 5.25 U.K. Sand Control Systems Submarket , By Type Forecast 2020-2030
Figure 5.25 U.K. Sand Control Systems Submarket , By Sand Control Method Forecast 2020-2030
Figure 5.26 Spain Sand Control Systems Market Forecast 2020-2030 ($billion, AGR%)
Figure 5.27 Spain Sand Control Systems Market, by Forecast 2020-2030
Figure 5.28 Spain Sand Control Systems Submarket, By Techniques Forecast 2020-2030
Figure 5.29 Spain Sand Control Systems Submarket , By Type Forecast 2020-2030
Figure 5.30 UK Sand Control Systems Market Forecast 2020-2030 ($billion, AGR%)
Figure 5.31 UK Sand Control Systems Market, by Forecast 2020-2030
Figure 5.32 UK Sand Control Systems Submarket, By Techniques Forecast 2020-2030
Figure 5.33 UK Sand Control Systems Submarket , By Type Forecast 2020-2030
Figure 5.34 China Sand Control Systems Market Forecast 2020-2030 ($billion, AGR%)
Figure 5.35 China Sand Control Systems Submarket , By Sand Control Method, by Forecast 2020-2030
Figure 5.36 China Sand Control Systems Submarket, By Techniques Forecast 2020-2030
Figure 5.37 China Sand Control Systems Submarket , By Type Forecast 2020-2030
Figure 5.38 Australia Sand Control Systems Market Forecast 2020-2030 ($billion, AGR%)
Figure 5.39 Australia Sand Control Systems Submarket , By Sand Control Method, by Forecast 2020-2030
Figure 5.40 Australia Sand Control Systems Submarket, By Techniques Forecast 2020-2030
Figure 5.41 Australia Sand Control Systems Submarket , By Type Forecast 2020-2030
Figure 5.42 South Korea Sand Control Systems Market Forecast 2020-2030 ($billion, AGR%)
Figure 5.43 South Korea Sand Control Systems Submarket , By Sand Control Method, by Forecast 2020-2030
Figure 5.44 South Korea Sand Control Systems Submarket, By Techniques Forecast 2020-2030
Figure 5.45 South Korea Sand Control Systems Submarket , By Type Forecast 2020-2030
Figure 5.46 Japan Sand Control Systems Market Forecast 2020-2030 ($billion, AGR%)
Figure 5.47 Japan Sand Control Systems Submarket , By Sand Control Method, by Forecast 2020-2030
Figure 5.48 Japan Sand Control Systems Submarket, By Techniques Forecast 2020-2030
Figure 5.49 Japan Sand Control Systems Submarket , By Type Forecast 2020-2030
Figure 5.50 India Sand Control Systems Market Forecast 2020-2030 ($billion, AGR%)
Figure 5.51 India Sand Control Systems Submarket , By Sand Control Method, by Forecast 2020-2030
Figure 5.52 India Sand Control Systems Submarket, By Techniques Forecast 2020-2030
Figure 5.53 India Sand Control Systems Submarket , By Type Forecast 2020-2030
Figure 5.54 Middle East Sand Control Systems Market Forecast 2020-2030 ($billion, AGR%)
Figure 5.55 Middle East Sand Control Systems Submarket , By Sand Control Method, by Forecast 2020-2030
Figure 5.56 Middle East Sand Control Systems Submarket, By Techniques Forecast 2020-2030
Figure 5.57 Middle East Sand Control Systems Submarket , By Type Forecast 2020-2030
Figure 5.70 Rest of the World Sand Control Systems Market Forecast 2020-2030 ($billion , AGR%)
Figure 5.71 Rest of the World Sand Control Systems Submarket , By Sand Control Method, by Forecast 2020-2030
Figure 5.72 Rest of the World Sand Control Systems Submarket, By Techniques Forecast 2020-2030
Figure 5.73 Rest of the World Sand Control Systems Submarket , By Type Forecast 2020-2030
Figure 7.1 Superior Energy Total Company Sales 2013-2019 (US$ million, AGR %)
Figure 7.2 RGL Reservoir Management Inc. Total Company Sales 2013-2019 (US$ million, AGR %)
Figure 7.3 Welltec A/S Total Company Sales 2013-2019 (US$ Bn, AGR %)
Figure 7.6 Baker Hughes - a GE Co. Company Sales 2013-2019 (US$ bn, AGR %)
Figure 7.7 Baker Hughes - a GE Co. Revenue % Share, by Sand Control Method Segment, 2019
Figure 7.8 Baker Hughes - a GE Co. Revenue % Share, by Geographical Trade, 2019
Figure 7.9 Baker Hughes - a GE Co. Revenue % Share, by Business Segment, 2019
Figure 7.10 Schlumberger Ltd. Revenue % Share, by Geographic Segment, 2019
Figure 7.11 Weatherford International Ltd. Company Total Company Sales 2013-2019 (US$ million, AGR %)
Figure 7.12 National Oilwell Varco Inc. Total Company Sales 2013-2019 (US$ million, AGR %)
Figure 7.13 National Oilwell Varco Inc. Revenue % Share, by Regional Segment, 2019
Figure 7.14 Halliburton Company Total Company Sales 2013-2019 (US$ million, AGR %)
Figure 7.15 Halliburton Company Revenue % Share, by Regional Segment, 2019
Figure 7.16 Halliburton Company Revenue % Share, by Business Segment, 2019
Figure 7.17 Dialog Total Company Sales 2013-2019 (US$ bn, AGR %)
Figure 7.18 Interwell Total Company Revenue 2013-2019 (US$ bn, AGR %)
Figure 7.19 Interwell Company Sales 2014-2019 (US$ bn, AGR %)
Figure 7.20 Interwell Revenue % Share, by Business Segment, 2019