Visiongain has forecasted that the global recycled polyethylene terephthalate market will see a capital expenditure (CAPEX) of $8,374 million in 2020. Plastics are one of the most widely used materials, with applications in packaging, textiles, construction and electronics, and new applications continuing to emerge. Plastic properties can be tailored to specific needs with changes in chemistry, by blending with other plastic or non-plastic materials, or with various additives. They can be made flexible or rigid, hard or soft, and resistant to various substances. Plastics are inexpensive to make and use relative to most other materials, but so many different kinds of plastics and uses can be prohibitive when recycling. There are instances when the recycling of plastics is profitable, but there are also cases in which the cost to collect, separate, clean and reuse plastic products significantly outweighs the economic and environmental benefits of doing so.
Aside from economic considerations, recycling is influenced by public sentiment. Developed countries increasingly view industrial activity through the lens of sustainable development. One result can be subsidies for recycling. Consumers often pay more for the collection and processing of material for recycling than they would for land disposal or incineration. Using recycled content in products and making products that are easier to recycle are two measures manufacturers take to be more “environmentally friendly.” The magnitude of this influence on markets is difficult to predict. Clearly, the public would like to take measures that conserve natural resources and minimize the environmental impact of the products they use, but the price they are willing to pay to do so remains unclear. In recent years, developing countries such as China set ambitious targets for plastics recycling.
The U.S. has largely taken a free market approach, but Europe has not. Europe’s laws concerning recycling rates and restrictions on the use of certain substances are much more stringent than those in the U.S. Many insightful applications and technologies have come from the high levels of recycling practiced in some European countries. In the Asia-Pacific region, China, India, Vietnam and Indonesia lead the plastics recycling business. Mexico, South Africa, Australia and Brazil also have considerable market sizes.
The goal of this study is to provide information regarding the current state of global recycled polyethylene terephthalate (rPET), as well as to speculate where it is headed and why. This is accomplished by describing current markets, the items being recycled, the entities doing it, the quantities and the regions in which recycled materials are being used in new products. Factors that influence recycling, such as new technologies and legislation, are also discussed. Waste products from commercial sources (e.g., packaging and shipping films) are included.
Recycling of industrial scrap is not covered in this report. Wastes generated during production, including off-spec resin, have a different set of problems associated with their recovery. These materials tend to be more uniform than post-consumer scrap, and they have a lower level of contamination.
Read on to discover the potential business opportunities available.
Market Attractiveness
Europe will process a total of 5.1 billion pounds more post-consumer plastics by 2025 than in 2019. In Europe, there is a trend that virgin resin producers moving into recycling business. This is European companies’ response to the environmental pressures from increasing recycling rate, especially after China’s import ban. Their efforts will help drive the European market to grow at a CAGR of 6.3% in the next five years, much faster than the virgin resin industry in Europe.
The Netherlands-based LyondellBasell is one that has taken this move. In July 2018, the company announced a cooperation project with the Germany-based Karlsruhe Institute of Technology to advance the chemical recycling of post-consumer plastics. The focus is to develop a new catalyst and process technology to decompose post-consumer plastics into monomers for reuse in polymerization. In early 2018 LyondellBasell entered the recycling business for the first time by setting up a 50:50 joint venture with Suez. The joint venture, called Quality Circular Polymers, aims to developing high-quality recycled polyolefins from the mechanical recycling of sorted post-consumer plastics.
Another large European resin and chemical maker Borealis announced in July 2018 it was purchasedby Austrian PE recycling company Kunststoffrecycling, which processes approximately 28,000 metric tons of post-consumer plastics a year into high-quality LDPE and HDPE recyclates.
The Bangkok-headquartered Indorama Ventures Public Co. Ltd. (IVL), a global chemical and plastics producer, favored the European recycling business even earlier. In 2011, IVL acquired Wellman France Recyclage SAS, one of Europe’s largest PET recyclers. Being optimistic about the European plastics recycling business, IVL acquired Sorepla in August 2018, another big European PET and HDPE recycling company.
India
India will increase post-consumer plastics processing by more than 3 billion pound per year by 2025 from the 2019 level, which provide a great opportunity to the industry. In 2017, MBA Polymers entered the Indian market and signed agreements with several Indian waste management companies for setting up new production unit targeting initially a capacity of 50,000 tons of plastic waste per year. MBA Polymers India aims to supplying the Indian market with recycled ABS, PP and HIPS.
China
There will be no big room for big processors to set up new facilities in China due to the shortage of raw materials. The good news is that China’s demand for recycled resin pellets is still high, and many small-size Chinese recyclers and being cracking down. Therefore, large recycling companies may have a less competition, while the price of recycled pellets is very likely to remain high. China will also buy much more recycled resin pellets, mainly from the big scrap exporters in the past, such as Japan, Germany and the U.S.
Visiongain’s global recycled polyethylene terephthalate market report can keep you informed and up to date with the developments in the market, across four different regions: North America, Europe, Asia Pacific and Rest of the World.
With reference to this report, it details the key investments trend in the global market, subdivided by regions, capital and operational expenditure and project type. Through extensive secondary research and interviews with industry experts, Visiongain has identified a series of market trends that will impact the recycled polyethylene terephthalate market over the forecast timeframe.
The report will answer questions such as:
• How is the recycled polyethylene terephthalate market evolving?
• What is driving and restraining the recycled polyethylene terephthalate market?
• How will each recycled polyethylene terephthalate submarket segment grow over the forecast period and how much revenue will these submarkets account for in 2030?
• How will the market shares for each recycled polyethylene terephthalate submarket develop from 2020 to 2030?
• What will be the main driver for the overall market from 2020 to 2030?
• Will leading recycled polyethylene terephthalate markets broadly follow the macroeconomic dynamics, or will individual national markets outperform others?
• How will the market shares of the national markets change by 2030 and which geographical region will lead the market in 2030?
• Who are the leading players and what are their prospects over the forecast period?
• What are the recycled polyethylene terephthalate projects for these leading companies?
• How will the industry evolve during the period between 2019 and 2030?
Four Reasons Why You Must Order and Read This Report Today:
1) The report provides forecasts for the Global recycled polyethylene terephthalate market, by Source, for the period 2020-2030
• Bottles and Containers Forecast 2020-2030
• Plastic, carpet, padding Forecast 2020-2030
• Non-durable Plastic Forecast 2020-2030
• Other Source Forecast 2020-2030
2) The report also forecasts and analyses the global recycled polyethylene terephthalate market by End-Use from 2020-2030
• Fibre Forecast 2020-2030
• Sheet & Films Forecast 2020-2030
• Food & Beverage Bottles Forecast 2020-2030
• Non-Food Bottles Forecast 2020-2030
• Other End-Use Forecast 2020-2030
3) The report also forecasts and analyses the global recycled polyethylene terephthalate market by Product Type from 2020-2030
• Clear Products Forecast 2020-2030
• Colored Products Forecast 2020-2030
4) The report also forecasts and analyses the global recycled polyethylene terephthalate market by Region from 2020-2030
• North America Forecast 2020-2030
• Europe Forecast 2020-2030
• Asia-Pacific Forecast 2020-2030
• Rest of the World Forecast 2020-2030
The global recycled polyethylene terephthalate market is broken down by four major regions: Asia-Pacific, Europe, North America and ROW. In this report, North America refers to the U.S. and Canada. The European Union (E.U.) takes the majority of the market of the European continent. The Asia-Pacific market is dominated by China and the Southeast Asia-Pacific countries. ROW includes countries in Latin America, Africa and Oceania.
The Asia-Pacific region held more than two-thirds of the global market in 2019. China alone held half of the global revenues. The Asia-Pacific region might face a significant decline in coming years, as China has imposed a ban on the import of plastic waste. Chinese consumers will use more virgin resins than recycled resins, but China’s recycling of domestically collected plastic waste will continue to grow. The markets in India, Indonesia, Vietnam, Malaysia and Thailand will grow as well. The growth will drive the Asia-Pacific region’s recycling volume to return to its 2017 level by 2021.
North America is the second-largest market, whereas Europe and ROW only had smaller market shares. Europe, North America and ROW will experience steady growth of plastics recycling through 2030. This will drive the global plastics recycling market to recover to its 2017 level by 2020.
In some cases, reclaimers convert waste plastics to flakes, pellets or fibers, and then sell them to manufacturers, who in turn use them to make products. Some companies that primarily identify themselves as recyclers convert wastes to recycled resins and then make finished products. Some companies that are considered manufacturers of recycled content products have acquired the capability to reclaim waste materials within their own operations. These manufacturers may purchase recycled resin and also convert materials themselves. Market values in the following table and figures are measured at the level of reclaimers selling processed pellets, flakes or fibers to end users; for those who recycle for their own use, the market values are measured at the level of similar recycled plastics sold in the market.
This independent 194-page report guarantees you will remain better informed than your competitors. With 104 tables and 68 figures examining the recycled polyethylene terephthalate market space, the report gives you a direct, detailed breakdown of the market. PLUS, revenue by source, by product type, by end-use and by Region, as well as in-depth profiles of Companies that will keep your knowledge that one step ahead of your rivals.
This report is essential reading for you or anyone in the plastic sector. Purchasing this report today will help you to recognise those important market opportunities and understand the possibilities there. I look forward to receiving your order.
Visiongain is a trading partner with the US Federal Government
CCR Ref number:
Do you have any custom requirements we can help you with? Any need for specific country, geo region, market segment or specific company information? Contact us today, we can discuss your needs and see how we can help: sara.peerun@visiongain.com
1. Report Overview
1.1 Global Plastic Recycling Industry Overview
1.1.1 How Plastics Are Made
1.1.2 Classifications of Plastics
1.1.3 End Use Market
1.1.4 End-Use Markets for Recycled Plastics
1.2 Recent Developments
1.3 Global Recycled Polyethylene Terephthalate Market Segmentation
1.4 How This Report Delivers
1.5 Key Questions Answered by This Analytical Report Include:
1.6 Why You Should Read This Report?
1.7 Who is This Report for?
1.8 Methodology
1.9 Frequently Asked Questions (FAQ)
1.10 Associated Visiongain Reports
1.11 About Visiongain
2. Introduction and Brief History of Plastics Recycling
2.1 Background
2.2. Types of Resins
2.2.1 Polyethylene Terephthalate
2.2.2 High-Density Polyethylene
2.2.3 LDPE and LLDPE
2.2.4 Polypropylene
2.2.5 Polyurethane
2.2.6 Polystyrene
2.2.7 Polyvinyl Chloride
2.2.8 Polycarbonate
2.2.9 Mixed Resins
2.3 Polyethylene Terephthalate (PET)
2.3.1 History of PET Resin
2.3.2 Production of PET Resin
2.3.3 Properties of PET Resin
2.3.4 Basic Physical properties of PET materials
2.3.5 PET Resin Uses
2.3.6 Recycling of PET Resins
2.4 Factors Affecting the Economics of Plastics Recycling
2.4.1 Cost of Collection, Separation and Processing
2.4.2 Contamination
2.4.3 Quantity
2.4.4 Challenges and Solutions
3. Global Market for Recycled Polyethylene Terephthalate (rPET)
3.1 Market Attractiveness
3.2 Global Market by Source
3.3 Global Market by Product Type
3.4 Global Market by End-Use
3.5 Global Market by Region
4. Recycled Polyethylene Terephthalate (rPET) Market by Source
4.1 Bottles and Containers
4.1.1 Economics
4.1.2 Polyethylene Terephthalate Container Usage and Its Effect on Recycling
4.1.3 Cost of Applications
4.1.4 Trends in High-Density Polyethylene Bottle Use
5. Recycled Polyethylene Terephthalate (rPET) Market by Product Type
5.1 Clear Plastic
5.2 Colored Plastic
6. Recycled Polyethylene Terephthalate (rPET) Market by End-Use
6.2 Sheet & Films
6.2.1 Sources of Film for Recycling
6.2.2 Residential Sources
6.2.3 Commercial Sources
6.2.4 Difficulties with Film Recycling
6.2.5 Projected Film Recycling
6.2.6 Products Made from Recycled Film
6.2.7 Economics
6.3 Consumer Products
6.4 Building Products
6.5 Plastic Lumber and Composites
6.5.1 Plastic Lumber Versus Wood/Fiber Plastic Composites
6.5.2 Manufacturing Methods
6.5.3 Additives
6.5.4 Raw Material Sources
6.6 Plastic and Inorganic Composites
6.6.1 Insulating Concrete Forms
6.7 Concrete, Cement and Asphalt Reinforcement
6.8 Automotive
6.9 Industrial and Commercial
7. Regional Markets for Recycled Polyethylene Terephthalate (rPET)
7.1. Asia-Pacific Market for Plastics Recycling
7.1.1 Asia-Pacific Market for Recycled Polyethylene Terephthalate (rPET)
7.1.2 Asia-Pacific Recycled Polyethylene Terephthalate Market by Source, 2020-2030 (US$ Million)
7.1.3 Asia-Pacific Recycled Polyethylene Terephthalate Market by Product Type, 2020-2030 (US$ Million)
7.1.4 Asia-Pacific Recycled Polyethylene Terephthalate Market by End-Use, 2020-2030 (US$ Million)
7.1.5 Asia-Pacific Recycled Polyethylene Terephthalate Market by Country, 2020-2030 (US$ Million)
7.1.6 Chinese Plastics Recycling Market
7.1.7 Indian Plastics Recycling Market
7.1.8 Vietnamese Plastics Recycling Market
7.1.9 Indonesian Plastics Recycling Market
7.1.10 Malaysian Plastics Recycling Market
7.1.11 Thailand Plastics Recycling Market
7.1.12 Japanese Plastics Recycling Market
7.1.13 Australian Plastics Recycling Market
7.2 North American Markets for Plastics Recycling
7.2.1 North America Recycled Polyethylene Terephthalate Market by Source
7.2.2 North America Recycled Polyethylene Terephthalate Market by Product Type
7.2.3 North America Recycled Polyethylene Terephthalate Market by End-Use
7.2.4 North America Recycled Polyethylene Terephthalate Market by Country
7.2.5 U.S. Plastics Recycling Market
7.2.6 Canadian Plastics Recycling Market
7.2.7 Mexican Plastics Recycling Market
7.3 European Markets for Plastics Recycling
7.3.1 European Laws and Targets
7.3.2. Industrial Trends
7.3.3 Europe Recycled Polyethylene Terephthalate Market by Source
7.3.4 Europe Recycled Polyethylene Terephthalate Market by Product Type
7.3.5 Europe Recycled Polyethylene Terephthalate Market by End-Use
7.3.6 Europe Recycled Polyethylene Terephthalate Market by Country
7.3.7 German Plastics Recycling Market
7.3.8 French Plastics Recycling Market
7.3.9 Italian Plastics Recycling Market
7.3.10 Spanish Plastics Recycling Market
7.3.11 U.K. Plastics Recycling Market
7.4 Rest of the World Market for Plastics Recycling
7.4.1 RoW Recycled Polyethylene Terephthalate Market by Source
7.4.2 RoW Recycled Polyethylene Terephthalate Market by Product Type
7.4.3 RoW Recycled Polyethylene Terephthalate Market by End-Use
7.4.4 RoW Recycled Polyethylene Terephthalate Market by Country
7.4.5 South African Plastics Recycling Market
7.4.6 Brazilian Plastics Recycling Market
8.0 Company Profiles
8.1 Australia Based Companies
8.1.1 ASTRON
8.1.2 JK Plastics Pty. Ltd.
8.2 Austria Based Companies
8.2.1 Kunststoffrecycling Ges. M.B.H
8.3 Belgium Based Companies
8.3.1 GALLOO
8.4 Brazil Based Companies
8.4.1 Clodam Do Brasil
8.5 Canada Based Companies
8.5.1 Blue Mountain Plastics
8.5.2 EFS PLASTICS INC.
8.5.3 Enviroplast Inc.
8.5.4. Nexcycle Canada Ltd.
8.6 China Based Companies
8.6.1 ANFU
8.6.2 Hangzhou Taifor Chemical Textile Fiber Co. Ltd.
8.6.3 Ningbo Dafa Chemical Fiber Co. Ltd.
8.6.4 Shandong Yongping Renewable Tiomin Resources Inc.
8.6.5 Shanghai Tianqiang Environmental Protection Technology Co. Ltd.
8.6.6 Zhejiang Huafei Recycling Resources Co. Ltd.
8.7 Finland Based Companies
8.7.1 FINDOCK
8.8. France Based Companies
8.8.1 COBEPLAST
8.8.2 Sorepla Industrie
8.9 Germany Based Companies
8.9.1 Mobius Technologies Gmbh
8.9.2 MTM Plastics GMBH
8.10 India Based Companies
8.10.1 MBA Polymers India Pvt Ltd
8.10.2 Shakti Plastics Industries
8.11 Indonesia Based Companies
8.11.1 Polindo Utama
8.11.2 PT. Production Recycling Indonesia
8.12 Italy Based Companies
8.12.1 DENTIS
8.12.2 Montello S.P.A.
8.13 Japan Based Companies
8.13.1 TEIJIN
8.14 Malaysia Based Companies
8.14.1 EPD Plastic Industries SDN BHD
8.14.2 Heng Hiap Industries SDN. BHD
8.15 Mexico Based Companies
8.15.1 PLASTICRUZ
8.16 Norway Based Companies
8.16.1 Tomra Systems ASA
8.17 South Africa Based Companies
8.17.1 PET Recycling Company
8.18 Spain Based Companies
8.18.1 PETCIA
8.19 Thailand Based Companies
8.19.1 Billion Enterprise Co. Ltd.
8.19.2 Indorama Ventures Public Co. Ltd.
8.19.3 Thai Plastic Recycle Group Co. Ltd.
8.20 The Netherlands Based Companies
8.20.1 LYONDELLBASELL
8.21 U.K. Based Companies
8.21.1 Axion Polymers
8.21.2 PLASGRAN LTD.
8.21.3 Recycled Plastics U.K.
8.21.4 Recycling Technologies
8.22 U.S. Based Companies
8.22.1 ACI Plastics
8.22.2 American Plastic Lumber Inc.
8.22.3 Axion International
8.22.4 B&F Plastics
8.22.5 Blue Ridge Plastics
8.22.6 Butler Macdonald
8.22.7 Carbonlite
8.22.8 Clean Tech Inc.
8.22.9 Commercial Plastics Recycling, Inc.
8.22.10 Conigliaro Industries
8.22.11 Delta Plastics
8.22.12 East Coast Electronics Recycling
8.22.13 Geo-Tech Polymers
8.22.14 KW Plastics
8.22.15 Los Angeles Fiber Co.
8.22.16 MBA POLYMERS, INC.
8.22.17 Mondo Polymer Technologies
8.22.18 Phoenix Technologies International, Llc
8.22.19 Plasteak Inc.
8.22.20 Plastics Recycling Inc.
8.22.21 Plasticycle Corp.
8.22.22 Poly-Wood LLC
8.22.23 RAPC INC.
8.22.25 Reprocessed Plastics, Inc.
8.22.26 Renew Plastics
8.22.27 RPM Plastic Pallets
8.22.28 TREX CO.
8.22.29 Welor Waste Control Inc.
8.22.30 Yemm & Hart Ltd.
8.23 Vietnam Based Companies
8.23.1 IAV Global
9.0 Conclusion
9.1 PET Resin Uses
9.1.1 3D Printing
9.1.2 Injection Molding
9.1.3 CNC Machining
9.1.4 PET Film and Sheet
9.1.5 PET Bottle
9.1.6 PET G
10.0 Glossary
Associated Visiongain Reports
Visiongain Report Sales Order Form
Appendix A
About Visiongain
Appendix B
Visiongain report evaluation form
List of Tables
Table 3.1 Global Recycled Polyethylene Terephthalate Market by Source, 2020-2030 (US$ Million)
Table 3.2 Global Recycled Polyethylene Terephthalate Market by Product Type, 2020-2030 (US$ Million)
Table 3.3 Global Recycled Polyethylene Terephthalate Market by End-Use, 2020-2030 (US$ Million)
Table 3.4 Global Recycled Polyethylene Terephthalate Market by Region, 2020-2030 (US$ Million)
Table 4.1 Global Bottles and Containers Recycled Polyethylene Terephthalate Market by Region, 2020-2030 (US$ Million)
Table 4.2 Global Plastic, carpet, padding Recycled Polyethylene Terephthalate Market by Region, 2020-2030 (US$ Million)
Table 4.3 Global Non-durable Plastic Recycled Polyethylene Terephthalate Market by Region, 2020-2030 (US$ Million)
Table 4.4 Global Other Type Recycled Polyethylene Terephthalate Market by Region, 2020-2030 (US$ Million)
Table 5.1 Global Clear Recycled Polyethylene Terephthalate Market by Region, 2020-2030 (US$ Million)
Table 5.2 Global Colored Recycled Polyethylene Terephthalate Market by Region, 2020-2030 (US$ Million)
Table 6.1 Global Fibre Recycled Polyethylene Terephthalate Market by Region, 2020-2030 (US$ Million)
Table 6.2 Global Sheet & Films Recycled Polyethylene Terephthalate Market by Region, 2020-2030 (US$ Million)
Table 6.3 Global Food & Beverage Bottles Recycled Polyethylene Terephthalate Market by Region, 2020-2030 (US$ Million)
Table 6.4 Global Non-Food Bottles Recycled Polyethylene Terephthalate Market by Region, 2020-2030 (US$ Million)
Table 6.5 Global Other End-Use Recycled Polyethylene Terephthalate Market by Region, 2020-2030 (US$ Million)
Table 7.1 Global Recycled Polyethylene Terephthalate Market by Region, 2020-2030 (US$ Million)
Table 7.2 Asia-Pacific Recycled Polyethylene Terephthalate Market by Source, 2020-2030 (US$ Million)
Table 7.3 Asia-Pacific Recycled Polyethylene Terephthalate Market by Product Type, 2020-2030 (US$ Million)
Table 7.4 Asia-Pacific Recycled Polyethylene Terephthalate Market by End-Use, 2020-2030 (US$ Million)
Table 7.5 Asia-Pacific Recycled Polyethylene Terephthalate Market by Country, 2020-2030 (US$ Million)
Table 7.6 North America Recycled Polyethylene Terephthalate Market by Source, 2020-2030 (US$ Million)
Table 7.7 North America Recycled Polyethylene Terephthalate Market by Product Type, 2020-2030 (US$ Million)
Table 7.8 North America Recycled Polyethylene Terephthalate Market by End-Use, 2020-2030 (US$ Million)
Table 7.9 North America Recycled Polyethylene Terephthalate Market by Country, 2020-2030 (US$ Million)
Table 7.10 Europe Recycled Polyethylene Terephthalate Market by Source, 2020-2030 (US$ Million)
Table 7.11 Europe Recycled Polyethylene Terephthalate Market by Product Type, 2020-2030 (US$ Million)
Table 7.12 Europe Recycled Polyethylene Terephthalate Market by End-Use, 2020-2030 (US$ Million)
Table 7.13 Europe Recycled Polyethylene Terephthalate Market by Country, 2020-2030 (US$ Million)
Table 7.14 RoW Recycled Polyethylene Terephthalate Market by Source, 2020-2030 (US$ Million)
Table 7.15 RoW Recycled Polyethylene Terephthalate Market by Product Type, 2020-2030 (US$ Million)
Table 7.16 RoW Recycled Polyethylene Terephthalate Market by End-Use, 2020-2030 (US$ Million)
Table 7.17 RoW Recycled Polyethylene Terephthalate Market by Country, 2020-2030 (US$ Million)
Table 8.1 ASTRON Company Details
Table 8.2 JK Plastics Pty. Ltd. Company Details
Table 8.3 Kunststoffrecycling Ges. M.B.H Company Details
Table 8.4 Mas Maschinen-Und Anlagenbau Schulz GMBH Company Details
Table 8.5 GALLOO Company Details
Table 8.7 Blue Mountain Plastics Company Details
Table 8.8 EFS Plastics Inc. Company Details
Table 8.9 Enviroplast Inc. Company Details
Table 8.10 Nexcycle Canada Ltd. Company Details
Table 8.11 ANFU Company Details
Table 8.12 Hangzhou Taifor Chemical Textile Fiber Co. Ltd. Company Details
Table 8.13 Ningbo Dafa Chemical Fiber Co. Ltd. Company Details
Table 8.14 Shandong Yongping Renewable Tiomin Resources Inc. Company Details
Table 8.15 Shanghai Tianqiang Environmental Protection Technology Co. Ltd. Company Details
Table 8.16 Zhejiang Huafei Recycling Resources Co. Ltd. Company Details
Table 8.17 FINDOCK Company Details
Table 8.18 COBEPLAST Company Details
Table 8.19 Sorepla Industrie Company Details
Table 8.20 Mobius Technologies GMBH Company Details
Table 8.21 MTM Plastics Gmbh Company Details
Table 8.22 MBA Polymers India Pvt Lvt Company Details
Table 8.23 Shakti Plastics Industries Company Details
Table 8.24 Polindo Utama Company Details
Table 8.25 PT. Production Recycling Indonesia Company Details
Table 8.26 DENTIS Company Details
Table 8.27 Montello S.P.A. Company Details
Table 8.28 TEIJIN Company Details
Table 8.29 EPD Plastic Industries SDN BHD Company Details
Table 8.30 Heng Hiap Industries SDN. BHD Company Details
Table 8.31 PLASTICRUZ Company Details
Table 8.32 Tomra Systems ASA Company Details
Table 8.33 PET Recycling Company Details
Table 8.34 PETCIA Company Details
Table 8.35 Billion Enterprise Co. Ltd. Company Details
Table 8.36 Indorama Ventures Public Co. Ltd. Company Details
Table 8.37 Thai Plastic Recycle Group Co. Ltd. Company Details
Table 8.38 LYONDELLBASELL Company Details
Table 8.39 Axion Polymers Company Details
Table 8.40 PLASGRAN LTD. Company Details
Table 8.41 Recycled Plastics U.K. Company Details
Table 8.42 Recycling Technologies Company Details
Table 8.43 ACI Plastics Company Details
Table 8.44 American Plastic Lumber Inc. Company Details
Table 8.45 Axion International Company Details
Table 8.46 B&F Plastics Company Details
Table 8.47 Blue Ridge Plastics Company Details
Table 8.48 Butler Macdonald Company Details
Table 8.49 CARBONLITE Company Details
Table 8.50 Clean Tech Inc. Company Details
Table 8.51 Commercial Plastics Recycling, Inc. Company Details
Table 8.52 Conigliaro Industries Company Details
Table 8.53 Delta Plastics Company Details
Table 8.54 East Coast Electronics Recycling Company Details
Table 8.55 Geo-Tech Polymers Company Details
Table 8.56 KW Plastics Company Details
Table 8.57 Los Angeles Fiber Co. Company Details
Table 8.58 MBA Polymers, Inc. Company Details
Table 8.59 Mondo Polymer Technologies Company Details
Table 8.60 Phoenix Technologies International, LLC Company Details
Table 8.61 Plasteak Inc. Company Details
Table 8.62 Plastics Recycling Inc. Company Details
Table 8.63 Plasticycle Corp. Company Details
Table 8.64 Poly-Wood, LLC Company Details
Table 8.65 Rapc Inc. Company Details
Table 8.66 Rastra Of The Americas LLC Company Details
Table 8.67 Reprocessed Plastics, Inc. Company Details
Table 8.68 Renew Plastics Company Details
Table 8.69 RPM Plastic Pallets Company Details
Table 8.70 TREX CO. Company Details
Table 8.71 Welor Waste Control Inc. Company Details
Table 8.72 Yemm & Hart Ltd. Company Details
Table 8.73 IAV Global Company Details
List of Figures
Figure 1.1 Global Recycled Polyethylene Terephthalate Market Segmentation
Figure 4.1 Global Recycled Polyethylene Terephthalate Market by Source, 2020-2030 (US$ Million)
Figure 4.2 Global Recycled Polyethylene Terephthalate Market by Source, Market Share (%) 2020, 2025, 2030
Figure 5.1 Global Recycled Polyethylene Terephthalate Market by Product Type, Market Share (%) 2020, 2025, 2030
Figure 6.1 Global Recycled Polyethylene Terephthalate Market by End-Use, Market Share (%) 2020, 2025, 2030
Figure 7.1 Global Recycled Polyethylene Terephthalate Market by Region, Market Share (%) 2020, 2025, 2030
Figure 7.2 Asia-Pacific Market for Plastics Recycling, by Country, 2017-2018 ($ Millions)
Figure 7.3 Asia-Pacific Market Volume for Plastics Recycling, by Country, 2017-2018 (Million Pounds)
Figure 7.4 Asia-Pacific Recycled Polyethylene Terephthalate Market by Country, 2020-2030 (US$ Million, AGR)
Figure 7.5 Chinese Market Volume for Plastics Recycling, by Collecting Location, 2018 (Million Pounds)
Figure 7.6 Chinese Market Volume for Plastics Recycling, by Source, 2018 (Million Pounds)
Figure 7.7 Chinese Market Volume for Plastics Recycling, by Resin, Through 2023 (Million Pounds)
Figure 7.8 Chinese Market Volume for Post-Consumer Plastics Recycling, by End Use, 2018 (Million Pounds)
Figure 7.9 Indian Market Volume for Plastics Recycling, by Collecting Location, 2018
Figure 7.10 Indian Market Volume for Plastics Recycling, by Source, 2018 (Million Pounds)
Figure 7.11 Indian Market Volume for Plastics Recycling, by Resin, 2017-2018 (Million Pounds)
Figure 7.12 Indian Market Volume for Recycled Plastics, by End Use, 2018 (Million Pounds)
Figure 7.13 Vietnamese Market Volume for Plastics Recycling, by Collecting Location in 2018 (Million Pounds)
Figure 7.14 Vietnamese Market Volume for Plastics Recycling, by Source, 2018 (Million Pounds)
Figure 7.15 Vietnamese Market Volume for Plastics Recycling, by Resin, 2017-2018 (Million Pounds)
Figure 7.16 Vietnamese Market Volume for Recycled Plastics, by End Use, 2018 (Million Pounds)
Figure 7.18 Indonesian Market Volume for Plastics Recycling, by Source in 2018 (Million Pounds)
Figure 7.19 Indonesian Market Volume for Plastics Recycling, by Resin, 2017-2018 (Million Pounds)
Figure 7.20 Indonesian Market Volume for Recycled Plastics, by End Use, 2018 (Million Pounds)
Figure 7.21 Malaysian Market Volume for Plastics Recycling, by Collecting Location, 2018 (Million Pounds)
Figure 7.22 Malaysian Market Volume for Plastics Recycling, by Source, 2018 (Million Pounds)
Figure 7.23 Malaysian Market Volume for Plastics Recycling, by Resin, 2017-2018 (Million Pounds)
Figure 7.24 Malaysian Market Volume for Recycled Plastics, by End Use, 2018 (Million Pounds)
Figure 7.25 Thailand Market Volume for Plastics Recycling, by Collecting Location, 2018 (Million Pounds)
Figure 7.26 Thailand Market Volume for Plastics Recycling, by Source, 2018 (Million Pounds)
Figure 7.27 Thailand Market Volume for Plastics Recycling, by Resin, 2017-2018 (Million Pounds)
Figure 7.28 Thailand Market Volume for Recycled Plastics, by End Use, 2018 (Million Pounds)
Figure 7.29 Japanese Market Volume for Post-Consumer Plastics Recycling from General Waste, by Source, 2018 (Million Pounds)
Figure 7.30 Japanese Market Volume for Post-Consumer Plastics Recycling from General Waste, by Resin, 2017-2018 (Million Pounds)
Figure 7.31 Japanese Market Volume for Recycled Plastics, by End Use, 2018 (Million Pounds)
Figure 7.32 Australian Market Volume for Plastics Recycling, by Source, 2018 (Million Pounds)
Figure 7.33 Australian Market Volume for Plastics Recycling, by Resin, 2017-2018 (Million Pounds)
Figure 7.34 Australian Market Volume for Recycled Plastics, by End Use, 2018 (Million Pounds)
Figure 7.35 U.S. Market Volume for Plastics Recycling, by Source, 2018 (Million Pounds)
Figure 7.36 U.S. Market Volume for Plastics Recycling, by Resin, 2017-2018 (Million Pounds)
Figure 7.37 U.S. Market Volume for Recycled Plastics, by End Use, 2018 (Million Pounds)
Figure 7.38 Canada Market Volume for Plastics Recycling, by Source, 2018 (Million Pounds)
Figure 7.39 Canada Market Volume for Plastics Recycling, by Resin, 2017-2018 (Million Pounds)
Figure 7.40 Canada Market Volume for Recycled Plastics, by End Use, 2018 (Million Pounds)
Figure 7.41 Mexican Market Volume for Plastics Recycling, by Source, 2018 (Million Pounds)
Figure 7.42 Mexican Market Volume for Recycled Plastics, by Resin, 2017-2018 (Million Pounds)
Figure 7.43 Mexican Market Volume for Recycled Plastics, by End Use, 2018 (Million Pounds)
Figure 7.44 German Market Volume for Plastics Recycling, by Source, 2018 (Million Pounds)
Figure 7.45 German Market Volume for Plastics Recycling, by Resin, 2017-2018 (Million Pounds)
Figure 7.46 German Market Volume for Plastics Recycling, by End-Use, 2018 (Million Pounds)
Figure 7.47 French Market Volume for Plastics Recycling, by Source, 2018 (Million Pounds)
Figure 7.48 French Market Volume for Plastics Recycling, by Resin, 2017-2018 (Million Pounds)
Figure 7.49 French Market Volume for Plastics Recycling, by End-Use, 2018 (Million Pounds)
Figure 7.50 Italian Market Volume for Plastics Recycling, by Source, 2018 (Million Pounds)
Figure 7.51 Italian Market Volume for Plastics Recycling, by Resin, 2017-2018 (Million Pounds)
Figure 7.52 Italian Market Volume for Plastics Recycling, by End-Use, 2018 (Million Pounds)
Figure 7.53 Spanish Market Volume for Plastics Recycling, by Source, 2018 (Million Pounds)
Figure 7.54 Spanish Market Volume for Plastics Recycling, by Resin, 2017-2018 (Million Pounds)
Figure 7.55 Spanish Market Volume for Plastics Recycling, by End-Use, 2018 (Million Pounds)
Figure 7.56 U.K. Market Volume for Plastics Recycling, by Source, 2018 (Million Pounds)
Figure 7.57 U.K. Market Volume for Plastics Recycling, by Resin, 2017-2018 (Million Pounds)
Figure 7.58 U.K. Market Volume for Plastics Recycling, by End-Use, 2018 (Million Pounds)
Figure 7.58 South African Market Volume for Plastics Recycling, by Source, 2018 (Million Pounds)
Figure 7.59 South African Market Volume for Plastics Recycling, by Resin, 2017-2018 (Million Pounds)
Figure 7.60 South African Market Volume for Plastics Recycling, by End-Use, 2018 (Million Pounds)
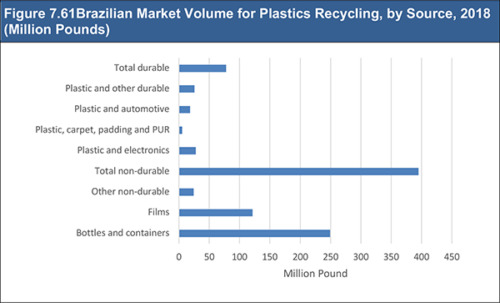
Figure 7.61 Brazilian Market Volume for Plastics Recycling, by Source, 2018 (Million Pounds)
Figure 7.62 Brazilian Market Volume for Plastics Recycling, by Resin, 2017-2018 (Million Pounds)
Figure 7.63 Brazilian Market Volume for Plastics Recycling, by End-Use, 2018 (Million Pounds)
Australia Based Companies
ASTRON
JK Plastics Pty. Ltd.
Austria Based Companies
Kunststoffrecycling Ges. M.B.H
Belgium Based Companies
GALLOO
Brazil Based Companies
Clodam Do Brasil
Canada Based Companies
Blue Mountain Plastics
EFS PLASTICS INC.
Enviroplast Inc.
Nexcycle Canada Ltd.
China Based Companies
ANFU
Hangzhou Taifor Chemical Textile Fiber Co. Ltd.
Ningbo Dafa Chemical Fiber Co. Ltd.
Shandong Yongping Renewable Tiomin Resources Inc.
Shanghai Tianqiang Environmental Protection Technology Co. Ltd.
Zhejiang Huafei Recycling Resources Co. Ltd.
Finland Based Companies
FINDOCK
France Based Companies
COBEPLAST
Sorepla Industrie
Germany Based Companies
Mobius Technologies Gmbh
MTM Plastics GMBH
India Based Companies
MBA Polymers India Pvt Ltd
Shakti Plastics Industries
Indonesia Based Companies
Polindo Utama
PT. Production Recycling Indonesia
Italy Based Companies
DENTIS
Montello S.P.A.
Japan Based Companies
TEIJIN
Malaysia Based Companies
EPD Plastic Industries SDN BHD
Heng Hiap Industries SDN. BHD
Mexico Based Companies
PLASTICRUZ
Norway Based Companies
Tomra Systems ASA
South Africa Based Companies
PET Recycling Company
Spain Based Companies
PETCIA
Thailand Based Companies
Billion Enterprise Co. Ltd.
Indorama Ventures Public Co. Ltd.
Thai Plastic Recycle Group Co. Ltd.
The Netherlands Based Companies
LYONDELLBASELL
U.K. Based Companies
Axion Polymers
PLASGRAN LTD.
Recycled Plastics U.K.
U.S. Based Companies
ACI Plastics
American Plastic Lumber Inc.
Axion International
B&F Plastics
Blue Ridge Plastics
Butler Macdonald
Carbonlite
Clean Tech Inc.
Commercial Plastics Recycling, Inc.
Conigliaro Industries
Delta Plastics
East Coast Electronics Recycling
Geo-Tech Polymers
KW Plastics
Los Angeles Fiber Co.
MBA POLYMERS, INC.
Mondo Polymer Technologies
Phoenix Technologies International, Llc
Plasteak Inc.
Plastics Recycling Inc.
Plasticycle Corp.
Poly-Wood LLC
RAPC INC.
Reprocessed Plastics, Inc.
Renew Plastics
RPM Plastic Pallets
TREX CO.
Welor Waste Control Inc.
Yemm & Hart Ltd.
Vietnam Based Companies
IAV Global