Recently awarded aircraft contracts and product developments in companies involved with aircraft radomes has led Visiongain to publish this unique radomes report which may be crucial to your companies improved success. I thought it would be of interest to you.
Did you know?
As military and commercial aircraft enhance their radar systems, communications and in-flight entertainment & connectivity (IFEC) systems there is a growing need for radomes that protect and enclose the antennae for these systems.
Visiongain assesses that the radome market will reach revenues of US$ 364 Mn in 2018. This is primarily driven by increases in airline spending across various countries. Furthermore, companies are increasing their product and services line ups for airlines. It is therefore critical that you have your timescales correct and your forecasting plans ready. This report will ensure that you do.
5 Reasons why you must order and read this report today:
The report includes a ten year radome forecast as well as information on major contracts and programmes that could bring them about.
The report provides detailed profiles of key companies operating within the Radome market
Airbus S.A.S.
General Dynamics Corporation
Entoptic AG
Kitsap Composites
Meggitt PLC
Nordam Group, Inc.
Northrop Grumman Corporation / Orbital ATK
Saint-Gobain
Starwin Industries
Vermont Composites Inc.
Global Radome Forecasts From 2018-2028
Radome Forecasts By Material Type From 2018-2028
Glass-Fibre Forecasts From 2018-2028
Resin Forecasts From 2018-2028
Quartz Forecasts From 2018-2028
Radome Forecasts By Product Type From 2018-2028
Nose Mounted Forecasts Radome From 2018-2028
Fuselage Mounted Forecasts Radome From 2018-2028
Radome Forecasts By Aircraft Type From 2018-2028
Military Aircraft Forecasts From 2018-2028
Commercial Aircraft Forecasts From 2018-2028
Regional Radome Forecasts From 2018-2028
America Radome Market Forecast 2018-2028
America Radome Market Forecast, By Material Type 2018-2028
America Radome Market Forecast, By Product Type 2018-2028
America Radome Market Forecast, By Aircraft Type 2018-2028
America Radome Market Forecast, By Country 2018-2028
U.S. Radome Market Forecast 2018-2028
Canada Radome Market Forecast 2018-2028
Mexico Radome Market Forecast 2018-2028
Brazil Radome Market Forecast 2018-2028
Europe Radome Market Forecast 2018-2028
Europe Radome Market Forecast, By Material Type 2018-2028
Europe Radome Market Forecast, By Product Type 2018-2028
Europe Radome Market Forecast, By Aircraft Type 2018-2028
Europe Radome Market Forecast, By Country 2018-2028
Germany Radome Market Forecast 2018-2028
UK Radome Market Forecast 2018-2028
Russia Radome Market Forecast 2018-2028
Asia Oceania Radome Market Forecast 2018-2028
Asia Oceania Radome Market Forecast, By Material Type 2018-2028
Asia Oceania Radome Market Forecast, By Product Type 2018-2028
Asia Oceania Radome Market Forecast, By Aircraft Type 2018-2028
Asia Oceania Radome Market Forecast, By Country 2018-2028
China Radome Market Forecast 2018-2028
India Radome Market Forecast 2018-2028
Japan Radome Market Forecast 2018-2028
South Korea Radome Market Forecast 2018-2028
Middle East & Africa (MEA) Radome Market Forecast 2018-2028
Middle East & Africa (MEA) Radome Market Forecast, By Material Type 2018-2028
Middle East & Africa (MEA) Radome Market Forecast, By Product Type 2018-2028
Middle East & Africa (MEA) Radome Market Forecast, By Aircraft Type 2018-2028
MEA Radome Market Forecast, By Country 2018-2028
Israel Radome Market Forecast 2018-2028
Saudi Arabia Radome Market Forecast 2018-2028
South Africa Radome Market Forecast 2018-2028
UAE Radome Market Forecast 2018-2028
This independent 150 page report guarantees you will remain better informed than your competition. With more than 120 tables and figures examining the Radome market space, the report gives you a visual, one-stop breakdown of your market as well as analysis, from 2018-2028 keeping your knowledge that one step ahead allowing you to succeed.
This report is essential reading for you or anyone in the aerospace and defence sector with an interest in Radomes. Purchasing this report today will help you to recognise those important market opportunities and understand the possibilities there. I look forward to receiving your order.
Visiongain is a trading partner with the US Federal Government
CCR Ref number: KD4R6
1. Report Overview
1.1. Radome Market Definition and Research Scope
1.2. Why You Should Read This Report
1.3. How This Report Delivers
1.4. Key Questions Answered by This Analytical Report Include:
1.5. Who is This Report for?
1.6. Methodology
1.7. Frequently Asked Questions (FAQ)
1.8. Associated Visiongain Reports
1.9. About Visiongain
2. Introduction to the Radome Market
2.1. Market Dynamics
2.2. Technological Advancements In Radomes Is Paving The Way For Revenue Growth In The Global Radome Market
3. Global Radome Market Forecast 2018–2028
3.1. Global Radome Market Forecast 2018–2028
3.2. Global Radome Market Forecast 2018–2028
4. Global Radome Market Forecast By Material Type 2018-2028
4.1. Global Radome Market Forecast, By Material Type 2018–2028
4.2. Global Radome Submarket Forecast, By Glass-Fibre Segment 2018-2028
4.2.1. Global Radome Market Forecast, By Glass-Fibre Segment 2018-2028
4.2.2. Global Radome Market Forecast, By Resin Segment 2018-2028
4.3. Global Radome Submarket Forecast, By Quartz Segment 2018-2028
4.3.1. Global Radome Market Forecast, By Quartz Segment 2018-2028
5. Global Radome Market Forecast By Product Type 2018-2028
5.1.Global Radome Market Forecast, By Product Type 2018–2028
5.2. Global Radome Submarket Forecast, By Product Type Segments 2018-2028
5.2.1. Global Radome Market Forecast, By Nose Mounted Radome Segment 2018-2028
5.2.2. Global Radome Market Forecast, By Fuselage Mounted Radome 2018-2028
6. Global Radome Market Forecast By Aircraft Type 2018-2028
6.1. Global Radome Market Forecast, By Aircraft Type 2018–2028
6.2. Global Radome Submarket Forecast, By Aircraft Type Segments 2018-2028
6.2.1. Global Radome Market Forecast, By Military Aircraft Segment 2018-2028
6.2.2. Global Radome Market Forecast, By Commercial Aircraft 2018-2028
7. Global Radome Market, by Geography 2018–2028
7.1. America Radome Market Forecast 2018-2028
7.1.1. America Radome Market Forecast, By Material Type 2018-2028
7.1.2. America Radome Market Forecast, By Product Type 2018-2028
7.1.3. America Radome Market Forecast, By Aircraft Type 2018-2028
7.1.4. America Radome Market Forecast, By Country 2018-2028
7.1.4.1. U.S. Radome Market Forecast 2018-2028
7.1.4.2. Canada Radome Market Forecast 2018-2028
7.1.4.3. Mexico Radome Market Forecast 2018-2028
7.1.4.4. Brazil Radome Market Forecast 2018-2028
7.2. Europe Radome Market Forecast 2018-2028
7.2.1. Europe Radome Market Forecast, By Material Type 2018-2028
7.2.2. Europe Radome Market Forecast, By Product Type 2018-2028
7.2.3. Europe Radome Market Forecast, By Aircraft Type 2018-2028
7.2.4. Europe Radome Market Forecast, By Country 2018-2028
7.2.4.1. Germany Radome Market Forecast 2018-2028
7.2.4.2. UK Radome Market Forecast 2018-2028
7.2.4.3. Russia Radome Market Forecast 2018-2028
7.3. Asia Oceania Radome Market Forecast 2018-2028
7.3.1. Asia Oceania Radome Market Forecast, By Material Type 2018-2028
7.3.2. Asia Oceania Radome Market Forecast, By Product Type 2018-2028
7.3.3. Asia Oceania Radome Market Forecast, By Aircraft Type 2018-2028
7.3.4. Asia Oceania Radome Market Forecast, By Country 2018-2028
7.3.4.1. China Radome Market Forecast 2018-2028
7.3.4.2. India Radome Market Forecast 2018-2028
7.3.4.3. Japan Radome Market Forecast 2018-2028
7.3.4.4. South Korea Radome Market Forecast 2018-2028
7.4. Middle East & Africa (MEA) Radome Market Forecast 2018-2028
7.4.1. Middle East & Africa (MEA) Radome Market Forecast, By Material Type 2018-2028
7.4.2. Middle East & Africa (MEA) Radome Market Forecast, By Product Type 2018-2028
7.4.3. Middle East & Africa (MEA) Radome Market Forecast, By Aircraft Type 2018-2028
7.4.4. MEA Radome Market Forecast, By Country 2018-2028
7.4.4.1. Israel Radome Market Forecast 2018-2028
7.4.4.2. Saudi Arabia Radome Market Forecast 2018-2028
7.4.4.3. South Africa Radome Market Forecast 2018-2028
7.4.4.4. UAE Radome Market Forecast 2018-2028
8. Company Profiles – Radome Market 2018
8.1. Airbus S.A.S.
8.1.1. Airbus S.A.S Strength and opportunities in the Global Radome Market
8.1.2. Airbus S.A.S. Revenue 2014 - 2017
8.1.3. Airbus S.A.S. Recent Radome Related Contracts and Programmes (2016-2017)
8.1.4. Airbus S.A.S. Sales Share (%) by Business Segment 2017
8.1.5. Airbus S.A.S. Sales Share by Geography 2017
8.2. General Dynamics Corporation
8.2.1. General Dynamics Corporation Strength and opportunities in the Global Radome Market
8.2.2. General Dynamics Corporation Revenue 2014 - 2017
8.2.3. General Dynamics Corporation Recent Radome Related Contracts and Programmes (2016-2018)
8.2.4. General Dynamics Corporation Sales Share (%) by Business Segment 2017
8.2.5. General Dynamics Corporation Sales Share by Geography 2017
8.3. Entoptic AG
8.3.1. Entoptic AG Strength and opportunities in the Global Radome Market
8.3.2. Entoptic AG Revenue 2014 - 2017
8.3.3. Entoptic AG Sales by Geography 2017
8.3.4. Entoptic AG Sales by Business Segment 2017
8.3.5. Entoptic AG Recent Radome Related Contracts and Programmes (2016-2018)
8.4. Kitsap Composites
8.4.2. Kitsap Composites Strengths and Opportunities in the Global Radome Market
8.5. Meggitt PLC
8.5.1. Meggitt PLC Strength and opportunities in the Global Radome Market
8.5.2. Meggitt PLC Recent Radome Related Contracts and Programmes (2017-2018)
8.5.3. Meggitt PLC Total Company Sales 2014-2017
8.5.4. Meggitt PLC Sales Share by Geography 2017
8.5.5. Meggitt PLC Sales Share by Business Segment 2017
8.6. NORDAM Group, Inc.
8.6.1. NORDAM Group, Inc. Strength and opportunities in the Global Radome Market
8.6.2. NORDAM Group, Inc. Recent Radome Related Contracts and Programmes (2017)
8.7. Northrop Grumman Corp.
8.7.1. Orbital ATK (Acquired by Northrop Grumman Corp.) Recent Radome Related Contracts and Programmes (2017)
8.7.2. Northrop Grumman Corp. Total Company Sales 2014-2017
8.7.3. Northrop Grumman Corp. Sales by Business Segment 2016
8.8. Saint-Gobain
8.8.1. Saint-Gobain Strength and opportunities in the Global Radome Market
8.8.2. Saint-Gobain Recent Radome Related Contracts and Programmes (2015)
8.8.3. Saint-Gobain Total Company Sales 2014-2017
8.8.4. Saint-Gobain Sales Share by Geography 2017
8.8.5. Saint-Gobain Sales by Business Segment 2017
8.9. Starwin Industries
8.9.1. Starwin Industries - Company Overview
8.9.2. Starwin Industries Strengths and Opportunities in the Global Radome Market (2018)
8.10. Vermont Composites Inc.
8.10.1. Vermont Composites Inc. Strength and opportunities in the Global Radome Market
9. Other Companies Operating in The Global Radome Market 2018
10. Conclusions and Analyst Recommendations
10.1. Key Research finding
10.2. Conclusion by Geography
10.3. Conclusion by Material Type
10.4. Conclusion by Product Type
10.5. Conclusion by Aircraft Type
10.6. Strategic Recommendations
11. Glossary
List of Tables
Table 1.1: Radome Market (US$ Mn) – Research Scope
Table 3.1: Global Radome Market Forecast 2018-2028 (US$ Mn, AGR %, CAGR %, Cumulative)
Table 4.1: Global Radome Submarket Forecast by Material Type, 2018-2028 (US$ Mn, AGR %, CAGR %)
Table 4.2: Global Radome Market Forecast 2018-2028 (US$ Mn, AGR %, CAGR %, Cumulative), By Glass-Fiber Segment
Table 4.3: Global Radome Market Forecast 2018-2028 (US$ Mn, AGR %, CAGR %), By Resin Segment
Table 4.4: Global Radome Market Forecast 2018-2028 (US$ Mn, AGR %, CAGR %), By Quartz Segment
Table 5.1: Global Radome Submarket Forecast by Product Type, 2018-2028 (US$ Mn, AGR %, CAGR %)
Table 5.2: Global Radome Market Forecast 2018-2028 (US$ Mn, AGR %, CAGR %), By Nose Mounted Radome segment
Table 5.3: Global Radome Market Forecast 2018-2028 (US$ Mn, AGR %, CAGR %), By Fuselage Mounted Radome
Table 6.1: Global Radome Submarket Forecast by Aircraft Type, 2018-2028 (US$ Mn, AGR %, CAGR %)
Table 6.2: Global Radome Market Forecast 2018-2028 (US$ Mn, AGR %, CAGR %, Cumulative), By Military Aircraft
Table 6.3: Global Radome Market Forecast 2018-2028 (US$ Mn, AGR %, CAGR %, Cumulative), By Commercial Aircraft
Table 7.1: Global Radome Market Forecast by Geography 2018-2028 (US$ Mn, AGR %, CAGR %)
Table 7.2: America Radome Market Forecast, By Material Type, 2018-2028 (US$ Mn, AGR %, CAGR %)
Table 7.3: America Radome Market Forecast, By Product Type, 2018-2028 (US$ Mn, AGR %, CAGR %)
Table 7.4: America Radome Market Forecast, By Aircraft Type, 2018-2028 (US$ Mn, AGR %, CAGR %)
Table 7.5: America Radome Market Forecast, By Country, 2018-2028 (US$ Mn, AGR %, CAGR %)
Table 7.6: U.S. Radome Market Forecast 2018-2028 (US$ Mn, AGR %, CAGR %)
Table 7.7: Canada Radome Market Forecast 2018-2028 (US$ Mn, AGR %, CAGR %)
Table 7.8: Mexico Radome Market Forecast 2018-2028 (US$ Mn, AGR %, CAGR %)
Table 7.9: Brazil Radome Market Forecast 2018-2028 (US$ Mn, AGR %, CAGR %)
Table 7.10: Europe Radome Market Forecast, By Material Type, 2018-2028 (US$ Mn, AGR %, CAGR %)
Table 7.11: Europe Radome Market Forecast, By Product Type, 2018-2028 (US$ Mn, AGR %, CAGR %)
Table 7.12: Europe Radome Market Forecast, By Aircraft Type, 2018-2028 (US$ Mn, AGR %, CAGR %)
Table 7.13: Europe Radome Market Forecast, By Country, 2018-2028 (US$ Mn, AGR %, CAGR %)
Table 7.14: Germany Radome Market Forecast 2018-2028 (US$ Mn, AGR %, CAGR %),
Table 7.15: UK Radome Market Forecast 2018-2028 (US$ Mn, AGR %, CAGR %)
Table 7.16: Russia Radome Market Forecast 2018-2028 (US$ Mn, AGR %, CAGR %)
Table 7.17: Asia Oceania Radome Market Forecast, By Material Type, 2018-2028 (US$ Mn, AGR %, CAGR %)
Table 7.18: Asia Oceania Radome Market Forecast, By Product Type, 2018-2028 (US$ Mn, AGR %, CAGR %)
Table 7.19: Asia Oceania Radome Market Forecast, By Aircraft Type, 2018-2028 (US$ Mn, AGR %, CAGR %)
Table 7.20: Asia Oceania Radome Market Forecast, By Country, 2018-2028 (US$ Mn, AGR %, CAGR %)
Table 7.21:China Radome Market Forecast 2018-2028 (US$ Mn, AGR %, CAGR %)
Table 7.22: India Radome Market Forecast 2018-2028 (US$ Mn, AGR %, CAGR %)
Table 7.23: Japan Radome Market Forecast 2018-2028 (US$ Mn, AGR %, CAGR %)
Table 7.24: South Korea Radome Market Forecast 2018-2028 (US$ Mn, AGR %, CAGR %),
Table 7.25: Middle East & Africa (MEA) Radome Market Forecast, By Material Type, 2018-2028 (US$ Mn, AGR %, CAGR %)
Table 7.26: Middle East & Africa (MEA) Radome Market Forecast, By Product Type, 2018-2028 (US$ Mn, AGR %, CAGR %)
Table 7.27: Middle East & Africa (MEA) Radome Market Forecast, By Aircraft Type, 2018-2028 (US$ Mn, AGR %, CAGR %)
Table 7.28: MEA Radome Market Forecast, By Country, 2018-2028 (US$ Mn, AGR %, CAGR %)
Table 7.29:Israel Radome Market Forecast 2018-2028 (US$ Mn, AGR %, CAGR %)
Table 7.30: Saudi Arabia Radome Market Forecast 2018-2028 (US$ Mn, AGR %, CAGR %)
Table 7.31: South Africa Radome Market Forecast 2018-2028 (US$ Mn, AGR %, CAGR %)
Table 7.32: UAE Radome Market Forecast 2018-2028 (US$ Mn, AGR %, CAGR %),
Table 8.1: Airbus S.A.S. Profile 2017 (CEO, Total Company Sales US$m, Strongest Business Region, HQ, Founded, No. of Employees, Ticker, Website)
Table 8.2: Airbus S.A.S. Recent Radome Related Contracts and Programmes 2006-2018
Table 8.3: General Dynamics Corporation 2017 (CEO, Total Company Sales US$m, Strongest Business Region, HQ, Founded, No. of Employees 2016, Ticker, Website)
Table 8.4: General Dynamics Corporation Recent Radome Related Contracts and Programmes
Table 8.5: Jenoptik AG 2017 (CEO, Total Company Sales US$m, Strongest Business Region, HQ, Founded, No. of Employees, Website)
Table 8.6: Jenoptik AG Recent Radome Related Contracts and Programmes
Table 8.7: Kitsap Composites Profile 2017 (CEO, Total Company Sales US$m, Business Segment in the Market, Submarket Involvement, HQ, Founded, No. of Employees, Website)
Table 8.8: Meggitt PLC Profile 2017 (CEO, Total Company Sales US$m, Strongest Business Region, HQ, Founded, No. of Employees, Ticker, Website)
Table 8.9: Meggitt PLC Recent Radome Related Contracts and Programmes
Table 8.10: NORDAM Group, Inc. Profile 2017 (CEO, Total Company Sales US$m, Strongest Business Region, HQ, Founded, No. of Employees, Ticker, Website)
Table 8.11: NORDAM Group, Inc. Recent Radome Related Contracts and Programmes
Table 8.12: Northrop Grumman Corp. 2018 (CEO, Total Company Sales US$m, Strongest Business Region, HQ, Founded, No. of Employees, IR Contact, Ticker, Website)
Table 8.13: Orbital ATK (Acquired by Northrop Grumman Corp.) Recent Radome Related Contracts and Programmes
Table 8.14: Saint-Gobain Profile 2017 (CEO, Total Company Sales US$m, Strongest Business Region, HQ, Founded, No. of Employees, IR Contact, Ticker, Website)
Table 8.15: Saint-Gobain Recent Radome Related Contracts and Programmes
Table 8.16: Starwin Industries Profile 2017 (CEO, Total Company Sales US$m, No. of Employees, Strongest Business Region, Founded, Website)
Table 8.17: Vermont Composites Inc. Profile 2017 (CEO, Strongest Business Region, HQ, Founded, No. of Employees, IR Contact, Ticker, Website)
Table 9.1: Other Companies
Table 10.1 Global Radome Market Summary 2017,2023, 2028 ($m, CAGR%)
Table 10.2 Global Radome Market Summary, By Geography (2017)
Table 10.3 Global Radome Market Summary, By Material Type (2017, 2028)
Table 10.4 Global Radome Market Summary, By Product Type (2017, 2028)
Table 10.5 Global Radome Market Summary, By Aircraft Type (2017, 2028)
Table: 11.1 Glossary
List of Figures
Figure 3.1: Global Radome Market Forecast 2018-2028 (US$ Mn, AGR %)
Figure 4.1: Global Radome Market AGR Forecast by Material Type 2018-2028 (AGR %)
Figure 4.2: Global Radome Submarket Forecast by Material Type 2018-2028 (US$Mn)
Figure 4.3: Global Radome Market Share Forecast by Material Type 2018 (% Share)
Figure 4.4: Global Radome Market Share Forecast by Material Type 2023 (% Share)
Figure 4.5: Global Radome Submarket Share Forecast by Material Type 2028 (% Share)
Figure 4.6: Global Radome Market Forecast by Glass-Fiber Segment 2018 – 2028 (US$ Mn)
Figure 4.7: Global Radome Market Forecast by Resin Segment 2018 – 2028 (US$m)
Figure 4.8: Global Radome Market Forecast by Quartz Segment 2018 – 2028 (US$m)
Figure 5.1: Global Radome Market AGR Forecast by Product Type 2018-2028 (AGR %)
Figure 5.2: Global Radome Submarket Forecast by Product Type 2018-2028 (US$Mn)
Figure 5.3: Global Radome Market Share Forecast by Product Type 2018 (% Share)
Figure 5.4: Global Radome Market Share Forecast by Product Type 2023 (% Share)
Figure 5.5: Global Radome Market Share Forecast by Product Type 2028 (% Share)
Figure 5.6: Global Radome Market Forecast by Nose Mounted Radome Segment 2018- 2028 (US$m)
Figure 5.7: Global Radome Market Forecast by Fuselage Mounted Radome Segment 2018 – 2028 (US$m)
Figure 6.1: Global Radome Submarket AGR Forecast by Aircraft Type 2018-2028 (AGR %)
Figure 6.2: Global Radome Submarket Forecast by Aircraft Type 2018-2028 (US$Mn)
Figure 6.3: Global Radome Submarket Share Forecast by Aircraft Type 2018 (% Share)
Figure 6.4: Global Radome Submarket Share Forecast by Aircraft Type 2023 (% Share)
Figure 6.5: Global Radome Submarket Share Forecast by Aircraft Type 2028 (% Share)
Figure 6.6: Global Radome Market Forecast by Military Aircraft Segment 2018 – 2028 (US$m)
Figure 6.7: Global Radome Market Forecast by Commercial Aircraft Segment 2018 – 2028 (US $Mn)
Figure 7.1: Global Radome Market Share Forecast by Geography 2018 – 2028 (US$m)
Figure 7.2 : Global Radome Market AGR Forecast by Geography 2018-2028 (AGR %)
Figure 7.3: Global Radome Market Share Forecast by Geography 2018 (% Share)
Figure 7.4: Global Radome Market Share Forecast by Geography 2028 (% Share)
Figure 7.5: America Radome Market Forecast, By Material Type, 2018-2028 (US$Mn)
Figure 7.6: America Radome Market Share, By Material Type, 2018 (% Share)
Figure 7.7: America Radome Market Share, By Material Type, 2028 (% Share)
Figure 7.8: America Radome Market Forecast, By Product Type, 2018-2028 (US$Mn)
Figure 7.9: America Radome Market Share, By Product Type, 2018 (% Share)
Figure 7.10: America Radome Market Share, By Product Type, 2028 (% Share)
Figure 7.11: America Radome Market Forecast, By Aircraft Type, 2018-2028 (US$Mn)
Figure 7.12: America Radome Market Share, By Aircraft Type, 2018 (% Share)
Figure 7.13: America Radome Market Share, By Aircraft Type, 2028 (% Share)
Figure 7.14: America Radome Market Forecast, By Country, 2018-2028 (US$Mn)
Figure 7.15: America Radome Market Share, By Country, 2018 (% Share)
Figure 7.16: America Radome Market Share, By Country, 2028 (% Share)
Figure 7.17: U.S. Radome Market Forecast, 2018 – 2028 (US$m)
Figure 7.18: Canada Radome Market Forecast, 2018 – 2028 (US$m)
Figure 7.19: Mexico Radome Market Forecast, 2018 – 2028 (US$m)
Figure 7.20: Brazil Radome Market Forecast, 2018 – 2028 (US$m)
Figure 7.21: Europe Radome Market Forecast, By Material Type, 2018-2028 (US$Mn)
Figure 7.22: Europe Radome Market Share, By Material Type, 2018 (% Share)
Figure 7.23: Europe Radome Market Share, By Material Type, 2028 (% Share)
Figure 7.24: Europe Radome Market Forecast, By Product Type, 2018-2028 (US$Mn)
Figure 7.25: Europe Radome Market Share, By Product Type, 2018 (% Share)
Figure 7.26: Europe Radome Market Share, By Product Type, 2028 (% Share)
Figure 7.27: Europe Radome Market Forecast, By Aircraft Type, 2018-2028 (US$Mn)
Figure 7. 28: Europe Radome Market Share, By Aircraft Type, 2018 (% Share)
Figure 7.29: Europe Radome Market Share, By Aircraft Type, 2028 (% Share)
Figure 7.30: Europe Radome Market Forecast, By Country, 2018-2028 (Revenue US$Mn)
Figure 7.31: Europe Radome Market Share, By Country, 2018 (% Share)
Figure 7.32: Europe Radome Market Share, By Country, 2028 (% Share)
Figure 7.33: Germany Radome Market Forecast, 2018 – 2028 (US$m)
Figure 7.34: UK Radome Market Forecast, 2018 – 2028 (US$m)
Figure 7.35: Russia Radome Market Forecast, 2018 – 2028 (US$m)
Figure 7.36: Asia Oceania Radome Market Forecast, By Material Type, 2018-2028 (US$Mn)
Figure 7.37: Asia Oceania Radome Market Share, By Material Type, 2018 (% Share)
Figure 7.38: Asia Oceania Radome Market Share, By Material Type, 2028 (% Share)
Figure 7.39: Asia Oceania Radome Market Forecast, By Product Type, 2018-2028 (US$Mn)
Figure 7.40: Asia Oceania Radome Market Share, By Product Type, 2018 (% Share)
Figure 7.41: Asia Oceania Radome Market Share, By Product Type, 2028 (% Share)
Figure 7.42: Asia Oceania Radome Market Forecast, By Aircraft Type, 2018-2028 (US$Mn)
Figure 7.43: Asia Oceania Radome Market Share, By Aircraft Type, 2018 (% Share)
Figure 7.44: Asia Oceania Radome Market Share, By Aircraft Type, 2028 (% Share)
Figure 7.45: Asia Oceania Radome Market Forecast, By Country, 2018-2028 (US$Mn)
Figure 7.46: Asia Oceania Radome Market Share, By Country, 2018 (% Share)
Figure 7.47: Asia Oceania Radome Market Share, By Country, 2028 (% Share)
Figure 7.48: China Radome Market Forecast, 2018 – 2028 (US$m)
Figure 7.49: India Radome Market Forecast, 2018 – 2028 (US$m)
Figure 7.50: Japan Radome Market Forecast, 2018 – 2028 (US$m)
Figure 7.51: South Korea Radome Market Forecast, 2018 – 2028 (US$m)
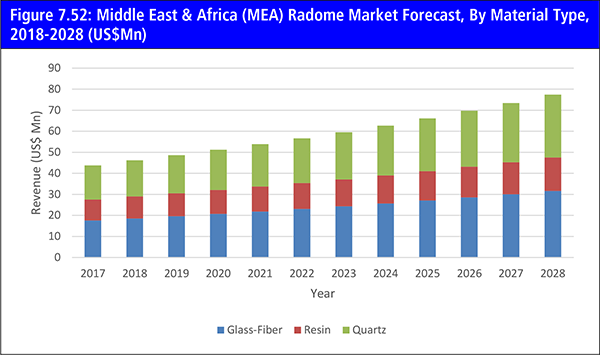
Figure 7.52: Middle East & Africa (MEA) Radome Market Forecast, By Material Type, 2018-2028 (US$Mn)
Figure 7.53: Middle East & Africa (MEA) Radome Market Share, By Material Type, 2018 (% Share)
Figure 7.54: Middle East & Africa (MEA) Radome Market Share, By Material Type, 2028 (% Share)
Figure 7.55: Middle East & Africa (MEA) Radome Market Forecast, By Product Type, 2018-2028 (US$Mn)
Figure 7.56: Middle East & Africa (MEA) Radome Market Share, By Product Type, 2018 (% Share)
Figure 7.57: Middle East & Africa (MEA) Radome Market Share, By Product Type, 2028 (% Share)
Figure 7.58: Middle East & Africa (MEA) Radome Market Forecast, By Aircraft Type, 2018-2028 (US$Mn)
Figure 7.59: Middle East & Africa (MEA) Radome Market Share, By Aircraft Type, 2018 (% Share)
Figure 7.60: Middle East & Africa (MEA) Radome Market Share, By Aircraft Type, 2028 (% Share)
Figure 7.61: MEA Radome Market Forecast, By Country, 2018-2028 (US$Mn)
Figure 7.62: MEA Radome Market Share, By Country, 2018 (% Share)
Figure 7.63: MEA Radome Market Share, By Country, 2028 (% Share)
Figure 7.64: Israel Radome Market Forecast, 2018 – 2028 (US$m)
Figure 7.65: Saudi Arabia Radome Market Forecast, 2018 – 2028 (US$m)
Figure 7.66: South Africa Radome Market Forecast, 2018 – 2028 (US$m)
Figure 7.67: UAE Radome Market Forecast, 2018 – 2028 (US$m)
Figure 8.1 Airbus S.A.S. Revenue (US$ Mn) 2014 – 2017
Figure 8.2 Airbus S.A.S. Revenues Share by Business Segment 2017
Figure 8.3 Airbus S.A.S. Revenue Share by Geography 2017
Figure 8.4 General Dynamics Corporation Revenue (US$ Mn) 2014 - 2017
Figure 8.5 General Dynamics Corporation Revenues Share by Business Segment 2017
Figure 8.6 General Dynamics Corporation Revenue Share by Geography 2017
Figure 8.7 Jenoptik AG Revenue (US$ Mn) 2014 - 2017
Figure 8.8 Jenoptik AG Revenue Share by Geography 2017
Figure 8.9 Jenoptik AG Revenue Share by Business Segment 2017
Figure 8.10 Meggitt PLC Total Company Sales 2014-2017 (US$Mn)
Figure 8.11 Meggitt PLC Revenue Share by Geography 2017
Figure 8.12 Meggitt PLC Revenue Share by Business Segment 2017
Figure 8.13 Northrop Grumman Corp. Total Company Sales 2014-2017 (US$ Mn)
Figure 8.14 Northrop Grumman Corp. Revenue Share by Business Segment 2017
Figure 8.15 Saint-Gobain Total Company Sales 2014-2017 (US$m)
Figure 8.16 Saint-Gobain Revenue Share by Geography 2017
Figure 8.17 Saint-Gobain Revenue Share by Business Segment 2017
Aer Lingus
Air Arabia
Air France
Airbus
American Airlines
Astronics Corporation
ATK
Aviation Technical Services
AVIC
BAE Systems
Bell Helicopter Textron
Boeing
Bombardier
British Airways
CAC
Cessna
China Airlines
Cobham PLC
Communications & Power Industries
Comtech Telecommunications.
CPI
Curtiss Wright
Dassault Aviation
Delphi
Delta Air Lines
Drukair
EDAC
Embraer
Emirates
ESSA Technology
ESSCO
Etihad
Fds Italy Srl
FedEx
Finmeccanica
Flir Systems (Raymarine)
General Dynamics Corporation
GoGo
Greenbriar Equity Group
Gulf Air
Gulfstream Aerospace
Harbin Topfrp Composite Co., Ltd (HTC)
Iberia
Indigo Airlines
Infinite Technologies
Inmarsat
Jenoptik
Kaman Aerospace Group
Kelvin Hughes
Kitsap Composites
Kuwait Airways
L3 Technologies
Leonardo
Lockheed Martin
Lufthansa Group
Lufthansa Technik
Meggitt PLC
Meggitt Polymers & Composites
Nordam Asia Limited
Nordam Group Inc.
Northrop Grumman Corporation
Pacific Radomes Inc.
Pilatus
Pratt & Whitney Canada
Qatar Airways
Radant Technologies
Royal DSM
Royal Engineered Composites
SAE
Saint-Gobain
Saint-Gobain Aerospace
Saudia
Sheergard
Southwest Airlines
Starwin Industries
TenCate Advanced Composites
UPS
US Airways
Verdant
Vermont Composites Inc.
Organisations mentioned
Brazilian Armed Forces
Civil Aviation Administration of China (CAAC)
European Aviation Safety Agency (EASA)
Federal Aviation Administration (FAA)
International Air Transport Association (IATA)
Mexican Air Force
NATO
Tulsa International Airport
U.S. Air Force
U.S. Army
U.S. Department of Defence
U.S. Navy
UK MoD
