• CACI gets $907m Army intelligence analysis task order
• DynCorp International awarded 9-month extension to continue supporting US Army in Afghanistan
• Securitas wins contract to protect O2
These are just some of the business-critical headlines that have surfaced about your industry in the past 12 months. How are you, and your company, reacting to news such as this? By ordering and reading our new report today, you will be fully informed and ready to act.
What does the future hold for the Private Military & Security Services market?
Visiongain’s new study supplies the answer to you and provides it to you NOW.
In this new, 121-page report, you will receive over 100 tables and charts as well as independent, impartial and objective analysis.
By ordering and reading this report today, you will be given:
• A concise and comprehensive analysis of the Private Military & Security Services market from 2020 to 2030.
• An understanding of not only the financial prospects of the PMSCs industry but also the growth potential of several submarkets – including different domain and provider types.
• An informed forecast of the sales of six individual countries – United States, United Kingdom, Germany, China, India and Australia.
• A description of the main drivers and restraints that are affecting the development of the PMSCs market.
• Profiles of the key players in the industry as well as up-to-date information on their latest financial performances and product offerings.
Who should read this report?
• Senior Executives
• Business Development Managers
• Marketing Directors
• Consultants
• Chief Executive Officers
Governments, agencies & organisations actively working or interested in the Private Military & Security Services industry will also find significant value in our research.
Predictions for the global market and submarkets – what’s possible?
Along with an evaluation of the current level of international investment in the PMSCs market, this report provides measured forecasts for four submarkets covering the period 2020 to 2030.
• Private Military & Security Services Market by Service Type, 2020-2030
• Land-Based Security Submarket Forecast, 2020-2030
• Specialised Maritime Security Submarket Forecast, 2020-2030
• Duel Land-Maritime Submarket Forecast, 2020-2030
• Private Military & Security Services Market by Provider Type, 2020-2030
• Private Military Submarket Forecast, 2020-2030
• Private Security Submarket Forecast, 2020-2030
• Private Military & Security Services Market by Country, 2020-2030
• United States Submarket Forecast, 2020-2030
• United Kingdom Submarket Forecast, 2020-2030
• Germany Submarket Forecast, 2020-2030
• China Submarket Forecast, 2020-2030
• India Submarket Forecast, 2020-2030
• Australia Submarket Forecast, 2020-2030
• Rest of World Submarket Forecast, 2020-2030
Buy our report today Private Military & Security Services (PMSCs) Market Report: Forecasts by Service Type (Land-Based Security, Specialised Maritime Security, and Duel Land-Maritime), by Provider Type (Private Security Companies and Private Military Companies), and by Country (United States, United Kingdom, Germany, China, India, Australia, and Rest of World). Plus, Analysis of the Leading Players in the Market Space. Avoid missing out by staying informed – order our report now.
Visiongain is a trading partner with the US Federal Government
CCR Ref number: KD4R6
Do you have any custom requirements we can help you with? Any need for specific country, geo region, market segment or specific company information? Contact us today, we can discuss your needs and see how we can help: sara.peerun@visiongain.com
1. Report Overview
1.1 Private Military & Security Services Market Brief Overview
1.2 Why You Should Read This Report
1.3 How This Report Delivers
1.4 Key Questions Answered by This Analytical Report
1.5 Who is This Report For?
1.6 Methodology
1.6.1 Secondary Research
1.6.2 Market Evaluation & Forecasting Methodology
1.7 Frequently Asked Questions (FAQs)
1.8 Associated Visiongain Reports
1.9 About Visiongain
2. Introduction to the Private Military & Security Services Market
2.1 Private Military & Security Services Market Structure
2.2 Private Military & Security Services Market Definition
2.3 Significant Current & Future Developments in the Private Military & Security Services Market
2.3.1 Closed Circuit Television Technology, Alarm Systems & Access Control
2.3.2 Artificial Intelligence & Robotics
2.3.3 Internet of Things (IoT)
2.3.4 Drone Surveillance
2.3.5 3D – Printing
3. Private Military & Security Services Market, 2020-2030
3.1 Global Private Military & Security Services Market Forecast, 2020-2030
3.2 Global Private Military & Security Services Market Drivers & Restraints, 2020
3.2.1 Sources of Growth & Contraction in the Global Private Military & Security Services Market
4. Private Military & Security Services Submarket Forecast, Provider Type, 2020-2030
4.1 Private Military Submarket Analysis
4.2 Private Security Submarket Analysis
5. Private Military & Security Services Submarket Forecast, Service Type, 2020-2030
5.1 Land-Based Security Submarket Analysis
5.2 Specialised Maritime Security Submarket Analysis
5.3 Duel (Land-Based Security & Specialised Maritime Security) Submarket Analysis
6. Regional Private Military & Security Services Market Forecasts, 2020-2030
6.1 Private Military & Security Services Market Share, 2020-2030
6.2 United States Private Military & Security Services, Market Forecast, 2020-2030
6.2.1 United States Private Military & Security Services Market – Contracts & Programmes
6.2.2 United States Private Military & Security Services Market – Analysis
6.2.3 United States Private Military & Security Services Market – Drivers & Restraints
6.3 United Kingdom Private Military & Security Services, Market Forecast, 2020-2030
6.3.1 United Kingdom Private Military & Security Services Market – Contracts & Programmes
6.3.2 United Kingdom Private Military & Security Services Market – Analysis
6.3.3 United Kingdom Private Military & Security Services Market – Drivers & Restraints
6.4 Germany Private Military & Security Services, Market Forecast, 2020-2030
6.4.1 German Private Military & Security Services Market – Contracts & Programmes
6.4.2 German Private Military & Security Services Market – Analysis
6.4.3 German Private Military & Security Services Market – Drivers & Restraints
6.5 China Private Military & Security Services, Market Forecast, 2020-2030
6.5.1 Chinese Private Military & Security Services Market – Contracts & Programmes
6.5.2 Chinese Private Military & Security Services Market – Analysis
6.5.3 Chinese Private Military & Security Services Market – Drivers & Restraints
6.6 India Private Military & Security Services, Market Forecast, 2020-2030
6.6.1 Indian Private Military & Security Services Market – Contracts & Programmes
6.6.2 Indian Private Military & Security Services Market – Analysis
6.6.3 Indian Private Military & Security Services Market – Drivers & Restraints
6.7 Australia Private Military & Security Services, Market Forecast, 2020-2030
6.7.1 Australian Private Military & Security Services Market – Contracts & Programmes
6.7.2 Australian Private Military & Security Services Market – Analysis
6.7.3 Australian Private Military & Security Services Market – Drivers & Restraints
6.8 Rest of World Private Military & Security Services, Market Forecast, 2020-2030
6.8.1 RoW Private Military & Security Services Market – Contracts & Programmes
6.8.2 RoW Private Military & Security Services Market – Analysis
6.8.3 RoW Private Military & Security Services Market – Drivers & Restraints
7. Private Military & Security Services Market, SWOT Analysis
7.1 Strengths of the Private Military & Security Services Market
7.1.1 Increased Demand from Emerging Economies
7.1.2 Possible Utilisation of Private Military & Security Services
7.1.3 Growing Need For Technologically Advanced Products and Services
7.2 Weaknesses of the Private Military & Security Services Market
7.2.1 Rise in competition
7.2.2 Changes in the Economic Landscape
7.3 Opportunities in the Private Military & Security Services Market
7.3.1 Rise in Criminal and Terrorist Activities
7.3.2 Increased Armed Forces Expeditionary Operations
7.3.3 Layoffs of Experienced Military Personnel
7.4 Threats to the Private Military & Security Services Market
7.4.1 Risks Associated with New Technologically Advanced Products
7.4.2 Stringent Government Policies and Regulations
8. Private Military & Security Services Market, PEST Analysis
9. Leading Private Military & Security Services Companies
9.1 Academi
9.1.1 Academi Recent Contracts
9.1.2 Academi Mergers & Acquisitions
9.1.3 Academi Overview
9.2 Booz Allen Hamilton
9.2.1 Booz Allen Hamilton Recent Contracts
9.2.2 Booz Allen Hamilton Total Company Sales, 2016-2019
9.2.3 Booz Allen Hamilton Net Income, 2016-2019
9.2.4 Booz Allen Hamilton Subsidiaries
9.2.5 Booz Allen Hamilton Mergers & Acquisitions
9.2.6 Booz Allen Hamilton Overview
9.3 CACI International
9.3.1 CACI International Recent Contracts
9.3.2 CACI International Total Company Sales, 2016-2019
9.3.3 CACI International Net Income, 2016-2019
9.3.4 CACI International Mergers & Acquisitions
9.3.5 CACI International Overview
9.4 DynCorp International
9.4.1 DynCorp International Recent Contracts
9.4.2 DynCorp International Total Company Sales, 2014-2018
9.4.3 DynCorp International Sales, by Segment of Business, 2015-2018
9.4.4 DynCorp International Net Income, 2015-2018
9.4.5 DynCorp International Sales, by Geographical Region, 2013-2017
9.4.6 DynCorp International Overview
9.5 Erinys International
9.5.1 Erinys International Recent Contracts
9.5.2 Erinys International Overview
9.6 GardaWorld Corporation
9.6.1 GardaWorld Corporation Recent Contracts
9.6.2 GardaWorld Corporation Mergers & Acquisitions
9.6.3 GardaWorld Corporation Overview
9.7 G4S Plc
9.7.1 G4S Plc Recent Contracts
9.7.2 G4S Plc Total Company Sales, 2015-2018
9.7.3 G4S Plc Sales, by Segment of Business, 2015-2018
9.7.4 G4S Plc Net Income, 2015-2018
9.7.5 G4S Plc Sales, by Geographical Region, 2016-2018
9.7.6 G4S Plc Mergers & Acquisitions
9.7.7 G4S Plc Overview
9.8 International Intelligence Limited
9.8.1 International Intelligence Limited Subsidiaries
9.8.2 International Intelligence Limited Overview
9.9 KBR
9.9.1 KBR Recent Contracts
9.9.2 KBR Total Company Sales, 2015-2018
9.9.3 KBR Sales, by Segment of Business, 2015-2018
9.9.4 KBR Net Income, 2015-2018
9.9.5 KBR Mergers & Acquisitions
9.9.6 KBR Overview
9.10 Prosegur
9.10.1 Prosegur Recent Contracts
9.10.2 Prosegur Total Company Sales, 2015-2018
9.10.3 Prosegur Sales, by Segment of Business, 2015-2018
9.10.4 Prosegur Net Income, 2015-2018
9.10.5 Prosegur Sales, by Geographical Region, 2015-2018
9.10.6 Posegur Mergers & Acquisitions
9.10.7 Prosegur Overview
9.11 Securitas AB
9.11.1 Securitas AB Recent Contracts
9.11.2 Securitas AB Total Company Sales, 2015-2018
9.11.3 Securitas AB Sales, by Segment of Business, 2015-2018
9.11.4 Securitas AB Net Income, 2015-2018
9.11.5 Securitas AB Mergers & Acquisitions
9.11.6 Securitas AB Overview
9.12 The Brink’s Company
9.12.1 The Brink’s Company Recent Contracts
9.12.2 The Brink’s Company Total Company Sales, 2015-2018
9.12.3 The Brink’s Company Sales, by Segment of Business, 2015-2018
9.12.4 The Brink’s Company Net Income, 2015-2018
9.12.5 The Brink’s Company Mergers & Acquisitions
9.12.6 The Brink’s Company Overview
9.13 Unity Resources Group
9.13.1 Unity Resources Group Recent Contracts
9.13.2 Unity Resources Group Overview
9.14 Other Companies Operating in the Private Military & Security Services Industry, 2020
10. Conclusions and Recommendations
11. Glossary
Associated Visiongain Reports
Appendix A
About Visiongain
Appendix B
Visiongain Report Evaluation Form
List of Tables
Table 3.01 Private Military & Security Services Market Forecast, 2020-2030 (US$m, AGR %, CAGR %, Cumulative)
Table 3.02 Private Military & Security Services Market Drivers & Restraints, 2020
Table 4.01 Private Military & Security Services, by Provider Type, Submarket Forecast, 2020-2030 (US$m, AGR %, CAGR %, Cumulative)
Table 5.01 Private Military & Security Services, by Service Type, Submarket Forecast, 2020-2030 (US$m, AGR %, CAGR %, Cumulative)
Table 6.01 Leading National Private Military & Security Services Market Forecast, 2020-2030 (US$m, Global AGR %, Cumulative)
Table 6.02 United States Private Military & Security Services Market, Major Contracts & Programmes, 2011-2019
Table 6.03 United States Private Military & Security Services Market Drivers & Restraints, 2020
Table 6.04 United Kingdom Private Military & Security Services Market, Major Contracts & Programmes, 2015-2016
Table 6.05 United Kingdom Private Military & Security Services Market Drivers & Restraints, 2020
Table 6.06 German Private Military & Security Services Market, Major Contracts & Programmes
Table 6.07 German Private Military & Security Services Market Drivers & Restraints, 2020
Table 6.08 Chinese Private Military & Security Services Market, Major Contracts & Programmes, 2012-2016
Table 6.09 Chinese Private Military & Security Services Market Drivers & Restraints, 2020
Table 6.10 Indian Private Military & Security Services Market, Major Contracts & Programmes
Table 6.11 Indian Private Military & Security Services Market Drivers & Restraints, 2020
Table 6.12 Australian Private Military & Security Services Market, Major Contracts & Programmes, 2006-2016
Table 6.13 Australian Private Military & Security Services Market Drivers & Restraints, 2020
Table 6.14 RoW Private Military & Security Services Market, Major Contracts & Programmes, 2012-2018
Table 6.15 RoW Private Military & Security Services Market Drivers & Restraints, 2020
Table 8.01 Private Military & Security Services Market, PEST Analysis, 2020-2030
Table 9.01 Leading Military & Private Security Companies in the Market Space
Table 9.02 Academi Profile 2019
Table 9.03 Academi Contracts, 2010-2015 (Date, Country, Value, Details)
Table 9.04 Academi M&A Activity
Table 9.05 Booz Allen Hamilton Profile
Table 9.06 Booz Allen Hamilton Contracts, 2015-2019 (Date, Country, Value, Details)
Table 9.07 Booz Allen Hamilton Subsidiaries & Respective Locations
Table 9.08 Booz Allen Hamilton M&A Activity
Table 9.09 CACI International Profile
Table 9.10 CACI International Contracts, 2018-2019 (Date, Country, Value, Details)
Table 9.11 CACI International M&A Activity
Table 9.12 DynCorp International Profile
Table 9.13 DynCorp International Contracts, 2009-2019 (Date, Country, Value, Details)
Table 9.14 DynCorp International Subsidiaries & Respective Locations
Table 9.15 Erinys International Profile
Table 9.16 Erinys International Contracts (Date, Country, Value, Details)
Table 9.17 GardaWorld Corporation Profile
Table 9.18 GardaWorld Corporation Contracts, 2003-2017 (Date, Country, Subcontractor, Details)
Table 9.19 GardaWorld Corporation M&A Activity
Table 9.20 G4S Plc Profile
Table 9.21 G4S Plc Contracts, 2015-2016 (Date, Country, Value, Details)
Table 9.22 G4S Plc Subsidiaries & Respective Locations
Table 9.23 G4S Plc M&A Activity
Table 9.24 International Intelligence Limited Profile
Table 9.25 International Intelligence Limited Subsidiaries & Respective Locations
Table 9.26 KBR Profile
Table 9.27 KBR Contracts, 2016-2019 (Date, Country, Value, Details)
Table 9.28 KBR Subsidiaries & Respective Locations
Table 9.29 KBR M&A Activity
Table 9.30 Prosegur Profile
Table 9.31 Prosegur Contracts (Date, Country, Value US$m, Details)
Table 9.32 Prosegur Subsidiaries & Respective Locations
Table 9.33 Prosegur M&A Activity
Table 9.34 Securitas AB Profile
Table 9.35 Securitas AB Contracts, 2012-2017 (Date, Country, Value, Details)
Table 9.36 Securitas AB Subsidiaries & Respective Locations
Table 9.37 Securitas AB M&A Activity
Table 9.38 The Brink’s Company Profile
Table 9.39 The Brink’s Company Contracts 2017-2018 (Date, Country, Value, Details)
Table 9.40 The Brink’s Company Subsidiaries & Respective Locations
Table 9.41 The Brink’s Company M&A Activity
Table 9.42 Unity Resources Group Profile
Table 9.43 Unity Resources Group Contracts (Date, Country, Value, Details)
Table 9.44 Unity Resources Group Subsidiaries & Respective Locations
Table 9.45 Other Companies Involved in the Private Military & Security Services Market Space, 2020
List of Figures
Figure 2.01 Private Military & Security Services Market Segmentation Overview
Figure 3.01 Private Military & Security Services Market Forecast, 2020-2030 (US$m, AGR %)
Figure 4.01 Private Military & Security Services, by Provider Type, Submarket AGR Forecast, 2020-2030
Figure 4.02 Private Military & Security Services, by Provider Type, Submarket Forecast, 2020-2030 (US$m, Global AGR %)
Figure 4.03 Private Military & Security Services, by Provider Type, Submarket Share, 2020
Figure 4.04 Private Military & Security Services, by Provider Type, Submarket Share, 2025
Figure 4.05 Private Military & Security Services, by Provider Type, Submarket Share, 2030
Figure 5.01 Private Military & Security Services, by Service Type, Submarket AGR Forecast, 2020-2030
Figure 5.02 Private Military & Security Services, by Service Type, Submarket Forecast, 2020-2030 (US$m, Global AGR %)
Figure 5.03 Private Military & Security Services, by Service Type, Submarket Share Forecast, 2020
Figure 5.04 Private Military & Security Services, by Service Type, Submarket Share Forecast, 2025
Figure 5.05 Private Military & Security Services, by Service Type, Submarket Share Forecast, 2030
Figure 6.01 Private Military & Security Services Market Forecast, by Nation, 2020-2030 (US$m, Global AGR %)
Figure 6.02 Private Military & Security Services AGR Forecast, by Nation, 2020-2030
Figure 6.03 Private Military & Security Services Market Share, by National, 2020
Figure 6.04 Private Military & Security Services Market Share, by National, 2025
Figure 6.05 Private Military & Security Services Market Share, by National, 2030
Figure 6.06 United States Private Military & Security Services, Market Forecast, 2020-2030
Figure 6.07 United Kingdom Private Military & Security Services Market Forecast, 2020-2030
Figure 6.08 German Private Military & Security Services Market Forecast, 2020-2030
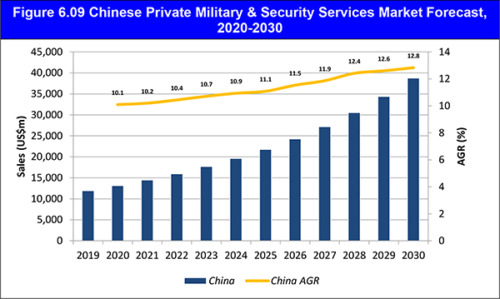
Figure 6.09 Chinese Private Military & Security Services Market Forecast, 2020-2030
Figure 6.10 Indian Private Military & Security Services Market Forecast, 2020-2030
Figure 6.11 Australian Private Military & Security Services Market Forecast, 2020-2030
Figure 6.12 RoW Private Military & Security Services Market Forecast, 2020-2030
Figure 9.01 Booz Allen Hamilton Total Company Sales, 2016-2019 (US$m, AGR %)
Figure 9.02 Booz Allen Hamilton Net Income, 2016-2019 (US$m, AGR %)
Figure 9.03 CACI International Total Company Sales, 2016-2019 (US$m, AGR %)
Figure 9.04 CACI International Net Income, 2016-2019 (US$m, AGR %)
Figure 9.05 DynCorp International Total Company Sales, 2014-2018 (US$m, AGR %)
Figure 9.06 DynCorp International Sales, by Segment of Business, 2015-2018 (US$m, Total Company Sales AGR %)
Figure 9.07 DynCorp International Net Income, 2015-2018 (US$m, AGR %)
Figure 9.08 DynCorp International Sales, by Geographical Location, 2013-2017 (US$m, Total Company Sales AGR %)
Figure 9.09 G4S Plc Total Company Sales, 2015-2018 (US$m, AGR %)
Figure 9.10 G4S Plc Sales, by Segment of Business, 2015-2018 (US$m, Total Company Sales AGR %)
Figure 9.11 G4S Plc Net Income, 2015-2018 (US$m, AGR %)
Figure 9.12 G4S Plc Sales, by Geographical Region, 2016-2018 (US$m, Total Company Sales AGR %)
Figure 9.13 KBR Total Company Sales, 2015-2018 (US$m, AGR %)
Figure 9.14 KBR Sales, by Segment of Business, 2015-2018 (US$m, Total Company Sales AGR %)
Figure 9.15 KBR Net Income, 2015-2018 (US$m, AGR %)
Figure 9.16 KBR Sales, by Geographical Location, 2015-2018 (US$m, Total Company Sales AGR %)
Figure 9.17 Prosegur Total Company Sales, 2015-2018 (US$m, AGR %)
Figure 9.18 Prosegur Sales, by Segment of Business, 2015-2018 (US$m, Total Company Sales AGR %)
Figure 9.19 Prosegur Net Income 2015-2018 (US$m, AGR %)
Figure 9.20 Prosegur Sales by Geographical Location (US$m, Total Company Sales AGR %) 2015-2018
Figure 9.21 Securitas AB Total Company Sales, 2015-2018 (US$m, AGR %)
Figure 9.22 Securitas AB Sales, by Segment of Business, 2015-2018 (US$m, Total Company Sales AGR %)
Figure 9.23 Securitas AB Net Income, 2015-2018 (US$m, AGR %)
Figure 9.24 The Brink’s Company Total Company Sales, 2015-2018 (US$m, AGR %)
Figure 9.25 The Brink’s Company Sales, by Segment of Business, 2015-2018 (US$m, Total Company Sales AGR %)
Figure 9.26 The Brink’s Company Net Income, 2015-2018 (US$m, AGR %)
 Market Report 2020-2030")