Industries > Pharma > OTC Drugs & Dietary Supplements Market Report 2020-2030

OTC Drugs & Dietary Supplements Market Report 2020-2030
Forecasts by Product Type (Branded Drugs, Generic Drugs), by Category (Cough, Cold and Flu Drugs, Analgesics, Dermatological, Vitamins, Minerals and Dietary Supplements, Weight Loss/Diet Products, Gastrointestinal Drugs), by Distribution Channel (Pharmacies/Drugstores, Supermarkets/Hypermarkets, Convenience Stores, Online Drugstores, Health Food Stores), by Dosage Form (Tablets, Hard Capsules, Powders, Ointments, Soft Capsules, Liquids, Other Dosage Forms). PLUS, Analysis of Leading Regional and National Markets and Profiles of Leading OTC Drugs Companies
Global OTC Drugs and Dietary Supplements Market 2020 to 2030–our new study reveals trends, R&D progress, and predicted revenues
What has led the pharmaceutical companies to switch to OTC medicines?
The increasing rates of patent expiry lead to a counter-strategy of switching companies from Rx to OTC. In the US, according to the Consumer Healthcare Products Association, approximately 106 ingredients and dosage strengths have undergone a change from Rx to OTC to around 700 OTC products on the market.
Why are dietary supplements and OTC drugs gain massive global traction?
The increasing self-medication appetite of consumers and the alarming necessity to reduce healthcare costs is boosting the global market. In developed regions, lifestyle associated OTC medications, including weight loss products and sleep aid are highly popular. The classic seasonal trend in demand for OTC cold, cough and flu drugs will drive steady growth over time.
How do prominent players strengthen their position throughout the world?
You must read this newly updated report if you are involved in this sector. The report from Visiongain shows you potential revenues up to 2030, evaluate information, trends, opportunities and business outlooks.
Discover how to stay ahead
Our 742 pages report provides 614 tables and charts/graphs. Read on to discover the most lucrative areas in the industry and the future market prospects. Our new study lets you assess forecasted sales at overall world market and regional level. See financial results, trends, opportunities, and revenue predictions. Much opportunity remains in this growing Global OTC Drugs and Dietary Supplements Market. See how to exploit the opportunities.
This report includes data analysis and invaluable insight into how COVID-19 will affect your industry. Access this report today.
To access the data contained in this document please email contactus@visiongain.com
Forecasts to 2030 and other analyses reveal the commercial prospects
• In addition to revenue forecasting to 2030, our new study provides you with recent results, growth rates, and market shares.
• You find original analyses, with business outlooks and developments.
• Discover qualitative analyses (including market dynamics, drivers, opportunities, restraints and challenges), product profiles and commercial developments.
Discover sales predictions for the world market and submarkets
By Product Type
• Branded Drugs
• Generic Drugs
By Category
• Cough
• Cold and Flu Drugs
• Analgesics
• Dermatological
• Vitamins and Minerals
• Weight Loss/Diet Product
• Gastrointestinal Drugs
By Distribution Channel
• Pharmacies/Drugstores
• Supermarkets/Hypermarkets
• Convenience Stores
• Online Drugstores
• Health Food Stores
By Dosage Form
• Tablets
• Hard Capsules
• Powders
• Ointments
• Soft Capsules
• Liquids
• Other Dosage Forms

In addition to the revenue predictions for the overall world market and segments, you will also find revenue forecasts for 5 regional and 20 leading national markets:
• North America
– U.S.
– Canada
• Europe
– Germany
– France
– United Kingdom
– Italy
– Spain
– Rest of Europe
• Asia Pacific
– China
– Japan
– India
– Australia
– South Korea
– Rest of Asia Pacific
• Latin America
– Brazil
– Mexico
– Argentina
– Rest of Latin America
• Middle East and Africa
– Turkey
– Saudi Arabia
– South Africa
– UAE
– Qatar
– Rest of Middle East and Africa
The report also includes profiles and for some of the leading companies in the Global OTC Drugs and Dietary Supplements Market, with a focus on this segment of these companies’ operations.
Leading companies and the potential for market growth
Overall world revenue for Global OTC Drugs and Dietary Supplements Market will surpass $xx million in 2020, our work calculates. We predict strong revenue growth through to 2030. Our work identifies which organizations hold the greatest potential. Discover their capabilities, progress, and commercial prospects, helping you stay ahead.
Leading companies featured in this report include:
• Abbott Laboratories
• ASKA Pharmaceutical Co., Ltd.
• Fresenius SE & Co KGaA
• H. Lundbeck A/S
• Lupin Pharmaceuticals
• Mylan NV
• Nippon Chemiphar Co., Ltd.
• Novartis AG
• Pfizer Inc.
• Roche Holding
• Sanofi SA
• Sun Pharmaceutical Industries Ltd
• Taisho Pharmaceutical Holdings Co Ltd
• Teva Pharmaceuticals
How the Global OTC Drugs and Dietary Supplements Market report helps you
In summary, our 700+ page report provides you with the following knowledge:
• Revenue forecasts to 2030 for Global OTC Drugs and Dietary Supplements Market, with forecasts for Product Type, Category, Dosage Form, Distribution Channel, Application, each forecasted at a global and regional level– discover the industry’s prospects, finding the most lucrative places for investments and revenues
• Revenue forecasts to 2030 for 5 regional and 20 key national markets – See forecasts for the Global OTC Drugs and Dietary Supplements market in North America, Europe, Asia-Pacific, Middle East & Africa, and Latin America. Also forecasted is the market in the US, Canada, Argentina, Brazil, Germany, France, UK, Italy, Spain, China, India, Japan, and Australia among other prominent economies.
• Prospects for established firms and those seeking to enter the market– including company profiles for 15 of the major companies involved in the Global OTC Drugs and Dietary Supplements Market. Some of the companies profiled in this report include Taisho Pharmaceutical Holdings Co., Ltd., Nippon Chemiphar Co., Ltd., H Lundbeck A/S, ASKA Pharmaceutical Co., Ltd., Teva Pharmaceutical Industries Limited, Novartis AG, Pfizer Inc., Mylan N.V., Abbott Laboratories, Fresenius SE & Co KGaA, Sun Pharmaceutical Industries Limited, Sanofi, Roche Holding AG (Roche), Lupin Limited.
Find quantitative and qualitative analyses with independent predictions. Receive information that only our report contains, staying informed with this invaluable business intelligence.
Information found nowhere else
With our newly report title, you are less likely to fall behind in knowledge or miss out on opportunities. See how our work could benefit your research, analyses, and decisions. Visiongain’s study is for everybody needing commercial analyses for the Global OTC Drugs and Dietary Supplements Market and leading companies. You will find data, trends and predictions.
To access the data contained in this document please email contactus@visiongain.com
Buy our report today OTC Drugs & Dietary Supplements Market Report 2020-2030: Forecasts by Product Type (Branded Drugs, Generic Drugs), by Category (Cough, Cold and Flu Drugs, Analgesics, Dermatological, Vitamins, Minerals and Dietary Supplements, Weight Loss/Diet Products, Gastrointestinal Drugs), by Distribution Channel (Pharmacies/Drugstores, Supermarkets/Hypermarkets, Convenience Stores, Online Drugstores, Health Food Stores), by Dosage Form (Tablets, Hard Capsules, Powders, Ointments, Soft Capsules, Liquids, Other Dosage Forms). PLUS, Analysis of Leading Regional and National Markets and Profiles of Leading OTC Drugs Companies. Avoid missing out by staying informed – order our report now.
Visiongain is a trading partner with the US Federal Government
CCR Ref number: KD4R6
Do you have any custom requirements we can help you with? Any need for a specific country, geo region, market segment or specific company information? Contact us today, we can discuss your needs and see how we can help: sara.peerun@visiongain.com
1. Report Overview
1.1 Global OTC Drugs & Dietary Supplements Market Overview
1.2 Market Definitions
1.2.1 OTC Drugs
1.2.2 Dietary Supplements (VMS)
1.3 Why You Should Read This Report
1.4 How This Report Delivers
1.5 Key Questions Answered by This Analytical Report Include:
1.6 Who is This Report For?
1.7 Methodology
1.7.1 Primary Research
1.7.2 Secondary Research
1.8 COIVD-19 Impact Recovery Pattern Analysis
1.8.1 V-Shaped Recovery
1.8.2 U-Shaped Recovery
1.8.3 W-Shaped Recovery
1.8.4 L-Shaped Recovery
1.9 Market Segmentation
1.10 Frequently Asked Questions (FAQ)
1.11 Associated Visiongain Reports
2. Executive Summary
2.1 Segmental Insights
2.2 COIVD Impact on OTC Product Sales
3. Introduction to OTC Pharmaceuticals
3.1 What Are OTC Pharmaceuticals?
3.2 Classification of OTC Pharmaceuticals
3.3 What are the Requirements for an OTC Pharmaceutical Drug?
3.4 OTC Switching
3.4.1 How Is a Drug Switched from Prescription to OTC?
3.4.2 Manufacturing and Distribution of OTC Pharmaceuticals
3.5 Regulation of OTC Pharmaceuticals
3.5.1 Regulation of OTC Pharmaceuticals in the US
3.5.2 Regulation of OTC Pharmaceuticals in Japan: Deregulating the Sales of OTCs
3.5.3 Regulations of OTC Pharmaceuticals in Europe
3.5.4 Regulation of OTC Pharmaceuticals in China
3.5.5 Regulation of OTC Pharmaceuticals in Other Countries
4. Market Dynamics
4.1 COVID-19 Impact on Pharmaceutical Manufacturing Market
4.2 Market Drivers for OTC Drugs
4.2.1 Prevalence Of Self-Care
4.2.2 Burden On Public Health System
4.2.3 Retain Market Leadership
4.2.4 Effective Distribution Networks Due to Expansion of Retail Pharmacy and Alternative Distributors
4.2.5 Manufacturers Can Reap OTC Sales Benefits
4.2.6 Third Party Payers: Reducing the Cost Burden
4.2.7 Healthcare Systems: Pushing the Cost to the Consumer
4.2.8 Many Pharmaceutical Companies Have a Strong Potential OTC Portfolio
4.2.9 Regulators are Encouraging OTC Approvals
4.2.10 Deterring the Consumption of Counterfeit Drugs
4.2.11 Cultural Changes Will Support Self-Medication with OTC Medicines
4.3 Market Drivers for Dietary Supplement
4.3.1 Increase Education Campaigns on the Importance Of Dietary Supplement Quality
4.3.2 Increasing Demand from Consumer Side
4.3.3 Presence of a Large Number of Manufacturers in the Market
4.4 Market Growth Restraining Factors
4.4.1 Pharma Companies Remain Focused on Prescription Drugs
4.4.2 Manufacturing Problems Affects Sales and Reputation of OTC Drugs
4.4.3 OTC Products are Vulnerable to Price Controls by Governments
4.4.4 Downward Cost Pressures of OTC Drugs
4.5 Opportunities in the Global Market
4.5.1 Demographic and Economic Changes Will Create Growth Opportunities
4.5.2 New OTC Switch Categories
4.5.3 Strong Growth in Emerging Markets
4.5.4 New Healthcare Technologies May enable OTC Approvals
4.5.5 Opportunities to Drive Sales via Social Media and Online Marketing
4.5.6 Self-Medication can Reduce the Under Treatment of Disease
4.6 Challenges in the Global Market
4.6.1 Competition from Private-Label Brands Will Reduce Profitability
4.6.2 Regulatory Concerns Over Safety and Misuse may Lead to Withdrawal of Products
4.6.3 Resistance to OTC Switching from Some Groups in Certain Countries
4.7 Porter’s Five Forces Analysis
4.7.1 Rivalry Among Competitors [High]
4.7.2 Threat of New Entrants [Medium]
4.7.3 Power of Suppliers [Low]
4.7.4 Power of Buyers [Medium]
4.7.5 Threats of Substitutes [Medium]
4.8 Rules and Regulations For OTC Drugs And Dietary Supplements
4.8.1 Regulations for OTC Drugs
4.8.2 Regulations For Dietary Supplements
4.9 Roadmap for Global Market
4.9.1 The Practice Of Buying OTC Drugs
4.9.2 Role Of Pharmacy In OTC Drugs
4.9.3 Regulatory Influence On OTC Drug Market
4.10 SWOT Analysis of OTC Drug And Dietary Supplement Industry
4.10.1 Strengths
4.10.1.1 OTC Medication Awareness
4.10.1.2 Drugs Regulations
4.10.1.3 Clinical Evidences
4.10.2 Weaknesses
4.10.2.1. Self-Medication could be Risky
4.10.2.2. Some OTC Drugs Carry Side Effects
4.10.2.3. Price of OTC Drugs Are Pharmacy Driven
4.10.3 Opportunities
4.10.3.1. OTC Drug Approvals for new diseases
4.10.3.2. Shift to Emerging Markets
4.10.3.3. Tie-ups in Third-Party Manufacturing
4.10.4 Threats
4.10.4.1 Low Awareness of Drugs
4.10.4.2 Increase in herbal remedies, probiotics and other alternatives for self-care
4.10.4.3 Market saturation with me-too products
5. Global OTC Drugs & Dietary Supplements Market Analysis
5.1 Well-Developed Markets
5.2 Developing Markets
5.3 Under-Developed Markets
5.2 Market Analysis in Terms of Value
5.2.1 Market Analysis in Terms of Value (Before COVID-19)
5.2.2 Market Analysis in Terms of Value (V-shaped)
5.2.1 Market Analysis in Terms of Value (W-shaped)
5.2.1 Market Analysis in Terms of Value (U-shaped)
5.2.1 Market Analysis in Terms of Value (L-shaped)
5.3 Market Analysis by Region
5.3.1 North America to Lead the Global Market
5.3.2 Market Analysis in Terms of Value (Before COVID-19)
5.3.3 Market Analysis in Terms of Value (V-shaped)
5.3.4 Market Analysis in Terms of Value (W-shaped)
5.3.5 Market Analysis in Terms of Value (U-shaped)
5.3.6 Market Analysis in Terms of Value (L-shaped)
5.4 Market Analysis by Product Category
5.4.1 Cough, Cold and Flu Drugs Segment will Dominate the Market During Forecast Period
5.4.2 Market Analysis in Terms of Value (Before COVID-19)
5.4.3 Market Analysis in Terms of Value (V-shaped)
5.4.4 Market Analysis in Terms of Value (W-shaped)
5.4.5 Market Analysis in Terms of Value (U-shaped)
5.4.6 Market Analysis in Terms of Value (L-shaped)
5.5 Market Analysis by Product Type
5.5.1 Branded Drugs Are Preferred Over Generic Drugs
5.5.2 Market Analysis in Terms of Value (Before COVID-19)
5.5.3 Market Analysis in Terms of Value (V-shaped)
5.5.4 Market Analysis in Terms of Value (W-shaped)
5.5.5 Market Analysis in Terms of Value (U-shaped)
5.5.6 Market Analysis in Terms of Value (L-shaped)
5.6 Market Analysis by Dosage Form
5.6.1. Consumers Prefer to Take Drugs in Tablet Form
5.6.2 Market Analysis in Terms of Value (Before COVID-19)
5.6.3 Market Analysis in Terms of Value (V-shaped)
5.6.4 Market Analysis in Terms of Value (W-shaped)
5.6.5 Market Analysis in Terms of Value (U-shaped)
5.6.6 Market Analysis in Terms of Value (L-shaped)
5.7 Market Analysis by Distribution Channel
5.7.1. Pharmacies/Drugstores Are Still the Sales Centres for OTC Drugs
5.7.2 Market Analysis in Terms of Value (Before COVID-19)
5.7.3 Market Analysis in Terms of Value (V-shaped)
5.7.4 Market Analysis in Terms of Value (W-shaped)
5.7.5 Market Analysis in Terms of Value (U-shaped)
5.7.6 Market Analysis in Terms of Value (L-shaped)
6. Market Breakdown by Product Category
6.1 Cough, Cold and Flu Drugs Market Analysis
6.1.1 Cough And Cold Remedies
6.1.2 Market Analysis by Region (Before COVID-19)
6.1.3 Market Analysis by Region (V-shaped)
6.1.4 Market Analysis by Region (W-shaped)
6.1.5 Market Analysis by Region (U-shaped)
6.1.6 Market Analysis by Region (L-shaped)
6.2 Analgesics Market Analysis
6.2.1Analgesics Are Frequently Used In Combination
6.2.2 ACETAMINOPHEN
6.2.3 NONSTEROIDAL ANTI-INFLAMMATORY DRUGS (NSAIDS)
6.2.4 Market Analysis in By Region (Before COVID-19)
6.2.5 Market Analysis by Region (V-shaped)
6.2.6 Market Analysis by Region (W-shaped)
6.2.7 Market Analysis by Region (U-shaped)
6.2.8 Market Analysis by Region (L-shaped)
6.3 Dermatological Market Analysis
6.3.1 Acne treatments are a major revenue earning source for OTC dermal drugs
6.3.2 Skincare And Dermatological Drugs
6.3.3 Market Analysis by Region (Before COVID-19)
6.3.4 Market Analysis by Region (V-shaped)
6.3.5 Market Analysis by Region (W-shaped)
6.3.6 Market Analysis by Region (U-shaped)
6.3.7Market Analysis by Region (L-shaped)
6.4 Vitamins and Minerals Market Analysis
6.4.1 The Percentage Of Females With Vitamin And Mineral Deficiencies Is Higher Than Males
6.4.2 Treatments for Vitamins and Mineral Deficiency
6.4.3 Vitamins and Mineral Supplements (VMS)
6.4.4 Market Analysis by Region (Before COVID-19)
6.4.5 Market Analysis by Region (V-shaped)
6.4.6 Market Analysis by Region (W-shaped)
6.4.7 Market Analysis by Region (U-shaped)
6.4.8 Market Analysis by Region (L-shaped)
6.5 Weight Loss/Diet Products Market Analysis
6.5.1.The Countries In Latin America Such As Brazil Are Likely To Unfold Remunerative
Opportunities During The Forecast Period
6.5.2 Market Analysis by Region (Before COVID-19)
6.5.3 Market Analysis by Region (V-shaped)
6.5.4 Market Analysis by Region (W-shaped)
6.5.5 Market Analysis by Region (U-shaped)
6.5.6 Market Analysis by Region (L-shaped)
6.6 Gastrointestinal Drugs Market Analysis
6.6.1 Gastrointestinal OTC Remedies Have Been Proven Effective In Primary Care
6.6.2 Gastrointestinal Disorder Treatments
6.6.3 Market Analysis by Region (Before COVID-19)
6.6.4 Market Analysis by Region (V-shaped)
6.6.5 Market Analysis by Region (W-shaped)
6.6.6 Market Analysis by Region (U-shaped)
6.6.7 Market Analysis by Region (L-shaped)
6.7 Other Category Market Analysis
6.7.1 Oral medical care
6.7.2 Eye Care Products
6.7.2.1 Use of OTC Products For Ocular Allergy And Dry Eye Are Quietly But Rapidly Growing
6.7.3 Market Analysis by Region (Before COVID-19)
6.7.4 Market Analysis by Region (V-shaped)
6.7.5 Market Analysis by Region (W-shaped)
6.7.6 Market Analysis by Region (U-shaped)
6.7.7 Market Analysis by Region (L-shaped)
7. Market Breakdown by Product Type
7.1 Branded Drugs Market Analysis
7.1.1 OTC Drug Companies Spending Huge on Marketing To Awareness About Their Brands
7.1.2 Market Analysis by Region (Before COVID-19)
7.1.3 Market Analysis by Region (V-shaped)
7.1.4 Market Analysis by Region (W-shaped)
7.1.5 Market Analysis by Region (U-shaped)
7.1.6 Market Analysis by Region (L-shaped)
7.2 Generic Drugs Market Analysis
7.2.1 Generic OTC Are Still in Demand Due to Lower Prices
7.2.2 Market Analysis by Region (Before COVID-19)
7.2.3 Market Analysis by Region (V-shaped)
7.2.4 Market Analysis by Region (W-shaped)
7.2.5 Market Analysis by Region (U-shaped)
7.2.6 Market Analysis by Region (L-shaped)
7.3 Other Product Types Market Analysis
7.3.1 Market Analysis by Region (Before COVID-19)
7.3.2 Market Analysis by Region (V-shaped)
7.3.3 Market Analysis by Region (W-shaped)
7.3.4 Market Analysis by Region (U-shaped)
7.3.5 Market Analysis by Region (L-shaped)
8. Market Breakdown by Dosage Type
8.1 Tablets Market Analysis
8.1.1 Tablets Segment holds Largest Share in the Global Market
8.1.2 Market Analysis by Region (Before COVID-19)
8.1.3 Market Analysis by Region (V-shaped)
8.1.4 Market Analysis by Region (W-shaped)
8.1.5 Market Analysis by Region (U-shaped)
8.1.6 Market Analysis by Region (L-shaped)
8.2 Hard Capsules Market Analysis
8.2.1 Hard Capsules Segment is Expected to Grow at a Decent Growth Rate
8.2.2 Market Analysis by Region (Before COVID-19)
8.2.3 Market Analysis by Region (V-shaped)
8.2.4 Market Analysis by Region (W-shaped)
8.2.5 Market Analysis by Region (U-shaped)
8.2.6 Market Analysis by Region (L-shaped)
8.3 Powders Market Analysis
8.3.1 Increasing Demand in the Asia-Pacific Market
8.3.2 Market Analysis by Region (Before COVID-19)
8.3.3 Market Analysis by Region (V-shaped)
8.3.4 Market Analysis by Region (W-shaped)
8.3.5 Market Analysis by Region (U-shaped)
8.3.6 Market Analysis by Region (L-shaped)
8.4 Ointments Market Analysis
8.4.1 European Market is Expected to Grow at a Decent Growth Rate
8.4.2 Market Analysis by Region (Before COVID-19)
8.4.3 Market Analysis by Region (V-shaped)
8.4.4 Market Analysis by Region (W-shaped)
8.4.5 Market Analysis by Region (U-shaped)
8.4.6 Market Analysis by Region (L-shaped)
8.5 Soft Capsules Market Analysis
8.5.1. North American Consumers Prefer Soft Tablets Over the Hard ones
8.5.2 Market Analysis by Region (Before COVID-19)
8.5.3 Market Analysis by Region (V-shaped)
8.5.4 Market Analysis by Region (W-shaped)
8.5.5 Market Analysis by Region (U-shaped)
8.5.6 Market Analysis by Region (L-shaped)
8.6 Liquids Market Analysis
8.6.1 Liquid OTC Drugs are Less Preferred in the Latin America Region
8.6.2 Market Analysis by Region (Before COVID-19)
8.6.3 Market Analysis by Region (V-shaped)
8.6.4 Market Analysis by Region (W-shaped)
8.6.5 Market Analysis by Region (U-shaped)
8.6.6 Market Analysis by Region (L-shaped)
8.7 Other Dosage Forms Market Analysis
8.7.1 Market Analysis by Region (Before COVID-19)
8.7.2 Market Analysis by Region (V-shaped)
8.7.3 Market Analysis by Region (W-shaped)
8.7.4 Market Analysis by Region (U-shaped)
8.7.5 Market Analysis by Region (L-shaped)
9. Market Breakdown by Distribution Channel
9.1 Pharmacies/Drugstores Market Analysis
9.1.1 This Segment Holds the Largest Share in the Market
9.1.2 Market Analysis by Region (Before COVID-19)
9.1.3 Market Analysis by Region (V-shaped)
9.1.4 Market Analysis by Region (W-shaped)
9.1.5 Market Analysis by Region (U-shaped)
9.1.6 Market Analysis by Region (L-shaped)
9.2 Supermarkets/Hypermarkets Market Analysis
9.2.1 Consumers in Metro Cities Prefer to Buy OTC Drugs from Supermarkets/Hypermarkets
9.2.2 Market Analysis by Region (Before COVID-19)
9.2.3 Market Analysis by Region (V-shaped)
9.2.4 Market Analysis by Region (W-shaped)
9.2.5 Market Analysis by Region (U-shaped)
9.2.6 Market Analysis by Region (L-shaped)
9.3 Convenience Stores Market Analysis
9.3.1 Trends Shifting Towards Convenience Stores Purchase
9.3.2 Market Analysis by Region (Before COVID-19)
9.3.3 Market Analysis by Region (V-shaped)
9.3.4 Market Analysis by Region (W-shaped)
9.3.5 Market Analysis by Region (U-shaped)
9.3.6 Market Analysis by Region (L-shaped)
9.4 Online Drug Stores Market Analysis
9.4.1 Online Drug Stores are a Hot Trend in the Global OTC Market
9.4.2 Market Analysis by Region (Before COVID-19)
9.4.3 Market Analysis by Region (V-shaped)
9.4.4 Market Analysis by Region (W-shaped)
9.4.5 Market Analysis by Region (U-shaped)
9.4.6 Market Analysis by Region (L-shaped)
9.5 Health Food Stores Market Analysis
9.5.1. Health Cautious Consumers Prefer to Buy OTC From Health Food Stores
9.5.2 Market Analysis by Region (Before COVID-19)
9.5.3 Market Analysis by Region (V-shaped)
9.5.4 Market Analysis by Region (W-shaped)
9.5.5 Market Analysis by Region (U-shaped)
9.5.6 Market Analysis by Region (L-shaped)
9.6 Other Distribution Channel Market Analysis
9.6.1 Market Analysis by Region (Before COVID-19)
9.6.2 Market Analysis by Region (V-shaped)
9.6.3 Market Analysis by Region (W-shaped)
9.6.4 Market Analysis by Region (U-shaped)
9.6.5 Market Analysis by Region (L-shaped)
10. North America Market Analysis
10.1 Market Analysis in Terms of Value
10.1.1 Market Analysis in Terms of Value (Before COVID-19)
10.1.2 Market Analysis in Terms of Value (V-shaped)
10.1.3 Market Analysis in Terms of Value (W-shaped)
10.1.4 Market Analysis in Terms of Value (U-shaped)
10.1.5 Market Analysis in Terms of Value (L-shaped)
10.2 Market Analysis by Country
10.2.1 US to Dominate the Market During Forecast Period.
10.2.2 Market Analysis by Country (Before COVID-19)
10.2.3 Market Analysis by Country (V-shaped)
10.2.4 Market Analysis by Country (W-shaped)
10.2.5 Market Analysis by Country (U-shaped)
10.2.6 Market Analysis by Country (L-shaped)
10.3 U.S. Market Analysis
10.3.1 Vendor Ecosystem For OTC Drugs In The U.S.
10.3.2 Multinational OTC Drug Manufacturers
10.3.3 Store Brands
10.3.4 FMCG Companies
10.3.5 Regulations And Approval Process: The U.S.
10.3.6 OTC Drug Review
10.3.7 OTC Monograph
10.3.8 OTC Drugs Developed Through the NDA Process
10.3.9 The U.S. Non-prescription Safe-Use Regulatory Expansion (NSURE) Initiative
10.3.10 Market Analysis in Terms of Value (Before COVID-19)
10.3.11 Market Analysis in Terms of Value (V-shaped)
10.3.12 Market Analysis in Terms of Value (W-shaped)
10.3.13 Market Analysis in Terms of Value (U-shaped)
10.3.14 Market Analysis in Terms of Value (L-shaped)
10.4 Canada Market Analysis
10.4.1 Canada is the 10th largest pharmaceutical market in the world and the second largest in North America.
10.4.2 Market Analysis in Terms of Value (Before COVID-19)
10.4.3 Market Analysis in Terms of Value (V-shaped)
10.4.4 Market Analysis in Terms of Value (W-shaped)
10.4.5 Market Analysis in Terms of Value (U-shaped)
10.4.6 Market Analysis in Terms of Value (L-shaped)
10.5 Market Analysis by Product Category
10.5.1 Market Analysis by Sub-Type (Before COVID-19)
10.5.2 Market Analysis by Sub-Type (V-shaped)
10.6 Market Analysis by Product Type
10.6.1 Market Analysis by Sub-Type (Before COVID-19)
10.6.2 Market Analysis by Sub-Type (V-shaped)
10.6.3 Market Analysis by Sub-Type (W-shaped)
10.6.4 Market Analysis by Sub-Type (U-shaped)
10.6.5 Market Analysis by Sub-Type (L-shaped)
10.7 Market Analysis by Dosage Form
10.7.1 Market Analysis by Sub-Type (Before COVID-19)
10.7.2 Market Analysis by Sub-Type (V-shaped)
10.7.3 Market Analysis by Sub-Type (W-shaped)
10.7.4 Market Analysis by Sub-Type (U-shaped)
10.7.5 Market Analysis by Sub-Type (L-shaped)
10.8 Market Analysis by Distribution Channel
10.8.1 Market Analysis by Sub-Type (Before COVID-19)
10.8.2 Market Analysis by Sub-Type (V-shaped)
10.8.3 Market Analysis by Sub-Type (W-shaped)
10.8.4 Market Analysis by Sub-Type (U-shaped)
10.8.5 Market Analysis by Sub-Type (L-shaped)
11. Europe Market Analysis
11.1.1 BREXIT Effect On The OTC Drug Market In Europe
11.1.2 Regulations And Approval Process In Europe
11.1.3 Smart Regulation 2015: Europe As A Single Market
11.2 Market Analysis in Terms of Value
11.2.1 Market Analysis in Terms of Value (Before COVID-19)
11.2.2 Market Analysis in Terms of Value (V-shaped)
11.2.3 Market Analysis in Terms of Value (W-shaped)
11.2.4 Market Analysis in Terms of Value (U-shaped)
11.2.5 Market Analysis in Terms of Value (L-shaped)
11.3 Market Analysis by Country
11.3.1 UK to Dominate the European Market
11.3.2 Market Analysis by Country (Before COVID-19)
11.3.3 Market Analysis by Country (V-shaped)
11.3.4 Market Analysis by Country (W-shaped)
11.3.5 Market Analysis by Country (U-shaped)
11.3.6 Market Analysis by Country (L-shaped)
11.4 U.K. Market Analysis
11.4.1 The U.K. has an established market for OTC drugs and dietary supplements
11.4.2 Better Regulation of Over-the-Counter Drugs Initiative (BROMI) U.K.
11.4.3 Market Analysis in Terms of Value (Before COVID-19)
11.4.4 Market Analysis in Terms of Value (V-shaped)
11.4.5 Market Analysis in Terms of Value (W-shaped)
11.4.6 Market Analysis in Terms of Value (U-shaped)
11.4.7 Market Analysis in Terms of Value (L-shaped)
11.5 Germany Market Analysis
11.5.1 About 30% of Germany’s population frequently uses OTC drugs and dietary supplements for self-medication.
11.5.2 The Regulations and Approval Process in Germany
11.5.3 Market Analysis in Terms of Value (Before COVID-19)
11.5.4 Market Analysis in Terms of Value (V-shaped)
11.5.5 Market Analysis in Terms of Value (W-shaped)
11.5.6 Market Analysis in Terms of Value (U-shaped)
11.5.7 Market Analysis in Terms of Value (L-shaped)
11.6 France Market Analysis
11.6.1 France is another leading market with strong potential for growth in OTC drugs and dietary supplements
11.6.2 Market Analysis in Terms of Value (Before COVID-19)
11.6.3 Market Analysis in Terms of Value (V-shaped)
11.6.4 Market Analysis in Terms of Value (W-shaped)
11.6.5 Market Analysis in Terms of Value (U-shaped)
11.6.6 Market Analysis in Terms of Value (L-shaped)
11.7 Italy Market Analysis
11.7.1OTC Drugs & Dietary Supplements Market is Expected to Grow at a Decent Rate
11.7.2 Market Analysis in Terms of Value (Before COVID-19)
11.7.3 Market Analysis in Terms of Value (V-shaped)
11.7.4 Market Analysis in Terms of Value (W-shaped)
11.7.5 Market Analysis in Terms of Value (U-shaped)
11.7.6 Market Analysis in Terms of Value (L-shaped)
11.8 Spain Market Analysis
11.8.1 OTC products are allowed to be freely priced
11.8.2 Market Analysis in Terms of Value (Before COVID-19)
11.8.3 Market Analysis in Terms of Value (V-shaped)
11.8.4 Market Analysis in Terms of Value (W-shaped)
11.8.5 Market Analysis in Terms of Value (U-shaped)
11.8.6 Market Analysis in Terms of Value (L-shaped)
11.9 Rest of Europe Market Analysis
11.9.1 The Russian OTC Drug and Dietary Supplements
11.9.2 The Polish OTC Drug and Dietary Supplements
11.9.3 Market Analysis in Terms of Value (Before COVID-19)
11.9.4 Market Analysis in Terms of Value (V-shaped)
11.9.5 Market Analysis in Terms of Value (W-shaped)
11.9.6 Market Analysis in Terms of Value (U-shaped)
11.9.7 Market Analysis in Terms of Value (L-shaped)
11.10 Market Analysis by Product Category
11.10.1 Market Analysis by Sub-Type (Before COVID-19)
11.10.1 Market Analysis by Sub-Type (V-shaped)
11.10.1 Market Analysis by Sub-Type (W-shaped)
11.10.1 Market Analysis by Sub-Type (U-shaped)
11.10.1 Market Analysis by Sub-Type (L-shaped)
11.11 Market Analysis by Product Type
11.11.1 Market Analysis by Sub-Type (Before COVID-19)
11.11.2 Market Analysis by Sub-Type (V-shaped)
11.11.3 Market Analysis by Sub-Type (W-shaped)
11.11.4 Market Analysis by Sub-Type (U-shaped)
11.11.5 Market Analysis by Sub-Type (L-shaped)
11.12 Market Analysis by Dosage Form
11.12.1 Market Analysis by Sub-Type (Before COVID-19)
11.12.2 Market Analysis by Sub-Type (V-shaped)
11.12.3 Market Analysis by Sub-Type (W-shaped)
11.12.4 Market Analysis by Sub-Type (U-shaped)
11.12.5 Market Analysis by Sub-Type (L-shaped)
11.13 Market Analysis by Distribution Channel
11.13.1 Market Analysis by Sub-Type (Before COVID-19)
11.13.2 Market Analysis by Sub-Type (V-shaped)
11.13.3 Market Analysis by Sub-Type (W-shaped)
11.13.4 Market Analysis by Sub-Type (U-shaped)
11.13.5 Market Analysis by Sub-Type (L-shaped)
12. Asia-Pacific Market Analysis
12.1 Market Analysis in Terms of Value
12.1.1 Market Analysis in Terms of Value (Before COVID-19)
12.1.2 Market Analysis in Terms of Value (V-shaped)
12.1.3 Market Analysis in Terms of Value (W-shaped)
12.1.4 Market Analysis in Terms of Value (U-shaped)
12.1.5 Market Analysis in Terms of Value (L-shaped)
12.2 Market Analysis by Country
12.2.1 China to Maintain its Dominance in the Asia-Pacific Market
12.2.2 Market Analysis in By Country (Before COVID-19)
12.2.3 Market Analysis by Country (V-shaped)
12.2.4 Market Analysis by Country (W-shaped)
12.2.5 Market Analysis by Country (U-shaped)
12.2.6 Market Analysis by Country (L-shaped)
12.3 China Market Analysis
12.3.1.Though OTC drug advertising is permissive in China, there are strict regulations for advertisement contents
12.3.2 New Amendments in Regulating Drug Advertising in 2015
12.3.3 Market Analysis in Terms of Value (Before COVID-19)
12.3.4 Market Analysis in Terms of Value (V-shaped)
12.3.5 Market Analysis in Terms of Value (W-shaped)
12.3.6 Market Analysis in Terms of Value (U-shaped)
12.3.7 Market Analysis in Terms of Value (L-shaped)
12.4 India Market Analysis
12.4.1. New urban upwardly mobile class has increased the use of OTC drugs
12.4.2 India: Regulation and Approval Processes
12.4.3 Market Analysis in Terms of Value (Before COVID-19)
12.4.4 Market Analysis in Terms of Value (V-shaped)
12.4.5 Market Analysis in Terms of Value (W-shaped)
12.4.6 Market Analysis in Terms of Value (U-shaped)
12.4.7 Market Analysis in Terms of Value (L-shaped)
12.5 Japan Market Analysis
12.5.1 Japan has strict criteria for classifying OTC drugs and adheres to stringent point-of-sales policies
12.5.2 The Regulation and Approval Process in Japan
12.5.3 Market Analysis in Terms of Value (Before COVID-19)
12.5.4 Market Analysis in Terms of Value (V-shaped)
12.5.5 Market Analysis in Terms of Value (W-shaped)
12.5.6 Market Analysis in Terms of Value (U-shaped)
12.5.7 Market Analysis in Terms of Value (L-shaped)
12.6 South Korea Market Analysis
12.6.1 An increase in self-medication and a growing geriatric population with chronic diseases
12.6.2 Market Analysis in Terms of Value (Before COVID-19)
12.6.3 Market Analysis in Terms of Value (V-shaped)
12.6.4 Market Analysis in Terms of Value (W-shaped)
12.6.5 Market Analysis in Terms of Value (U-shaped)
12.6.6 Market Analysis in Terms of Value (L-shaped)
12.7 Australia Market Analysis
12.7.1 OTC drugs can be registered or listed on the Australian Register of Therapeutic Goods (ARTG)
12.7.2 Regulation and Approval Process: Australia
12.7.3 Joint Australian and New Zealand Phased Implementation Plan 2013
12.7.4 N2 Applications (Using OTC Monographs) Version1, September 2013
12.7.5 Market Analysis in Terms of Value (Before COVID-19)
12.7.6 Market Analysis in Terms of Value (V-shaped)
12.7.7 Market Analysis in Terms of Value (W-shaped)
12.7.8 Market Analysis in Terms of Value (U-shaped)
12.7.9 Market Analysis in Terms of Value (L-shaped)
12.8 Rest of Asia-Pacific Market Analysis
12.8.1 Market Analysis in Terms of Value (Before COVID-19)
12.8.2 Market Analysis in Terms of Value (V-shaped)
12.8.3 Market Analysis in Terms of Value (W-shaped)
12.8.4 Market Analysis in Terms of Value (U-shaped)
12.8.5 Market Analysis in Terms of Value (L-shaped)
12.9 Market Analysis by Product Category
12.9.1 Market Analysis by Sub-Type (Before COVID-19)
12.9.2 Market Analysis by Sub-Type (V-shaped)
12.9.3 Market Analysis by Sub-Type (W-shaped)
12.9.4 Market Analysis by Sub-Type (U-shaped)
12.9.5 Market Analysis by Sub-Type (L-shaped)
12.10 Market Analysis by Product Type
12.10.1 Market Analysis by Sub-Type (Before COVID-19)
12.10.2 Market Analysis by Sub-Type (V-shaped)
12.10.3 Market Analysis by Sub-Type (W-shaped)
12.10.4 Market Analysis by Sub-Type (U-shaped)
12.10.5 Market Analysis by Sub-Type (L-shaped)
12.11 Market Analysis by Dosage Form
12.11.1 Market Analysis by Sub-Type (Before COVID-19)
12.11.2 Market Analysis by Sub-Type (V-shaped)
12.11.3 Market Analysis by Sub-Type (W-shaped)
12.11.4 Market Analysis by Sub-Type (U-shaped)
12.11.5 Market Analysis by Sub-Type (L-shaped)
12.12 Market Analysis by Distribution Channel
12.12.1 Market Analysis by Sub-Type (Before COVID-19)
12.12.2 Market Analysis by Sub-Type (V-shaped)
12.12.3 Market Analysis by Sub-Type (W-shaped)
12.12.4 Market Analysis by Sub-Type (U-shaped)
12.12.5 Market Analysis by Sub-Type (L-shaped)
13. Middle East & Africa Market Analysis
13.1 Market Analysis in Terms of Value
13.1.1 Market Analysis in Terms of Value (Before COVID-19)
13.1.2 Market Analysis in Terms of Value (V-shaped)
13.1.3 Market Analysis in Terms of Value (W-shaped)
13.1.4 Market Analysis in Terms of Value (U-shaped)
13.1.5 Market Analysis in Terms of Value (L-shaped)
13.2 Market Analysis by Country
13.2.1 South America to Lead the MEA Market
13.2.2 Market Analysis by Country (Before COVID-19)
13.2.3 Market Analysis by Country (V-shaped)
13.2.4 Market Analysis by Country (W-shaped)
13.2.5 Market Analysis by Country (U-shaped)
13.2.6 Market Analysis by Country (L-shaped)
13.3 South Africa Market Analysis
13.3.1 The OTC derivatives market plays an important role in domestic financial markets and the economy
13.3.2 Market Analysis in Terms of Value (Before COVID-19)
13.3.3 Market Analysis in Terms of Value (V-shaped)
13.3.4 Market Analysis in Terms of Value (W-shaped)
13.3.5 Market Analysis in Terms of Value (U-shaped)
13.3.6 Market Analysis in Terms of Value (L-shaped)
13.4 Turkey Market Analysis
13.4.1 There is currently a lack of OTC regulations and classifications in Turkey
13.4.2 Market Analysis in Terms of Value (Before COVID-19)
13.4.3 Market Analysis in Terms of Value (V-shaped)
13.4.4 Market Analysis in Terms of Value (W-shaped)
13.4.5 Market Analysis in Terms of Value (U-shaped)
13.4.6 Market Analysis in Terms of Value (L-shaped)
13.5 Saudi Arabia Market Analysis
13.5.1 Saudi Arabia OTC Drugs market is dominated by branded drugs
13.5.2 Market Analysis in Terms of Value (Before COVID-19)
13.5.3 Market Analysis in Terms of Value (V-shaped)
13.5.4 Market Analysis in Terms of Value (W-shaped)
13.5.5 Market Analysis in Terms of Value (U-shaped)
13.5.6 Market Analysis in Terms of Value (L-shaped)
13.6 UAE Market Analysis
13.6.1 Increasing Incomes And Awareness Lead To An Increase In Personal Care.
13.6.2 Market Analysis in Terms of Value (Before COVID-19)
13.6.3 Market Analysis in Terms of Value (V-shaped)
13.6.4 Market Analysis in Terms of Value (W-shaped)
13.6.5 Market Analysis in Terms of Value (U-shaped)
13.6.6 Market Analysis in Terms of Value (L-shaped)
13.7 Qatar Market Analysis
13.7.1 Qatar will remain an attractive market for innovative pharmaceutical and healthcare providers
13.7.2 Market Analysis in Terms of Value (Before COVID-19)
13.7.3 Market Analysis in Terms of Value (V-shaped)
13.7.4 Market Analysis in Terms of Value (W-shaped)
13.7.5 Market Analysis in Terms of Value (U-shaped)
13.7.6 Market Analysis in Terms of Value (L-shaped)
13.8 Rest of Middle East & Africa Market Analysis
13.8.1 Market Analysis in Terms of Value (Before COVID-19)
13.8.2 Market Analysis in Terms of Value (V-shaped)
13.8.3 Market Analysis in Terms of Value (W-shaped)
13.8.4 Market Analysis in Terms of Value (U-shaped)
13.8.5 Market Analysis in Terms of Value (L-shaped)
13.9 Market Analysis by Product Category
13.9.1 Market Analysis by Sub-Type (Before COVID-19)
13.9.2 Market Analysis by Sub-Type (V-shaped)
13.9.3 Market Analysis by Sub-Type (W-shaped)
13.9.4 Market Analysis by Sub-Type (U-shaped)
13.9.5 Market Analysis by Sub-Type (L-shaped)
13.10 Market Analysis by Product Type
13.10.1 Market Analysis by Sub-Type (Before COVID-19)
13.10.2 Market Analysis by Sub-Type (V-shaped)
13.10.3 Market Analysis by Sub-Type (W-shaped)
13.10.4 Market Analysis by Sub-Type (U-shaped)
13.10.5 Market Analysis by Sub-Type (L-shaped)
13.11 Market Analysis by Dosage Form
13.11.1 Market Analysis by Sub-Type (Before COVID-19)
13.11.2 Market Analysis by Sub-Type (V-shaped)
13.11.3 Market Analysis by Sub-Type (W-shaped)
13.11.4 Market Analysis by Sub-Type (U-shaped)
13.11.5 Market Analysis by Sub-Type (L-shaped)
13.12 Market Analysis by Distribution Channel
13.12.1 Market Analysis by Sub-Type (Before COVID-19)
13.12.2 Market Analysis by Sub-Type (V-shaped)
13.12.3 Market Analysis by Sub-Type (W-shaped)
13.12.4 Market Analysis by Sub-Type (U-shaped)
13.12.5 Market Analysis by Sub-Type (L-shaped)
14. Latin America Market Analysis
14.1 Market Analysis in Terms of Value
14.1.1 Market Analysis in Terms of Value (Before COVID-19)
14.1.2 Market Analysis in Terms of Value (V-shaped)
14.1.3 Market Analysis in Terms of Value (W-shaped)
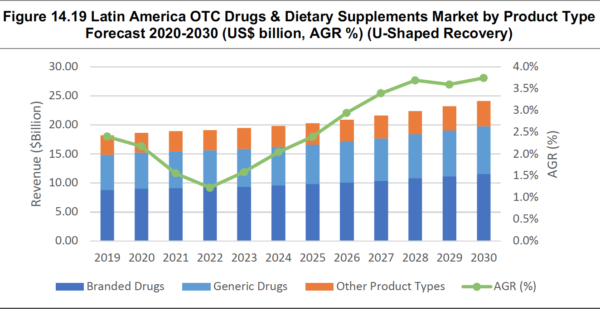
14.1.4 Market Analysis in Terms of Value (U-shaped)
14.1.5 Market Analysis in Terms of Value (L-shaped)
14.2 Market Analysis by Country
14.2.11Brazil to Dominate the Latin America Market
14.2.2 Market Analysis in Terms of Value (Before COVID-19)
14.2.3 Market Analysis by Country (V-shaped)
14.2.4 Market Analysis by Country (W-shaped)
14.2.5 Market Analysis by Country (U-shaped)
14.2.6 Market Analysis by Country (L-shaped)
14.3 Brazil Market Analysis
14.3.1 changes in regulations in Brazil’s OTC drug approval will bring more OTC drugs
14.3.2 The drug cannot cause chemical dependency in consumers.
14.3.3 Market Analysis in Terms of Value (Before COVID-19)
14.3.4 Market Analysis in Terms of Value (V-shaped)
14.3.5 Market Analysis in Terms of Value (W-shaped)
14.3.6 Market Analysis in Terms of Value (U-shaped)
14.3.7 Market Analysis in Terms of Value (L-shaped)
14.4 Mexico Market Analysis
14.4.1 The OTC market is driven partly by longer life expectancies and an ageing population
14.4.2 Market Analysis in Terms of Value (Before COVID-19)
14.4.3 Market Analysis in Terms of Value (V-shaped)
14.4.4 Market Analysis in Terms of Value (W-shaped)
14.4.5 Market Analysis in Terms of Value (U-shaped)
14.4.6 Market Analysis in Terms of Value (L-shaped)
14.5 Colombia Market Analysis
14.5.1 OTC drugs may be promoted to end consumers
14.5.2 Market Analysis in Terms of Value (Before COVID-19)
14.5.3 Market Analysis in Terms of Value (V-shaped)
14.5.4 Market Analysis in Terms of Value (W-shaped)
14.5.5 Market Analysis in Terms of Value (U-shaped)
14.5.6 Market Analysis in Terms of Value (L-shaped)
14.6 Rest of Latin America Market Analysis
14.6.1 Market Analysis in Terms of Value (Before COVID-19)
14.6.2 Market Analysis in Terms of Value (V-shaped)
14.6.3 Market Analysis in Terms of Value (W-shaped)
14.6.4 Market Analysis in Terms of Value (U-shaped)
14.6.5 Market Analysis in Terms of Value (L-shaped)
14.7 Market Analysis by Product Category
14.7.1 Market Analysis by Sub-Type (Before COVID-19)
14.7.2 Market Analysis by Sub-Type (V-shaped)
14.7.3 Market Analysis by Sub-Type (W-shaped)
14.7.4 Market Analysis by Sub-Type (U-shaped)
14.7.5 Market Analysis by Sub-Type (L-shaped)
14.8 Market Analysis by Product Type
14.8.1 Market Analysis by Sub-Type (Before COVID-19)
14.8.2 Market Analysis by Sub-Type (V-shaped)
14.8.3 Market Analysis by Sub-Type (W-shaped)
14.8.4 Market Analysis by Sub-Type (U-shaped)
14.8.5 Market Analysis by Sub-Type (L-shaped)
14.9 Market Analysis by Dosage Form
14.9.1 Market Analysis by Sub-Type (Before COVID-19)
14.9.2 Market Analysis by Sub-Type (V-shaped)
14.9.3 Market Analysis by Sub-Type (W-shaped)
14.9.4 Market Analysis by Sub-Type (U-shaped)
14.9.5 Market Analysis by Sub-Type (L-shaped)
14.10 Market Analysis by Distribution Channel
14.10.1 Market Analysis by Sub-Type (Before COVID-19)
14.10.2 Market Analysis by Sub-Type (V-shaped)
14.10.3 Market Analysis by Sub-Type (W-shaped)
14.10.4 Market Analysis by Sub-Type (U-shaped)
14.10.5 Market Analysis by Sub-Type (L-shaped)
15. Leading OTC Drugs & Dietary Supplements Manufacturing Company Profiles
15.1 Taisho Pharmaceutical Holdings Co Ltd
15.1.1 Company Details
15.1.2 Company Overview
15.1.3 Company Financial Analysis
15.1.4 Company Product Offering
15.1.5 Company Recent Developments
15.2 Nippon Chemiphar Co., Ltd.
15.2.1 Company Details
15.2.2 Company Overview
15.2.3 Company Financial Analysis
15.2.1 Company Product Offering
15.2.2 Company Recent Developments
15.3 H. Lundbeck A/S
15.3.1 Company Details
15.3.2 Company Overview
15.3.3 Company Financial Analysis
15.3.1 Company Product Offering
15.3.2 Company Recent Developments
15.4 ASKA Pharmaceutical Co., Ltd.
15.4.1 Company Details
15.4.2 Company Overview
15.4.3 Company Financial Analysis
15.4.1 Company Product Offering
15.4.2 Company Recent Developments
15.5 Teva Pharmaceuticals
15.5.1 Company Details
15.5.2 Company Overview
15.5.3 Company Financial Analysis
15.5.1 Company Product Offering
15.5.2 Company Recent Developments
15.6 Novartis AG
15.6.1 Company Details
15.6.2 Company Overview
15.6.3 Company Financial Analysis
15.6.1 Company Product Offering
15.6.2 Company Recent Developments
15.7 Pfizer Inc.
15.7.1 Company Details
15.7.2 Company Overview
15.7.3 Company Financial Analysis
15.7.1 Company Product Offering
15.7.2 Company Recent Developments
15.8 Mylan NV
15.8.1 Company Details
15.8.2 Company Overview
15.8.3 Company Financial Analysis
15.8.1 Company Product Offering
15.8.2 Company Recent Developments
15.9 Abbott Laboratories
15.9.1 Company Details
15.9.2 Company Overview
15.9.3 Company Financial Analysis
15.9.1 Company Product Offering
15.9.2 Company Recent Developments
15.10 Fresenius SE & Co KGaA
15.10.1 Company Details
15.10.2 Company Overview
15.10.3 Company Financial Analysis
15.10.1 Company Product Offering
15.10.2 Company Recent Developments
15.11 Sun Pharmaceutical Industries Ltd
15.11.1 Company Details
15.11.2 Company Overview
15.11.3 Company Financial Analysis
15.11.1 Company Product Offering
15.11.2 Company Recent Developments
15.12 Sanofi SA
15.12.1 Company Details
15.12.2 Company Overview
15.12.3 Company Financial Analysis
15.12.1 Company Product Offering
15.12.2 Company Recent Developments
15.13 Roche Holding
15.13.1 Company Details
15.13.2 Company Overview
15.13.3 Company Financial Analysis
15.13.1 Company Product Offering
15.13.2 Company Recent Developments
15.14 Lupin Pharmaceuticals
15.14.1 Company Details
15.14.2 Company Overview
15.14.3 Company Financial Analysis
15.14.1 Company Product Offering
15.14.2 Company Recent Developments
16. Conclusion & Recommendations
List of Figures
Figure 1.1 Global OTC Drugs & Dietary Supplements Market by Value Forecast 2020-2030 (US$ billion, AGR %)
Figure 4.1 Porter’s Five Forces Analysis of OTC Drugs and Dietary Supplement Market. 2020
Figure 5.1 Global OTC Drugs & Dietary Supplements Market by Value Forecast 2020-2030 ( US$billion, AGR %)
Figure 5.2 Global OTC Drugs & Dietary Supplements Market by Value Forecast 2020-2030 (US$ billion, AGR %) (V-Shaped Recovery)
Figure 5.3 Global OTC Drugs & Dietary Supplements Market by Value Forecast 2020-2030 (US$ billion, AGR %) (W-Shaped Recovery)
Figure 5.4 Global OTC Drugs & Dietary Supplements Market by Value Forecast 2020-2030 (US$ billion, AGR %) (U-Shaped Recovery)
Figure 5.5 Global OTC Drugs & Dietary Supplements Market by Value Forecast 2020-2030 (US$ billion, AGR %) (L-Shaped Recovery)
Figure 5.6 Global OTC Drugs & Dietary Supplements Market by Region Forecast 2020-2030 ( US$billion, AGR %)
Figure 5.7 Global OTC Drugs & Dietary Supplements Market by Region Forecast 2020-2030 (US$ billion, AGR %) (V-Shaped Recovery)
Figure 5.8 Global OTC Drugs & Dietary Supplements Market by Region Forecast 2020-2030 (US$ billion, AGR %) (W-Shaped Recovery)
Figure 5.9 Global OTC Drugs & Dietary Supplements Market by Region Forecast 2020-2030 (US$ billion, AGR %) (U-Shaped Recovery)
Figure 5.10 Global OTC Drugs & Dietary Supplements Market by Region Forecast 2020-2030 (US$ billion, AGR %) (L-Shaped Recovery)
Figure 5.11 Global OTC Drugs & Dietary Supplements Market by Category Forecast 2020-2030 ( US$billion, AGR %)
Figure 5.12 Global OTC Drugs & Dietary Supplements Market by Category Forecast 2020-2030 (US$ billion, AGR %) (V-Shaped Recovery)
Figure 5.13 Global OTC Drugs & Dietary Supplements Market by Category Forecast 2020-2030 (US$ billion, AGR %) (W-Shaped Recovery)
Figure 5.14 Global OTC Drugs & Dietary Supplements Market by Category Forecast 2020-2030 (US$ billion, AGR %) (U-Shaped Recovery)
Figure 5.15 Global OTC Drugs & Dietary Supplements Market by Category Forecast 2020-2030 (US$ billion, AGR %) (L-Shaped Recovery)
Figure 5.16 Global OTC Drugs & Dietary Supplements Market by Product Type Forecast 2020-2030 ( US$billion, AGR %)
Figure 5.17 Global OTC Drugs & Dietary Supplements Market by Product Type Forecast 2020-2030 (US$ billion, AGR %) (V-Shaped Recovery)
Figure 5.18 Global OTC Drugs & Dietary Supplements Market by Product Type Forecast 2020-2030 (US$ billion, AGR %) (W-Shaped Recovery)
Figure 5.19 Global OTC Drugs & Dietary Supplements Market by Product Type Forecast 2020-2030 (US$ billion, AGR %) (U-Shaped Recovery)
Figure 5.20 Global OTC Drugs & Dietary Supplements Market by Product Type Forecast 2020-2030 (US$ billion, AGR %) (L-Shaped Recovery)
Figure 5.21 Global OTC Drugs & Dietary Supplements Market by Dosage Form Forecast 2020-2030 ( US$billion, AGR %)
Figure 5.22 Global OTC Drugs & Dietary Supplements Market by Dosage Form Forecast 2020-2030 (US$ billion, AGR %) (V-Shaped Recovery)
Figure 5.23 Global OTC Drugs & Dietary Supplements Market by Dosage Form Forecast 2020-2030 (US$ billion, AGR %) (W-Shaped Recovery)
Figure 5.24 Global OTC Drugs & Dietary Supplements Market by Dosage Form Forecast 2020-2030 (US$ billion, AGR %) (U-Shaped Recovery)
Figure 5.25 Global OTC Drugs & Dietary Supplements Market by Dosage Form Forecast 2020-2030 (US$ billion, AGR %) (L-Shaped Recovery)
Figure 5.26 Global OTC Drugs & Dietary Supplements Market by Distribution Channel Forecast 2020-2030 ( US$billion, AGR %)
Figure 5.27 Global OTC Drugs & Dietary Supplements Market by Distribution Channel Forecast 2020-2030 (US$ billion, AGR %) (V-Shaped Recovery)
Figure 5.28 Global OTC Drugs & Dietary Supplements Market by Distribution Channel Forecast 2020-2030 (US$ billion, AGR %) (W-Shaped Recovery)
Figure 5.29 Global OTC Drugs & Dietary Supplements Market by Distribution Channel Forecast 2020-2030 (US$ billion, AGR %) (U-Shaped Recovery)
Figure 5.30 Global OTC Drugs & Dietary Supplements Market by Distribution Channel Forecast 2020-2030 (US$ billion, AGR %) (L-Shaped Recovery)
Figure 6.1 Global Cough, Cold and Flu OTC Drugs Market by Region Forecast 2020-2030 ( US$billion, AGR %)
Figure 6.2 Global Cough, Cold and Flu OTC Drugs Market by Region Forecast 2020-2030 (US$ billion, AGR %) (V-Shaped Recovery)
Figure 6.3 Global Cough, Cold and Flu OTC Drugs Market by Region Forecast 2020-2030 (US$ billion, AGR %) (W-Shaped Recovery)
Figure 6.4 Global Cough, Cold and Flu OTC Drugs Market by Region Forecast 2020-2030 (US$ billion, AGR %) (U-Shaped Recovery)
Figure 6.5 Global Cough, Cold and Flu OTC Drugs Market by Region Forecast 2020-2030 (US$ billion, AGR %) (L-Shaped Recovery)
Figure 6.6 Global Analgesics OTC Drugs Market by Region Forecast 2020-2030 ( US$billion, AGR %)
Figure 6.7 Global Analgesics OTC Drugs Market by Region Forecast 2020-2030 (US$ billion, AGR %) (V-Shaped Recovery)
Figure 6.8 Global Analgesics OTC Drugs Market by Region Forecast 2020-2030 (US$ billion, AGR %) (W-Shaped Recovery)
Figure 6.9 Global Analgesics OTC Drugs Market by Region Forecast 2020-2030 (US$ billion, AGR %) (U-Shaped Recovery)
Figure 6.10 Global Analgesics OTC Drugs Market by Region Forecast 2020-2030 (US$ billion, AGR %) (L-Shaped Recovery)
Figure 6.11 Global Dermatological OTC Drugs Market by Region Forecast 2020-2030 ( US$billion, AGR %)
Figure 6.12 Global Dermatological OTC Drugs Market by Region Forecast 2020-2030 (US$ billion, AGR %) (V-Shaped Recovery)
Figure 6.13 Global Dermatological OTC Drugs Market by Region Forecast 2020-2030 (US$ billion, AGR %) (W-Shaped Recovery)
Figure 6.14 Global Dermatological OTC Drugs Market by Region Forecast 2020-2030 (US$ billion, AGR %) (U-Shaped Recovery)
Figure 6.15 Global Dermatological OTC Drugs Market by Region Forecast 2020-2030 (US$ billion, AGR %) (L-Shaped Recovery)
Figure 6.16 Global Vitamins and Minerals Dietary Supplements Market by Region Forecast 2020-2030 ( US$billion, AGR %)
Figure 6.17 Global Vitamins and Minerals Dietary Supplements Market by Region Forecast 2020-2030 (US$ billion, AGR %) (V-Shaped Recovery)
Figure 6.18 Global Vitamins and Minerals Dietary Supplements Market by Region Forecast 2020-2030 (US$ billion, AGR %) (W-Shaped Recovery)
Figure 6.19 Global Vitamins and Minerals Dietary Supplements Market by Region Forecast 2020-2030 (US$ billion, AGR %) (U-Shaped Recovery)
Figure 6.20 Global Vitamins and Minerals Dietary Supplements Market by Region Forecast 2020-2030 (US$ billion, AGR %) (L-Shaped Recovery)
Figure 6.21 Global Weight Loss/Diet Products Dietary Supplements Market by Region Forecast 2020-2030 ( US$billion, AGR %)
Figure 6.22 Global Weight Loss/Diet Products Dietary Supplements Market by Region Forecast 2020-2030 (US$ billion, AGR %) (V-Shaped Recovery)
Figure 6.23 Global Weight Loss/Diet Products Dietary Supplements Market by Region Forecast 2020-2030 (US$ billion, AGR %) (W-Shaped Recovery)
Figure 6.24 Global Weight Loss/Diet Products Dietary Supplements Market by Region Forecast 2020-2030 (US$ billion, AGR %) (U-Shaped Recovery)
Figure 6.25 Global Weight Loss/Diet Products Dietary Supplements Market by Region Forecast 2020-2030 (US$ billion, AGR %) (L-Shaped Recovery)
Figure 6.26 Global Gastrointestinal Drugs OTC Drugs Market by Region Forecast 2020-2030 ( US$billion, AGR %)
Figure 6.27 Global Gastrointestinal Drugs OTC Drugs Market by Region Forecast 2020-2030 (US$ billion, AGR %) (V-Shaped Recovery)
Figure 6.28 Global Gastrointestinal Drugs OTC Drugs Market by Region Forecast 2020-2030 (US$ billion, AGR %) (W-Shaped Recovery)
Figure 6.29 Global Gastrointestinal Drugs OTC Drugs Market by Region Forecast 2020-2030 (US$ billion, AGR %) (U-Shaped Recovery)
Figure 6.30 Global Gastrointestinal Drugs OTC Drugs Market by Region Forecast 2020-2030 (US$ billion, AGR %) (L-Shaped Recovery)
Figure 6.31 Global Other OTC Drugs & Dietary Supplements Market by Region Forecast 2020-2030 ( US$billion, AGR %)
Figure 6.32 Global Other OTC Drugs & Dietary Supplements Market by Region Forecast 2020-2030 (US$ billion, AGR %) (V-Shaped Recovery)
Figure 6.33 Global Other OTC Drugs & Dietary Supplements Market by Region Forecast 2020-2030 (US$ billion, AGR %) (W-Shaped Recovery)
Figure 6.34 Global Other OTC Drugs & Dietary Supplements Market by Region Forecast 2020-2030 (US$ billion, AGR %) (U-Shaped Recovery)
Figure 6.35 Global Other OTC Drugs & Dietary Supplements Market by Region Forecast 2020-2030 (US$ billion, AGR %) (L-Shaped Recovery)
Figure 7.1 Global Branded OTC Drugs & Dietary Supplements Market by Region Forecast 2020-2030 ( US$billion, AGR %)
Figure 7.2 Global Branded OTC Drugs & Dietary Supplements Market by Region Forecast 2020-2030 (US$ billion, AGR %) (V-Shaped Recovery)
Figure 7.3 Global Branded OTC Drugs & Dietary Supplements Market by Region Forecast 2020-2030 (US$ billion, AGR %) (W-Shaped Recovery)
Figure 7.4 Global Branded OTC Drugs & Dietary Supplements Market by Region Forecast 2020-2030 (US$ billion, AGR %) (U-Shaped Recovery)
Figure 7.5 Global Branded OTC Drugs & Dietary Supplements Market by Region Forecast 2020-2030 (US$ billion, AGR %) (L-Shaped Recovery)
Figure 7.6 Global Generic OTC Drugs & Dietary Supplements Market by Region Forecast 2020-2030 ( US$billion, AGR %)
Figure 7.7 Global Generic OTC Drugs & Dietary Supplements Market by Region Forecast 2020-2030 (US$ billion, AGR %) (V-Shaped Recovery)
Figure 7.8 Global Generic OTC Drugs & Dietary Supplements Market by Region Forecast 2020-2030 (US$ billion, AGR %) (W-Shaped Recovery)
Figure 7.9 Global Generic OTC Drugs & Dietary Supplements Market by Region Forecast 2020-2030 (US$ billion, AGR %) (U-Shaped Recovery)
Figure 7.10 Global Generic OTC Drugs & Dietary Supplements Market by Region Forecast 2020-2030 (US$ billion, AGR %) (L-Shaped Recovery)
Figure 7.11 Global Other Products OTC Drugs & Dietary Supplements Market by Region Forecast 2020-2030 ( US$billion, AGR %)
Figure 7.12 Global Other Products OTC Drugs & Dietary Supplements Market by Region Forecast 2020-2030 (US$ billion, AGR %) (V-Shaped Recovery)
Figure 7.13 Global Other Products OTC Drugs & Dietary Supplements Market by Region Forecast 2020-2030 (US$ billion, AGR %) (W-Shaped Recovery)
Figure 7.14 Global Other Products OTC Drugs & Dietary Supplements Market by Region Forecast 2020-2030 (US$ billion, AGR %) (U-Shaped Recovery)
Figure 7.15 Global Other Products OTC Drugs & Dietary Supplements Market by Region Forecast 2020-2030 (US$ billion, AGR %) (L-Shaped Recovery)
Figure 8.1 Global Tablets OTC Drugs & Dietary Supplements Market by Region Forecast 2020-2030 ( US$billion, AGR %)
Figure 8.2 Global Tablets OTC Drugs & Dietary Supplements Market by Region Forecast 2020-2030 (US$ billion, AGR %) (V-Shaped Recovery)
Figure 8.3 Global Tablets OTC Drugs & Dietary Supplements Market by Region Forecast 2020-2030 (US$ billion, AGR %) (W-Shaped Recovery)
Figure 8.4 Global Tablets OTC Drugs & Dietary Supplements Market by Region Forecast 2020-2030 (US$ billion, AGR %) (U-Shaped Recovery)
Figure 8.5 Global Tablets OTC Drugs & Dietary Supplements Market by Region Forecast 2020-2030 (US$ billion, AGR %) (L-Shaped Recovery)
Figure 8.6 Global Hard Capsules OTC Drugs & Dietary Supplements Market by Region Forecast 2020-2030 ( US$billion, AGR %)
Figure 8.7 Global Hard Capsules OTC Drugs & Dietary Supplements Market by Region Forecast 2020-2030 (US$ billion, AGR %) (V-Shaped Recovery)
Figure 8.8 Global Hard Capsules OTC Drugs & Dietary Supplements Market by Region Forecast 2020-2030 (US$ billion, AGR %) (W-Shaped Recovery)
Figure 8.9 Global Hard Capsules OTC Drugs & Dietary Supplements Market by Region Forecast 2020-2030 (US$ billion, AGR %) (U-Shaped Recovery)
Figure 8.10 Global Hard Capsules OTC Drugs & Dietary Supplements Market by Region Forecast 2020-2030 (US$ billion, AGR %) (L-Shaped Recovery)
Figure 8.11 Global Powders OTC Drugs & Dietary Supplements Market by Region Forecast 2020-2030 ( US$billion, AGR %)
Figure 8.12 Global Powders OTC Drugs & Dietary Supplements Market by Region Forecast 2020-2030 (US$ billion, AGR %) (V-Shaped Recovery)
Figure 8.13 Global Powders OTC Drugs & Dietary Supplements Market by Region Forecast 2020-2030 (US$ billion, AGR %) (W-Shaped Recovery)
Figure 8.14 Global Powders OTC Drugs & Dietary Supplements Market by Region Forecast 2020-2030 (US$ billion, AGR %) (U-Shaped Recovery)
Figure 8.15 Global Powders OTC Drugs & Dietary Supplements Market by Region Forecast 2020-2030 (US$ billion, AGR %) (L-Shaped Recovery)
Figure 8.16 Global Ointments OTC Drugs & Dietary Supplements Market by Region Forecast 2020-2030 ( US$billion, AGR %)
Figure 8.17 Global Ointments OTC Drugs & Dietary Supplements Market by Region Forecast 2020-2030 (US$ billion, AGR %) (V-Shaped Recovery)
Figure 8.18 Global Ointments OTC Drugs & Dietary Supplements Market by Region Forecast 2020-2030 (US$ billion, AGR %) (W-Shaped Recovery)
Figure 8.19 Global Ointments OTC Drugs & Dietary Supplements Market by Region Forecast 2020-2030 (US$ billion, AGR %) (U-Shaped Recovery)
Figure 8.20 Global Ointments OTC Drugs & Dietary Supplements Market by Region Forecast 2020-2030 (US$ billion, AGR %) (L-Shaped Recovery)
Figure 8.21 Global Soft Capsules OTC Drugs & Dietary Supplements Market by Region Forecast 2020-2030 ( US$billion, AGR %)
Figure 8.22 Global Soft Capsules OTC Drugs & Dietary Supplements Market by Region Forecast 2020-2030 (US$ billion, AGR %) (V-Shaped Recovery)
Figure 8.23 Global Soft Capsules OTC Drugs & Dietary Supplements Market by Region Forecast 2020-2030 (US$ billion, AGR %) (W-Shaped Recovery)
Figure 8.24 Global Soft Capsules OTC Drugs & Dietary Supplements Market by Region Forecast 2020-2030 (US$ billion, AGR %) (U-Shaped Recovery)
Figure 8.25 Global Soft Capsules OTC Drugs & Dietary Supplements Market by Region Forecast 2020-2030 (US$ billion, AGR %) (L-Shaped Recovery)
Figure 8.26 Global Liquids OTC Drugs & Dietary Supplements Market by Region Forecast 2020-2030 ( US$billion, AGR %)
Figure 8.27 Global Liquids OTC Drugs & Dietary Supplements Market by Region Forecast 2020-2030 (US$ billion, AGR %) (V-Shaped Recovery)
Figure 8.28 Global Liquids OTC Drugs & Dietary Supplements Market by Region Forecast 2020-2030 (US$ billion, AGR %) (W-Shaped Recovery)
Figure 8.29 Global Liquids OTC Drugs & Dietary Supplements Market by Region Forecast 2020-2030 (US$ billion, AGR %) (U-Shaped Recovery)
Figure 8.30 Global Liquids OTC Drugs & Dietary Supplements Market by Region Forecast 2020-2030 (US$ billion, AGR %) (L-Shaped Recovery)
Figure 8.31 Global Other Dosage Form OTC Drugs & Dietary Supplements Market by Region Forecast 2020-2030 ( US$billion, AGR %)
Figure 8.32 Global Other Dosage Form OTC Drugs & Dietary Supplements Market by Region Forecast 2020-2030 (US$ billion, AGR %) (V-Shaped Recovery)
Figure 8.33 Global Other Dosage Form OTC Drugs & Dietary Supplements Market by Region Forecast 2020-2030 (US$ billion, AGR %) (W-Shaped Recovery)
Figure 8.34 Global Other Dosage Form OTC Drugs & Dietary Supplements Market by Region Forecast 2020-2030 (US$ billion, AGR %) (U-Shaped Recovery)
Figure 8.35 Global Other Dosage Form OTC Drugs & Dietary Supplements Market by Region Forecast 2020-2030 (US$ billion, AGR %) (L-Shaped Recovery)
Figure 9.1 Global Pharmacies/Drugstores OTC Drugs & Dietary Supplements Market by Region Forecast 2020-2030 ( US$billion, AGR %)
Figure 9.2 Global Pharmacies/Drugstores OTC Drugs & Dietary Supplements Market by Region Forecast 2020-2030 (US$ billion, AGR %) (V-Shaped Recovery)
Figure 9.3 Global Pharmacies/Drugstores OTC Drugs & Dietary Supplements Market by Region Forecast 2020-2030 (US$ billion, AGR %) (W-Shaped Recovery)
Figure 9.4 Global Pharmacies/Drugstores OTC Drugs & Dietary Supplements Market by Region Forecast 2020-2030 (US$ billion, AGR %) (U-Shaped Recovery)
Figure 9.5 Global Pharmacies/Drugstores OTC Drugs & Dietary Supplements Market by Region Forecast 2020-2030 (US$ billion, AGR %) (L-Shaped Recovery)
Figure 9.6 Global Supermarkets/Hypermarkets OTC Drugs & Dietary Supplements Market by Region Forecast 2020-2030 ( US$billion, AGR %)
Figure 9.7 Global Supermarkets/Hypermarkets OTC Drugs & Dietary Supplements Market by Region Forecast 2020-2030 (US$ billion, AGR %) (V-Shaped Recovery)
Figure 9.8 Global Supermarkets/Hypermarkets OTC Drugs & Dietary Supplements Market by Region Forecast 2020-2030 (US$ billion, AGR %) (W-Shaped Recovery)
Figure 9.9 Global Supermarkets/Hypermarkets OTC Drugs & Dietary Supplements Market by Region Forecast 2020-2030 (US$ billion, AGR %) (U-Shaped Recovery)
Figure 9.10 Global Supermarkets/Hypermarkets OTC Drugs & Dietary Supplements Market by Region Forecast 2020-2030 (US$ billion, AGR %) (L-Shaped Recovery)
Figure 9.11 Global Convenience Stores OTC Drugs & Dietary Supplements Market by Region Forecast 2020-2030 ( US$billion, AGR %)
Figure 9.12 Global Convenience Stores OTC Drugs & Dietary Supplements Market by Region Forecast 2020-2030 (US$ billion, AGR %) (V-Shaped Recovery)
Figure 9.13 Global Convenience Stores OTC Drugs & Dietary Supplements Market by Region Forecast 2020-2030 (US$ billion, AGR %) (W-Shaped Recovery)
Figure 9.14 Global Convenience Stores OTC Drugs & Dietary Supplements Market by Region Forecast 2020-2030 (US$ billion, AGR %) (U-Shaped Recovery)
Figure 9.15 Global Convenience Stores OTC Drugs & Dietary Supplements Market by Region Forecast 2020-2030 (US$ billion, AGR %) (L-Shaped Recovery)
Figure 9.16 Global Online Drugstore Distribution Channel OTC Drugs & Dietary Supplements Market by Region Forecast 2020-2030 ( US$billion, AGR %)
Figure 9.17 Global Online Drugstore Distribution Channel OTC Drugs & Dietary Supplements Market by Region Forecast 2020-2030 (US$ billion, AGR %) (V-Shaped Recovery)
Figure 9.18 Global Online Drugstore Distribution Channel OTC Drugs & Dietary Supplements Market by Region Forecast 2020-2030 (US$ billion, AGR %) (W-Shaped Recovery)
Figure 9.19 Global Online Drugstore Distribution Channel OTC Drugs & Dietary Supplements Market by Region Forecast 2020-2030 (US$ billion, AGR %) (U-Shaped Recovery)
Figure 9.20 Global Online Drugstore Distribution Channel OTC Drugs & Dietary Supplements Market by Region Forecast 2020-2030 (US$ billion, AGR %) (L-Shaped Recovery)
Figure 9.21 Global Health Food Stores OTC Drugs & Dietary Supplements Market by Region Forecast 2020-2030 ( US$billion, AGR %)
Figure 9.22 Global Health Food Stores OTC Drugs & Dietary Supplements Market by Region Forecast 2020-2030 (US$ billion, AGR %) (V-Shaped Recovery)
Figure 9.23 Global Health Food Stores OTC Drugs & Dietary Supplements Market by Region Forecast 2020-2030 (US$ billion, AGR %) (W-Shaped Recovery)
Figure 9.24 Global Health Food Stores OTC Drugs & Dietary Supplements Market by Region Forecast 2020-2030 (US$ billion, AGR %) (U-Shaped Recovery)
Figure 9.25 Global Health Food Stores OTC Drugs & Dietary Supplements Market by Region Forecast 2020-2030 (US$ billion, AGR %) (L-Shaped Recovery)
Figure 9.26 Global Other Distribution Channel OTC Drugs & Dietary Supplements Market by Region Forecast 2020-2030 ( US$billion, AGR %)
Figure 9.27 Global Other Distribution Channel OTC Drugs & Dietary Supplements Market by Region Forecast 2020-2030 (US$ billion, AGR %) (V-Shaped Recovery)
Figure 9.28 Global Other Distribution Channel OTC Drugs & Dietary Supplements Market by Region Forecast 2020-2030 (US$ billion, AGR %) (W-Shaped Recovery)
Figure 9.29 Global Other Distribution Channel OTC Drugs & Dietary Supplements Market by Region Forecast 2020-2030 (US$ billion, AGR %) (U-Shaped Recovery)
Figure 9.30 Global Other Distribution Channel OTC Drugs & Dietary Supplements Market by Region Forecast 2020-2030 (US$ billion, AGR %) (L-Shaped Recovery)
Figure 10.1 North America OTC Drugs & Dietary Supplements Market by Value Forecast 2020-2030 ( US$billion, AGR %)
Figure 10.2 North America OTC Drugs & Dietary Supplements Market by Value Forecast 2020-2030 (US$ billion, AGR %) (V-Shaped Recovery)
Figure 10.3 North America OTC Drugs & Dietary Supplements Market by Value Forecast 2020-2030 (US$ billion, AGR %) (W-Shaped Recovery)
Figure 10.4 North America OTC Drugs & Dietary Supplements Market by Value Forecast 2020-2030 (US$ billion, AGR %) (U-Shaped Recovery)
Figure 10.5 North America OTC Drugs & Dietary Supplements Market by Value Forecast 2020-2030 (US$ billion, AGR %) (L-Shaped Recovery)
Figure 10.6 North America OTC Drugs & Dietary Supplements Market by Country Forecast 2020-2030 ( US$billion, AGR %)
Figure 10.7 North America OTC Drugs & Dietary Supplements Market by Country Forecast 2020-2030 (US$ billion, AGR %) (V-Shaped Scenario)
Figure 10.8 North America OTC Drugs & Dietary Supplements Market by Country Forecast 2020-2030 (US$ billion, AGR %) (W-Shaped Scenario)
Figure 10.9 North America OTC Drugs & Dietary Supplements Market by Country Forecast 2020-2030 (US$ billion, AGR %) (U-Shaped Scenario)
Figure 10.10 North America OTC Drugs & Dietary Supplements Market by Country Forecast 2020-2030 (US$ billion, AGR %) (L-Shaped Scenario)
Figure 10.11 North America OTC Drugs & Dietary Supplements Market by Category Forecast 2020-2030 ( US$billion, AGR %)
Figure 10.12 North America OTC Drugs & Dietary Supplements Market by Category Forecast 2020-2030 (US$ billion, AGR %) (V-Shaped Recovery)
Figure 10.13 North America OTC Drugs & Dietary Supplements Market by Category Forecast 2020-2030 (US$ billion, AGR %) (W-Shaped Recovery)
Figure 10.14 North America OTC Drugs & Dietary Supplements Market by Category Forecast 2020-2030 (US$ billion, AGR %) (U-Shaped Recovery)
Figure 10.15 North America OTC Drugs & Dietary Supplements Market by Category Forecast 2020-2030 (US$ billion, AGR %) (L-Shaped Recovery)
Figure 10.16 North America OTC Drugs & Dietary Supplements Market by Product Type Forecast 2020-2030 ( US$billion, AGR %)
Figure 10.17 North America OTC Drugs & Dietary Supplements Market by Product Type Forecast 2020-2030 (US$ billion, AGR %) (V-Shaped Recovery)
Figure 10.18 North America OTC Drugs & Dietary Supplements Market by Product Type Forecast 2020-2030 (US$ billion, AGR %) (W-Shaped Recovery)
Figure 10.19 North America OTC Drugs & Dietary Supplements Market by Product Type Forecast 2020-2030 (US$ billion, AGR %) (U-Shaped Recovery)
Figure 10.20 North America OTC Drugs & Dietary Supplements Market by Product Type Forecast 2020-2030 (US$ billion, AGR %) (L-Shaped Recovery)
Figure 10.21 North America OTC Drugs & Dietary Supplements Market by Dosage Form Forecast 2020-2030 ( US$billion, AGR %)
Figure 10.22 North America OTC Drugs & Dietary Supplements Market by Dosage Form Forecast 2020-2030 (US$ billion, AGR %) (V-Shaped Recovery)
Figure 10.23 North America OTC Drugs & Dietary Supplements Market by Dosage Form Forecast 2020-2030 (US$ billion, AGR %) (W-Shaped Recovery)
Figure 10.24 North America OTC Drugs & Dietary Supplements Market by Dosage Form Forecast 2020-2030 (US$ billion, AGR %) (U-Shaped Recovery)
Figure 10.25 North America OTC Drugs & Dietary Supplements Market by Dosage Form Forecast 2020-2030 (US$ billion, AGR %) (L-Shaped Recovery)
Figure 10.26 North America OTC Drugs & Dietary Supplements Market by Distribution Channel Forecast 2020-2030 ( US$billion, AGR %)
Figure 10.27 North America OTC Drugs & Dietary Supplements Market by Distribution Channel Forecast 2020-2030 (US$ billion, AGR %) (V-Shaped Recovery)
Figure 10.28 North America OTC Drugs & Dietary Supplements Market by Distribution Channel Forecast 2020-2030 (US$ billion, AGR %) (W-Shaped Recovery)
Figure 10.29 North America OTC Drugs & Dietary Supplements Market by Distribution Channel Forecast 2020-2030 (US$ billion, AGR %) (U-Shaped Recovery)
Figure 10.30 North America OTC Drugs & Dietary Supplements Market by Distribution Channel Forecast 2020-2030 (US$ billion, AGR %) (L-Shaped Recovery)
Figure 11.1 Europe OTC Drugs & Dietary Supplements Market by Value Forecast 2020-2030 ( US$billion, AGR %)
Figure 11.2 Europe OTC Drugs & Dietary Supplements Market by Value Forecast 2020-2030 (US$ billion, AGR %) (V-Shaped Scenario)
Figure 11.3 Europe OTC Drugs & Dietary Supplements Market by Value Forecast 2020-2030 (US$ billion, AGR %) (W-Shaped Scenario)
Figure 11.4 Europe OTC Drugs & Dietary Supplements Market by Value Forecast 2020-2030 (US$ billion, AGR %) (U-Shaped Scenario)
Figure 11.5 Europe OTC Drugs & Dietary Supplements Market by Value Forecast 2020-2030 (US$ billion, AGR %) (L-Shaped Scenario)
Figure 11.6 Europe OTC Drugs & Dietary Supplements Market by Country Forecast 2020-2030 ( US$billion, AGR %)
Figure 11.7 Europe OTC Drugs & Dietary Supplements Market by Country Forecast 2020-2030 (US$ billion, AGR %) (V-Shaped Scenario)
Figure 11.8 Europe OTC Drugs & Dietary Supplements Market by Country Forecast 2020-2030 (US$ billion, AGR %) (W-Shaped Scenario)
Figure 11.9 Europe OTC Drugs & Dietary Supplements Market by Country Forecast 2020-2030 (US$ billion, AGR %) (U-Shaped Scenario)
Figure 11.10 Europe OTC Drugs & Dietary Supplements Market by Country Forecast 2020-2030 (US$ billion, AGR %) (L-Shaped Scenario)
Figure 11.11 Europe OTC Drugs & Dietary Supplements Market by Category Forecast 2020-2030 ( US$billion, AGR %)
Figure 11.12 Europe OTC Drugs & Dietary Supplements Market by Category Forecast 2020-2030 (US$ billion, AGR %) (V-Shaped Recovery)
Figure 11.13 Europe OTC Drugs & Dietary Supplements Market by Category Forecast 2020-2030 (US$ billion, AGR %) (W-Shaped Recovery)
Figure 11.14 Europe OTC Drugs & Dietary Supplements Market by Category Forecast 2020-2030 (US$ billion, AGR %) (U-Shaped Recovery)
Figure 11.15 Europe OTC Drugs & Dietary Supplements Market by Category Forecast 2020-2030 (US$ billion, AGR %) (L-Shaped Recovery)
Figure 11.16 Europe OTC Drugs & Dietary Supplements Market by Product Type Forecast 2020-2030 ( US$billion, AGR %)
Figure 11.17 Europe OTC Drugs & Dietary Supplements Market by Product Type Forecast 2020-2030 (US$ billion, AGR %) (V-Shaped Recovery)
Figure 11.18 Europe OTC Drugs & Dietary Supplements Market by Product Type Forecast 2020-2030 (US$ billion, AGR %) (W-Shaped Recovery)
Figure 11.19 Europe OTC Drugs & Dietary Supplements Market by Product Type Forecast 2020-2030 (US$ billion, AGR %) (U-Shaped Recovery)
Figure 11.20 Europe OTC Drugs & Dietary Supplements Market by Product Type Forecast 2020-2030 (US$ billion, AGR %) (L-Shaped Recovery)
Figure 11.21 Europe OTC Drugs & Dietary Supplements Market by Dosage Form Forecast 2020-2030 ( US$billion, AGR %)
Figure 11.22 Europe OTC Drugs & Dietary Supplements Market by Dosage Form Forecast 2020-2030 (US$ billion, AGR %) (V-Shaped Recovery)
Figure 11.23 Europe OTC Drugs & Dietary Supplements Market by Dosage Form Forecast 2020-2030 (US$ billion, AGR %) (W-Shaped Recovery)
Figure 11.24 Europe OTC Drugs & Dietary Supplements Market by Dosage Form Forecast 2020-2030 (US$ billion, AGR %) (U-Shaped Recovery)
Figure 11.25 Europe OTC Drugs & Dietary Supplements Market by Dosage Form Forecast 2020-2030 (US$ billion, AGR %) (L-Shaped Recovery)
Figure 11.26 Europe OTC Drugs & Dietary Supplements Market by Distribution Channel Forecast 2020-2030 ( US$billion, AGR %)
Figure 11.27 Europe OTC Drugs & Dietary Supplements Market by Distribution Channel Forecast 2020-2030 (US$ billion, AGR %) (V-Shaped Recovery)
Figure 11.28 Europe OTC Drugs & Dietary Supplements Market by Distribution Channel Forecast 2020-2030 (US$ billion, AGR %) (W-Shaped Recovery)
Figure 11.29 Europe OTC Drugs & Dietary Supplements Market by Distribution Channel Forecast 2020-2030 (US$ billion, AGR %) (U-Shaped Recovery)
Figure 11.30 Europe OTC Drugs & Dietary Supplements Market by Distribution Channel Forecast 2020-2030 (US$ billion, AGR %) (L-Shaped Recovery)
Figure 12.1 Asia-Pacific OTC Drugs & Dietary Supplements Market by Value Forecast 2020-2030 ( US$billion, AGR %)
Figure 12.2 Asia-Pacific OTC Drugs & Dietary Supplements Market by Value Forecast 2020-2030 (US$ billion, AGR %) (V-Shaped Scenario)
Figure 12.3 Asia-Pacific OTC Drugs & Dietary Supplements Market by Value Forecast 2020-2030 (US$ billion, AGR %) (W-Shaped Scenario)
Figure 12.4 Asia-Pacific OTC Drugs & Dietary Supplements Market by Value Forecast 2020-2030 (US$ billion, AGR %) (U-Shaped Scenario)
Figure 12.5 Asia-Pacific OTC Drugs & Dietary Supplements Market by Value Forecast 2020-2030 (US$ billion, AGR %) (L-Shaped Scenario)
Figure 12.6 Asia-Pacific OTC Drugs & Dietary Supplements Market by Country Forecast 2020-2030 ( US$billion, AGR %)
Figure 12.7 Asia-Pacific OTC Drugs & Dietary Supplements Market by Country Forecast 2020-2030 (US$ billion, AGR %) (V-Shaped Scenario)
Figure 12.8 Asia-Pacific OTC Drugs & Dietary Supplements Market by Country Forecast 2020-2030 (US$ billion, AGR %) (W-Shaped Scenario)
Figure 12.9 Asia-Pacific OTC Drugs & Dietary Supplements Market by Country Forecast 2020-2030 (US$ billion, AGR %) (U-Shaped Scenario)
Figure 12.10 Asia-Pacific OTC Drugs & Dietary Supplements Market by Country Forecast 2020-2030 (US$ billion, AGR %) (L-Shaped Scenario)
Figure 12.11 Asia-Pacific OTC Drugs & Dietary Supplements Market by Category Forecast 2020-2030 ( US$billion, AGR %)
Figure 12.12 Asia-Pacific OTC Drugs & Dietary Supplements Market by Category Forecast 2020-2030 (US$ billion, AGR %) (V-Shaped Recovery)
Figure 12.13 Asia-Pacific OTC Drugs & Dietary Supplements Market by Category Forecast 2020-2030 (US$ billion, AGR %) (W-Shaped Recovery)
Figure 12.14 Asia-Pacific OTC Drugs & Dietary Supplements Market by Category Forecast 2020-2030 (US$ billion, AGR %) (U-Shaped Recovery)
Figure 12.15 Asia-Pacific OTC Drugs & Dietary Supplements Market by Category Forecast 2020-2030 (US$ billion, AGR %) (L-Shaped Recovery)
Figure 12.16 Asia-Pacific OTC Drugs & Dietary Supplements Market by Product Type Forecast 2020-2030 ( US$billion, AGR %)
Figure 12.17 Asia-Pacific OTC Drugs & Dietary Supplements Market by Product Type Forecast 2020-2030 (US$ billion, AGR %) (V-Shaped Recovery)
Figure 12.18 Asia-Pacific OTC Drugs & Dietary Supplements Market by Product Type Forecast 2020-2030 (US$ billion, AGR %) (W-Shaped Recovery)
Figure 12.19 Asia-Pacific OTC Drugs & Dietary Supplements Market by Product Type Forecast 2020-2030 (US$ billion, AGR %) (U-Shaped Recovery)
Figure 12.20 Asia-Pacific OTC Drugs & Dietary Supplements Market by Product Type Forecast 2020-2030 (US$ billion, AGR %) (L-Shaped Recovery)
Figure 12.21 Asia-Pacific OTC Drugs & Dietary Supplements Market by Dosage Form Forecast 2020-2030 ( US$billion, AGR %)
Figure 12.22 Asia-Pacific OTC Drugs & Dietary Supplements Market by Dosage Form Forecast 2020-2030 (US$ billion, AGR %) (V-Shaped Recovery)
Figure 12.23 Asia-Pacific OTC Drugs & Dietary Supplements Market by Dosage Form Forecast 2020-2030 (US$ billion, AGR %) (W-Shaped Recovery)
Figure 12.24 Asia-Pacific OTC Drugs & Dietary Supplements Market by Dosage Form Forecast 2020-2030 (US$ billion, AGR %) (U-Shaped Recovery)
Figure 12.25 Asia-Pacific OTC Drugs & Dietary Supplements Market by Dosage Form Forecast 2020-2030 (US$ billion, AGR %) (L-Shaped Recovery)
Figure 12.26 Asia-Pacific OTC Drugs & Dietary Supplements Market by Distribution Channel Forecast 2020-2030 ( US$billion, AGR %)
Figure 12.27 Asia-Pacific OTC Drugs & Dietary Supplements Market by Distribution Channel Forecast 2020-2030 (US$ billion, AGR %) (V-Shaped Recovery)
Figure 12.28 Asia-Pacific OTC Drugs & Dietary Supplements Market by Distribution Channel Forecast 2020-2030 (US$ billion, AGR %) (W-Shaped Recovery)
Figure 12.29 Asia-Pacific OTC Drugs & Dietary Supplements Market by Distribution Channel Forecast 2020-2030 (US$ billion, AGR %) (U-Shaped Recovery)
Figure 12.30 Asia-Pacific OTC Drugs & Dietary Supplements Market by Distribution Channel Forecast 2020-2030 (US$ billion, AGR %) (L-Shaped Recovery)
Figure 13.1 Middle East & Africa OTC Drugs & Dietary Supplements Market by Value Forecast 2020-2030 ( US$billion, AGR %)
Figure 13.2 Middle East & Africa OTC Drugs & Dietary Supplements Market by Value Forecast 2020-2030 (US$ billion, AGR %) (V-Shaped Scenario)
Figure 13.3 Middle East & Africa OTC Drugs & Dietary Supplements Market by Value Forecast 2020-2030 (US$ billion, AGR %) (W-Shaped Scenario)
Figure 13.4 Middle East & Africa OTC Drugs & Dietary Supplements Market by Value Forecast 2020-2030 (US$ billion, AGR %) (U-Shaped Scenario)
Figure 13.5 Middle East & Africa OTC Drugs & Dietary Supplements Market by Value Forecast 2020-2030 (US$ billion, AGR %) (L-Shaped Scenario)
Figure 13.6 Middle East & Africa OTC Drugs & Dietary Supplements Market by Country Forecast 2020-2030 ( US$billion, AGR %)
Figure 13.7 Middle East & Africa OTC Drugs & Dietary Supplements Market by Country Forecast 2020-2030 (US$ billion, AGR %) (V-Shaped Scenario)
Figure 13.8 Middle East & Africa OTC Drugs & Dietary Supplements Market by Country Forecast 2020-2030 (US$ billion, AGR %) (W-Shaped Scenario)
Figure 13.9 Middle East & Africa OTC Drugs & Dietary Supplements Market by Country Forecast 2020-2030 (US$ billion, AGR %) (U-Shaped Scenario)
Figure 13.10 Middle East & Africa OTC Drugs & Dietary Supplements Market by Country Forecast 2020-2030 (US$ billion, AGR %) (L-Shaped Scenario)
Figure 13.11 Middle East & Africa OTC Drugs & Dietary Supplements Market by Category Forecast 2020-2030 ( US$billion, AGR %)
Figure 13.12 Middle East & Africa OTC Drugs & Dietary Supplements Market by Category Forecast 2020-2030 (US$ billion, AGR %) (V-Shaped Recovery)
Figure 13.13 Middle East & Africa OTC Drugs & Dietary Supplements Market by Category Forecast 2020-2030 (US$ billion, AGR %) (W-Shaped Recovery)
Figure 13.14 Middle East & Africa OTC Drugs & Dietary Supplements Market by Category Forecast 2020-2030 (US$ billion, AGR %) (U-Shaped Recovery)
Figure 13.15 Middle East & Africa OTC Drugs & Dietary Supplements Market by Category Forecast 2020-2030 (US$ billion, AGR %) (L-Shaped Recovery)
Figure 13.16 Middle East & Africa OTC Drugs & Dietary Supplements Market by Product Type Forecast 2020-2030 ( US$billion, AGR %)
Figure 13.17 Middle East & Africa OTC Drugs & Dietary Supplements Market by Product Type Forecast 2020-2030 (US$ billion, AGR %) (V-Shaped Recovery)
Figure 13.18 Middle East & Africa OTC Drugs & Dietary Supplements Market by Product Type Forecast 2020-2030 (US$ billion, AGR %) (W-Shaped Recovery)
Figure 13.19 Middle East & Africa OTC Drugs & Dietary Supplements Market by Product Type Forecast 2020-2030 (US$ billion, AGR %) (U-Shaped Recovery)
Figure 13.20 Middle East & Africa OTC Drugs & Dietary Supplements Market by Product Type Forecast 2020-2030 (US$ billion, AGR %) (L-Shaped Recovery)
Figure 13.21 Middle East & Africa OTC Drugs & Dietary Supplements Market by Dosage Form Forecast 2020-2030 ( US$billion, AGR %)
Figure 13.22 Middle East & Africa OTC Drugs & Dietary Supplements Market by Dosage Form Forecast 2020-2030 (US$ billion, AGR %) (V-Shaped Recovery)
Figure 13.23 Middle East & Africa OTC Drugs & Dietary Supplements Market by Dosage Form Forecast 2020-2030 (US$ billion, AGR %) (W-Shaped Recovery)
Figure 13.24 Middle East & Africa OTC Drugs & Dietary Supplements Market by Dosage Form Forecast 2020-2030 (US$ billion, AGR %) (U-Shaped Recovery)
Figure 13.25 Middle East & Africa OTC Drugs & Dietary Supplements Market by Dosage Form Forecast 2020-2030 (US$ billion, AGR %) (L-Shaped Recovery)
Figure 13.26 Middle East & Africa OTC Drugs & Dietary Supplements Market by Distribution Channel Forecast 2020-2030 ( US$billion, AGR %)
Figure 13.27 Middle East & Africa OTC Drugs & Dietary Supplements Market by Distribution Channel Forecast 2020-2030 (US$ billion, AGR %) (V-Shaped Recovery)
Figure 13.28 Middle East & Africa OTC Drugs & Dietary Supplements Market by Distribution Channel Forecast 2020-2030 (US$ billion, AGR %) (W-Shaped Recovery)
Figure 13.29 Middle East & Africa OTC Drugs & Dietary Supplements Market by Distribution Channel Forecast 2020-2030 (US$ billion, AGR %) (U-Shaped Recovery)
Figure 13.30 Middle East & Africa OTC Drugs & Dietary Supplements Market by Distribution Channel Forecast 2020-2030 (US$ billion, AGR %) (L-Shaped Recovery)
Figure 14.1 Latin America OTC Drugs & Dietary Supplements Market by Value Forecast 2020-2030 ( US$billion, AGR %)
Figure 14.2 Latin America OTC Drugs & Dietary Supplements Market by Value Forecast 2020-2030 (US$ billion, AGR %) (V-Shaped Scenario)
Figure 14.3 Latin America OTC Drugs & Dietary Supplements Market by Value Forecast 2020-2030 (US$ billion, AGR %) (W-Shaped Scenario)
Figure 14.4 Latin America OTC Drugs & Dietary Supplements Market by Value Forecast 2020-2030 (US$ billion, AGR %) (U-Shaped Scenario)
Figure 14.5 Latin America OTC Drugs & Dietary Supplements Market by Value Forecast 2020-2030 (US$ billion, AGR %) (L-Shaped Scenario)
Figure 14.6 Latin America OTC Drugs & Dietary Supplements Market by Country Forecast 2020-2030 ( US$billion, AGR %)
Figure 14.7 Latin America OTC Drugs & Dietary Supplements Market by Country Forecast 2020-2030 (US$ billion, AGR %) (V-Shaped Scenario)
Figure 14.8 Latin America OTC Drugs & Dietary Supplements Market by Country Forecast 2020-2030 (US$ billion, AGR %) (W-Shaped Scenario)
Figure 14.9 Latin America OTC Drugs & Dietary Supplements Market by Country Forecast 2020-2030 (US$ billion, AGR %) (U-Shaped Scenario)
Figure 14.10 Latin America OTC Drugs & Dietary Supplements Market by Country Forecast 2020-2030 (US$ billion, AGR %) (L-Shaped Scenario)
Figure 14.11 Latin America OTC Drugs & Dietary Supplements Market by Category Forecast 2020-2030 ( US$billion, AGR %)
Figure 14.12 Latin America OTC Drugs & Dietary Supplements Market by Category Forecast 2020-2030 (US$ billion, AGR %) (V-Shaped Recovery)
Figure 14.13 Latin America OTC Drugs & Dietary Supplements Market by Category Forecast 2020-2030 (US$ billion, AGR %) (W-Shaped Recovery)
Figure 14.14 Latin America OTC Drugs & Dietary Supplements Market by Category Forecast 2020-2030 (US$ billion, AGR %) (U-Shaped Recovery)
Figure 14.15 Latin America OTC Drugs & Dietary Supplements Market by Category Forecast 2020-2030 (US$ billion, AGR %) (L-Shaped Recovery)
Figure 14.16 Latin America OTC Drugs & Dietary Supplements Market by Product Type Forecast 2020-2030 ( US$billion, AGR %)
Figure 14.17 Latin America OTC Drugs & Dietary Supplements Market by Product Type Forecast 2020-2030 (US$ billion, AGR %) (V-Shaped Recovery)
Figure 14.18 Latin America OTC Drugs & Dietary Supplements Market by Product Type Forecast 2020-2030 (US$ billion, AGR %) (W-Shaped Recovery)
Figure 14.19 Latin America OTC Drugs & Dietary Supplements Market by Product Type Forecast 2020-2030 (US$ billion, AGR %) (U-Shaped Recovery)
Figure 14.20 Latin America OTC Drugs & Dietary Supplements Market by Product Type Forecast 2020-2030 (US$ billion, AGR %) (L-Shaped Recovery)
Figure 14.21 Latin America OTC Drugs & Dietary Supplements Market by Dosage Form Forecast 2020-2030 ( US$billion, AGR %)
Figure 14.22 Latin America OTC Drugs & Dietary Supplements Market by Dosage Form Forecast 2020-2030 (US$ billion, AGR %) (V-Shaped Recovery)
Figure 14.23 Latin America OTC Drugs & Dietary Supplements Market by Dosage Form Forecast 2020-2030 (US$ billion, AGR %) (W-Shaped Recovery)
Figure 14.24 Latin America OTC Drugs & Dietary Supplements Market by Dosage Form Forecast 2020-2030 (US$ billion, AGR %) (U-Shaped Recovery)
Figure 14.25 Latin America OTC Drugs & Dietary Supplements Market by Dosage Form Forecast 2020-2030 (US$ billion, AGR %) (L-Shaped Recovery)
Figure 14.26 Latin America OTC Drugs & Dietary Supplements Market by Distribution Channel Forecast 2020-2030 ( US$billion, AGR %)
Figure 14.27 Latin America OTC Drugs & Dietary Supplements Market by Distribution Channel Forecast 2020-2030 (US$ billion, AGR %) (V-Shaped Recovery)
Figure 14.28 Latin America OTC Drugs & Dietary Supplements Market by Distribution Channel Forecast 2020-2030 (US$ billion, AGR %) (W-Shaped Recovery)
Figure 14.29 Latin America OTC Drugs & Dietary Supplements Market by Distribution Channel Forecast 2020-2030 (US$ billion, AGR %) (U-Shaped Recovery)
Figure 14.30 Latin America OTC Drugs & Dietary Supplements Market by Distribution Channel Forecast 2020-2030 (US$ billion, AGR %) (L-Shaped Recovery)
List of Tables
Table 1.1 Global OTC Drugs & Dietary Supplements Market by Value Forecast 2020-2030 (US$ billion, AGR %, CAGR %)
Table 2.1 Global OTC Drugs & Dietary Supplements Market Summary
Table 5.1 Global OTC Drugs & Dietary Supplements Market by Value Forecast 2020-2030 ( US$billion, AGR %, CAGR %)
Table 5.2 Global OTC Drugs & Dietary Supplements Market by Value Forecast 2020-2030 (US$ billion, AGR %, CAGR %) (V-Shaped Recovery)
Table 5.3 Global OTC Drugs & Dietary Supplements Market by Value Forecast 2020-2030 (US$ billion, AGR %, CAGR %) (W-Shaped Recovery)
Table 5.4 Global OTC Drugs & Dietary Supplements Market by Value Forecast 2020-2030 (US$ billion, AGR %, CAGR %) (U-Shaped Recovery)
Table 5.5 Global OTC Drugs & Dietary Supplements Market by Value Forecast 2020-2030 (US$ billion, AGR %, CAGR %) (L-Shaped Recovery)
Table 5.6 Global OTC Drugs & Dietary Supplements Market by Region Forecast 2020-2030 ( US$billion, AGR %, CAGR %)
Table 5.7 Global OTC Drugs & Dietary Supplements Market by Region Forecast 2020-2030 (US$ billion, AGR %, CAGR %) (V-Shaped Recovery)
Table 5.8 Global OTC Drugs & Dietary Supplements Market by Region Forecast 2020-2030 (US$ billion, AGR %, CAGR %) (W-Shaped Recovery)
Table 5.9 Global OTC Drugs & Dietary Supplements Market by Region Forecast 2020-2030 (US$ billion, AGR %, CAGR %) (U-Shaped Recovery)
Table 5.10 Global OTC Drugs & Dietary Supplements Market by Region Forecast 2020-2030 (US$ billion, AGR %, CAGR %) (L-Shaped Recovery)
Table 5.11 Global OTC Drugs & Dietary Supplements Market by Category Forecast 2020-2030 ( US$billion, AGR %, CAGR %)
Table 5.12 Global OTC Drugs & Dietary Supplements Market by Category Forecast 2020-2030 (US$ billion, AGR %, CAGR %) (V-Shaped Recovery)
Table 5.13 Global OTC Drugs & Dietary Supplements Market by Category Forecast 2020-2030 (US$ billion, AGR %, CAGR %) (W-Shaped Recovery)
Table 5.14 Global OTC Drugs & Dietary Supplements Market by Category Forecast 2020-2030 (US$ billion, AGR %, CAGR %) (U-Shaped Recovery)
Table 5.15 Global OTC Drugs & Dietary Supplements Market by Category Forecast 2020-2030 (US$ billion, AGR %, CAGR %) (L-Shaped Recovery)
Table 5.16 Global OTC Drugs & Dietary Supplements Market by Product Type Forecast 2020-2030 ( US$billion, AGR %, CAGR %)
Table 5.17 Global OTC Drugs & Dietary Supplements Market by Product Type Forecast 2020-2030 (US$ billion, AGR %, CAGR %) (V-Shaped Recovery)
Table 5.18 Global OTC Drugs & Dietary Supplements Market by Product Type Forecast 2020-2030 (US$ billion, AGR %, CAGR %) (W-Shaped Recovery)
Table 5.19 Global OTC Drugs & Dietary Supplements Market by Product Type Forecast 2020-2030 (US$ billion, AGR %, CAGR %) (U-Shaped Recovery)
Table 5.20 Global OTC Drugs & Dietary Supplements Market by Product Type Forecast 2020-2030 (US$ billion, AGR %, CAGR %) (L-Shaped Recovery)
Table 5.21 Global OTC Drugs & Dietary Supplements Market by Dosage Form Forecast 2020-2030 ( US$billion, AGR %, CAGR %)
Table 5.22 Global OTC Drugs & Dietary Supplements Market by Dosage Form Forecast 2020-2030 (US$ billion, AGR %, CAGR %) (V-Shaped Recovery)
Table 5.23 Global OTC Drugs & Dietary Supplements Market by Dosage Form Forecast 2020-2030 (US$ billion, AGR %, CAGR %) (W-Shaped Recovery)
Table 5.24 Global OTC Drugs & Dietary Supplements Market by Dosage Form Forecast 2020-2030 (US$ billion, AGR %, CAGR %) (U-Shaped Recovery)
Table 5.25 Global OTC Drugs & Dietary Supplements Market by Dosage Form Forecast 2020-2030 (US$ billion, AGR %, CAGR %) (L-Shaped Recovery)
Table 5.26 Global OTC Drugs & Dietary Supplements Market by Distribution Channel Forecast 2020-2030 ( US$billion, AGR %, CAGR %)
Table 5.27 Global OTC Drugs & Dietary Supplements Market by Distribution Channel Forecast 2020-2030 (US$ billion, AGR %, CAGR %) (V-Shaped Recovery)
Table 5.28 Global OTC Drugs & Dietary Supplements Market by Distribution Channel Forecast 2020-2030 (US$ billion, AGR %, CAGR %) (W-Shaped Recovery)
Table 5.29 Global OTC Drugs & Dietary Supplements Market by Distribution Channel Forecast 2020-2030 (US$ billion, AGR %, CAGR %) (U-Shaped Recovery)
Table 5.30 Global OTC Drugs & Dietary Supplements Market by Distribution Channel Forecast 2020-2030 (US$ billion, AGR %, CAGR %) (L-Shaped Recovery)
Table 6.1 Global Cough, Cold and Flu OTC Drugs Market by Region Forecast 2020-2030 ( US$billion, AGR %, CAGR %)
Table 6.2 Global Cough, Cold and Flu OTC Drugs Market by Region Forecast 2020-2030 (US$ billion, AGR %, CAGR %) (V-Shaped Recovery)
Table 6.3 Global Cough, Cold and Flu OTC Drugs Market by Region Forecast 2020-2030 (US$ billion, AGR %, CAGR %) (W-Shaped Recovery)
Table 6.4 Global Cough, Cold and Flu OTC Drugs Market by Region Forecast 2020-2030 (US$ billion, AGR %, CAGR %) (U-Shaped Recovery)
Table 6.5 Global Cough, Cold and Flu OTC Drugs Market by Region Forecast 2020-2030 (US$ billion, AGR %, CAGR %) (L-Shaped Recovery)
Table 6.6 Global Analgesics OTC Drugs Market by Region Forecast 2020-2030 ( US$billion, AGR %, CAGR %)
Table 6.7 Global Analgesics OTC Drugs Market by Region Forecast 2020-2030 (US$ billion, AGR %, CAGR %) (V-Shaped Recovery)
Table 6.8 Global Analgesics OTC Drugs Market by Region Forecast 2020-2030 (US$ billion, AGR %, CAGR %) (W-Shaped Recovery)
Table 6.9 Global Analgesics OTC Drugs Market by Region Forecast 2020-2030 (US$ billion, AGR %, CAGR %) (U-Shaped Recovery)
Table 6.10 Global Analgesics OTC Drugs Market by Region Forecast 2020-2030 (US$ billion, AGR %, CAGR %) (L-Shaped Recovery)
Table 6.11 Global Dermatological OTC Drugs Market by Region Forecast 2020-2030 ( US$billion, AGR %, CAGR %)
Table 6.12 Global Dermatological OTC Drugs Market by Region Forecast 2020-2030 (US$ billion, AGR %, CAGR %) (V-Shaped Recovery)
Table 6.13 Global Dermatological OTC Drugs Market by Region Forecast 2020-2030 (US$ billion, AGR %, CAGR %) (W-Shaped Recovery)
Table 6.14 Global Dermatological OTC Drugs Market by Region Forecast 2020-2030 (US$ billion, AGR %, CAGR %) (U-Shaped Recovery)
Table 6.15 Global Dermatological OTC Drugs Market by Region Forecast 2020-2030 (US$ billion, AGR %, CAGR %) (L-Shaped Recovery)
Table 6.16 Global Vitamins and Minerals Dietary Supplements Market by Region Forecast 2020-2030 ( US$billion, AGR %, CAGR %)
Table 6.17 Global Vitamins and Minerals Dietary Supplements Market by Region Forecast 2020-2030 (US$ billion, AGR %, CAGR %) (V-Shaped Recovery)
Table 6.18 Global Vitamins and Minerals Dietary Supplements Market by Region Forecast 2020-2030 (US$ billion, AGR %, CAGR %) (W-Shaped Recovery)
Table 6.19 Global Vitamins and Minerals Dietary Supplements Market by Region Forecast 2020-2030 (US$ billion, AGR %, CAGR %) (U-Shaped Recovery)
Table 6.20 Global Vitamins and Minerals Dietary Supplements Market by Region Forecast 2020-2030 (US$ billion, AGR %, CAGR %) (L-Shaped Recovery)
Table 6.21 Global Weight Loss/Diet Products Dietary Supplements Market by Region Forecast 2020-2030 ( US$billion, AGR %, CAGR %)
Table 6.22 Global Weight Loss/Diet Products Dietary Supplements Market by Region Forecast 2020-2030 (US$ billion, AGR %, CAGR %) (V-Shaped Recovery)
Table 6.23 Global Weight Loss/Diet Products Dietary Supplements Market by Region Forecast 2020-2030 (US$ billion, AGR %, CAGR %) (W-Shaped Recovery)
Table 6.24 Global Weight Loss/Diet Products Dietary Supplements Market by Region Forecast 2020-2030 (US$ billion, AGR %, CAGR %) (U-Shaped Recovery)
Table 6.25 Global Weight Loss/Diet Products Dietary Supplements Market by Region Forecast 2020-2030 (US$ billion, AGR %, CAGR %) (L-Shaped Recovery)
Table 6.26 Global Gastrointestinal Drugs OTC Drugs Market by Region Forecast 2020-2030 ( US$billion, AGR %, CAGR %)
Table 6.27 Global Gastrointestinal Drugs OTC Drugs Market by Region Forecast 2020-2030 (US$ billion, AGR %, CAGR %) (V-Shaped Recovery)
Table 6.28 Global Gastrointestinal Drugs OTC Drugs Market by Region Forecast 2020-2030 (US$ billion, AGR %, CAGR %) (W-Shaped Recovery)
Table 6.29 Global Gastrointestinal Drugs OTC Drugs Market by Region Forecast 2020-2030 (US$ billion, AGR %, CAGR %) (U-Shaped Recovery)
Table 6.30 Global Gastrointestinal Drugs OTC Drugs Market by Region Forecast 2020-2030 (US$ billion, AGR %, CAGR %) (L-Shaped Recovery)
Table 6.31 Global Other OTC Drugs & Dietary Supplements Market by Region Forecast 2020-2030 ( US$billion, AGR %, CAGR %)
Table 6.32 Global Other OTC Drugs & Dietary Supplements Market by Region Forecast 2020-2030 (US$ billion, AGR %, CAGR %) (V-Shaped Recovery)
Table 6.33 Global Other OTC Drugs & Dietary Supplements Market by Region Forecast 2020-2030 (US$ billion, AGR %, CAGR %) (W-Shaped Recovery)
Table 6.34 Global Other OTC Drugs & Dietary Supplements Market by Region Forecast 2020-2030 (US$ billion, AGR %, CAGR %) (U-Shaped Recovery)
Table 6.35 Global Other OTC Drugs & Dietary Supplements Market by Region Forecast 2020-2030 (US$ billion, AGR %, CAGR %) (L-Shaped Recovery)
Table 7.1 Global Branded OTC Drugs & Dietary Supplements Market by Region Forecast 2020-2030 ( US$billion, AGR %, CAGR %)
Table 7.2 Global Branded OTC Drugs & Dietary Supplements Market by Region Forecast 2020-2030 (US$ billion, AGR %, CAGR %) (V-Shaped Recovery)
Table 7.3 Global Branded OTC Drugs & Dietary Supplements Market by Region Forecast 2020-2030 (US$ billion, AGR %, CAGR %) (W-Shaped Recovery)
Table 7.4 Global Branded OTC Drugs & Dietary Supplements Market by Region Forecast 2020-2030 (US$ billion, AGR %, CAGR %) (U-Shaped Recovery)
Table 7.5 Global Branded OTC Drugs & Dietary Supplements Market by Region Forecast 2020-2030 (US$ billion, AGR %, CAGR %) (L-Shaped Recovery)
Table 7.6 Global Generic OTC Drugs & Dietary Supplements Market by Region Forecast 2020-2030 ( US$billion, AGR %, CAGR %)
Table 7.7 Global Generic OTC Drugs & Dietary Supplements Market by Region Forecast 2020-2030 (US$ billion, AGR %, CAGR %) (V-Shaped Recovery)
Table 7.8 Global Generic OTC Drugs & Dietary Supplements Market by Region Forecast 2020-2030 (US$ billion, AGR %, CAGR %) (W-Shaped Recovery)
Table 7.9 Global Generic OTC Drugs & Dietary Supplements Market by Region Forecast 2020-2030 (US$ billion, AGR %, CAGR %) (U-Shaped Recovery)
Table 7.10 Global Generic OTC Drugs & Dietary Supplements Market by Region Forecast 2020-2030 (US$ billion, AGR %, CAGR %) (L-Shaped Recovery)
Table 7.11 Global Other Products OTC Drugs & Dietary Supplements Market by Region Forecast 2020-2030 ( US$billion, AGR %, CAGR %)
Table 7.12 Global Other Products OTC Drugs & Dietary Supplements Market by Region Forecast 2020-2030 (US$ billion, AGR %, CAGR %) (V-Shaped Recovery)
Table 7.13 Global Other Products OTC Drugs & Dietary Supplements Market by Region Forecast 2020-2030 (US$ billion, AGR %, CAGR %) (W-Shaped Recovery)
Table 7.14 Global Other Products OTC Drugs & Dietary Supplements Market by Region Forecast 2020-2030 (US$ billion, AGR %, CAGR %) (U-Shaped Recovery)
Table 7.15 Global Other Products OTC Drugs & Dietary Supplements Market by Region Forecast 2020-2030 (US$ billion, AGR %, CAGR %) (L-Shaped Recovery)
Table 8.1 Global Tablets OTC Drugs & Dietary Supplements Market by Region Forecast 2020-2030 ( US$billion, AGR %, CAGR %)
Table 8.2 Global Tablets OTC Drugs & Dietary Supplements Market by Region Forecast 2020-2030 (US$ billion, AGR %, CAGR %) (V-Shaped Recovery)
Table 8.3 Global Tablets OTC Drugs & Dietary Supplements Market by Region Forecast 2020-2030 (US$ billion, AGR %, CAGR %) (W-Shaped Recovery)
Table 8.4 Global Tablets OTC Drugs & Dietary Supplements Market by Region Forecast 2020-2030 (US$ billion, AGR %, CAGR %) (U-Shaped Recovery)
Table 8.5 Global Tablets OTC Drugs & Dietary Supplements Market by Region Forecast 2020-2030 (US$ billion, AGR %, CAGR %) (L-Shaped Recovery)
Table 8.6 Global Hard Capsules OTC Drugs & Dietary Supplements Market by Region Forecast 2020-2030 ( US$billion, AGR %, CAGR %)
Table 8.7 Global Hard Capsules OTC Drugs & Dietary Supplements Market by Region Forecast 2020-2030 (US$ billion, AGR %, CAGR %) (V-Shaped Recovery)
Table 8.8 Global Hard Capsules OTC Drugs & Dietary Supplements Market by Region Forecast 2020-2030 (US$ billion, AGR %, CAGR %) (W-Shaped Recovery)
Table 8.9 Global Hard Capsules OTC Drugs & Dietary Supplements Market by Region Forecast 2020-2030 (US$ billion, AGR %, CAGR %) (U-Shaped Recovery)
Table 8.10 Global Hard Capsules OTC Drugs & Dietary Supplements Market by Region Forecast 2020-2030 (US$ billion, AGR %, CAGR %) (L-Shaped Recovery)
Table 8.11 Global Powders OTC Drugs & Dietary Supplements Market by Region Forecast 2020-2030 ( US$billion, AGR %, CAGR %)
Table 8.12 Global Powders OTC Drugs & Dietary Supplements Market by Region Forecast 2020-2030 (US$ billion, AGR %, CAGR %) (V-Shaped Recovery)
Table 8.13 Global Powders OTC Drugs & Dietary Supplements Market by Region Forecast 2020-2030 (US$ billion, AGR %, CAGR %) (W-Shaped Recovery)
Table 8.14 Global Powders OTC Drugs & Dietary Supplements Market by Region Forecast 2020-2030 (US$ billion, AGR %, CAGR %) (U-Shaped Recovery)
Table 8.15 Global Powders OTC Drugs & Dietary Supplements Market by Region Forecast 2020-2030 (US$ billion, AGR %, CAGR %) (L-Shaped Recovery)
Table 8.16 Global Ointments OTC Drugs & Dietary Supplements Market by Region Forecast 2020-2030 ( US$billion, AGR %, CAGR %)
Table 8.17 Global Ointments OTC Drugs & Dietary Supplements Market by Region Forecast 2020-2030 (US$ billion, AGR %, CAGR %) (V-Shaped Recovery)
Table 8.18 Global Ointments OTC Drugs & Dietary Supplements Market by Region Forecast 2020-2030 (US$ billion, AGR %, CAGR %) (W-Shaped Recovery)
Table 8.19 Global Ointments OTC Drugs & Dietary Supplements Market by Region Forecast 2020-2030 (US$ billion, AGR %, CAGR %) (U-Shaped Recovery)
Table 8.20 Global Ointments OTC Drugs & Dietary Supplements Market by Region Forecast 2020-2030 (US$ billion, AGR %, CAGR %) (L-Shaped Recovery)
Table 8.21 Global Soft Capsules OTC Drugs & Dietary Supplements Market by Region Forecast 2020-2030 ( US$billion, AGR %, CAGR %)
Table 8.22 Global Soft Capsules OTC Drugs & Dietary Supplements Market by Region Forecast 2020-2030 (US$ billion, AGR %, CAGR %) (V-Shaped Recovery)
Table 8.23 Global Soft Capsules OTC Drugs & Dietary Supplements Market by Region Forecast 2020-2030 (US$ billion, AGR %, CAGR %) (W-Shaped Recovery)
Table 8.24 Global Soft Capsules OTC Drugs & Dietary Supplements Market by Region Forecast 2020-2030 (US$ billion, AGR %, CAGR %) (U-Shaped Recovery)
Table 8.25 Global Soft Capsules OTC Drugs & Dietary Supplements Market by Region Forecast 2020-2030 (US$ billion, AGR %, CAGR %) (L-Shaped Recovery)
Table 8.26 Global Liquids OTC Drugs & Dietary Supplements Market by Region Forecast 2020-2030 ( US$billion, AGR %, CAGR %)
Table 8.27 Global Liquids OTC Drugs & Dietary Supplements Market by Region Forecast 2020-2030 (US$ billion, AGR %, CAGR %) (V-Shaped Recovery)
Table 8.28 Global Liquids OTC Drugs & Dietary Supplements Market by Region Forecast 2020-2030 (US$ billion, AGR %, CAGR %) (W-Shaped Recovery)
Table 8.29 Global Liquids OTC Drugs & Dietary Supplements Market by Region Forecast 2020-2030 (US$ billion, AGR %, CAGR %) (U-Shaped Recovery)
Table 8.30 Global Liquids OTC Drugs & Dietary Supplements Market by Region Forecast 2020-2030 (US$ billion, AGR %, CAGR %) (L-Shaped Recovery)
Table 8.31 Global Other Dosage Form OTC Drugs & Dietary Supplements Market by Region Forecast 2020-2030 ( US$billion, AGR %, CAGR %)
Table 8.32 Global Other Dosage Form OTC Drugs & Dietary Supplements Market by Region Forecast 2020-2030 (US$ billion, AGR %, CAGR %) (V-Shaped Recovery)
Table 8.33 Global Other Dosage Form OTC Drugs & Dietary Supplements Market by Region Forecast 2020-2030 (US$ billion, AGR %, CAGR %) (W-Shaped Recovery)
Table 8.34 Global Other Dosage Form OTC Drugs & Dietary Supplements Market by Region Forecast 2020-2030 (US$ billion, AGR %, CAGR %) (U-Shaped Recovery)
Table 8.35 Global Other Dosage Form OTC Drugs & Dietary Supplements Market by Region Forecast 2020-2030 (US$ billion, AGR %, CAGR %) (L-Shaped Recovery)
Table 9.1 Global Pharmacies/Drugstores OTC Drugs & Dietary Supplements Market by Region Forecast 2020-2030 ( US$billion, AGR %, CAGR %)
Table 9.2 Global Pharmacies/Drugstores OTC Drugs & Dietary Supplements Market by Region Forecast 2020-2030 (US$ billion, AGR %, CAGR %) (V-Shaped Recovery)
Table 9.3 Global Pharmacies/Drugstores OTC Drugs & Dietary Supplements Market by Region Forecast 2020-2030 (US$ billion, AGR %, CAGR %) (W-Shaped Recovery)
Table 9.4 Global Pharmacies/Drugstores OTC Drugs & Dietary Supplements Market by Region Forecast 2020-2030 (US$ billion, AGR %, CAGR %) (U-Shaped Recovery)
Table 9.5 Global Pharmacies/Drugstores OTC Drugs & Dietary Supplements Market by Region Forecast 2020-2030 (US$ billion, AGR %, CAGR %) (L-Shaped Recovery)
Table 9.6 Global Supermarkets/Hypermarkets OTC Drugs & Dietary Supplements Market by Region Forecast 2020-2030 ( US$billion, AGR %, CAGR %)
Table 9.7 Global Supermarkets/Hypermarkets OTC Drugs & Dietary Supplements Market by Region Forecast 2020-2030 (US$ billion, AGR %, CAGR %) (V-Shaped Recovery)
Table 9.8 Global Supermarkets/Hypermarkets OTC Drugs & Dietary Supplements Market by Region Forecast 2020-2030 (US$ billion, AGR %, CAGR %) (W-Shaped Recovery)
Table 9.9 Global Supermarkets/Hypermarkets OTC Drugs & Dietary Supplements Market by Region Forecast 2020-2030 (US$ billion, AGR %, CAGR %) (U-Shaped Recovery)
Table 9.10 Global Supermarkets/Hypermarkets OTC Drugs & Dietary Supplements Market by Region Forecast 2020-2030 (US$ billion, AGR %, CAGR %) (L-Shaped Recovery)
Table 9.11 Global Convenience Stores OTC Drugs & Dietary Supplements Market by Region Forecast 2020-2030 ( US$billion, AGR %, CAGR %)
Table 9.12 Global Convenience Stores OTC Drugs & Dietary Supplements Market by Region Forecast 2020-2030 (US$ billion, AGR %, CAGR %) (V-Shaped Recovery)
Table 9.13 Global Convenience Stores OTC Drugs & Dietary Supplements Market by Region Forecast 2020-2030 (US$ billion, AGR %, CAGR %) (W-Shaped Recovery)
Table 9.14 Global Convenience Stores OTC Drugs & Dietary Supplements Market by Region Forecast 2020-2030 (US$ billion, AGR %, CAGR %) (U-Shaped Recovery)
Table 9.15 Global Convenience Stores OTC Drugs & Dietary Supplements Market by Region Forecast 2020-2030 (US$ billion, AGR %, CAGR %) (L-Shaped Recovery)
Table 9.16 Global Online Drugstore Distribution Channel OTC Drugs & Dietary Supplements Market by Region Forecast 2020-2030 ( US$billion, AGR %, CAGR %)
Table 9.17 Global Online Drugstore Distribution Channel OTC Drugs & Dietary Supplements Market by Region Forecast 2020-2030 (US$ billion, AGR %, CAGR %) (V-Shaped Recovery)
Table 9.18 Global Online Drugstore Distribution Channel OTC Drugs & Dietary Supplements Market by Region Forecast 2020-2030 (US$ billion, AGR %, CAGR %) (W-Shaped Recovery)
Table 9.19 Global Online Drugstore Distribution Channel OTC Drugs & Dietary Supplements Market by Region Forecast 2020-2030 (US$ billion, AGR %, CAGR %) (U-Shaped Recovery)
Table 9.20 Global Online Drugstore Distribution Channel OTC Drugs & Dietary Supplements Market by Region Forecast 2020-2030 (US$ billion, AGR %, CAGR %) (L-Shaped Recovery)
Table 9.21 Global Health Food Stores OTC Drugs & Dietary Supplements Market by Region Forecast 2020-2030 ( US$billion, AGR %, CAGR %)
Table 9.22 Global Health Food Stores OTC Drugs & Dietary Supplements Market by Region Forecast 2020-2030 (US$ billion, AGR %, CAGR %) (V-Shaped Recovery)
Table 9.23 Global Health Food Stores OTC Drugs & Dietary Supplements Market by Region Forecast 2020-2030 (US$ billion, AGR %, CAGR %) (W-Shaped Recovery)
Table 9.24 Global Health Food Stores OTC Drugs & Dietary Supplements Market by Region Forecast 2020-2030 (US$ billion, AGR %, CAGR %) (U-Shaped Recovery)
Table 9.25 Global Health Food Stores OTC Drugs & Dietary Supplements Market by Region Forecast 2020-2030 (US$ billion, AGR %, CAGR %) (L-Shaped Recovery)
Table 9.26 Global Other Distribution Channel OTC Drugs & Dietary Supplements Market by Region Forecast 2020-2030 ( US$billion, AGR %, CAGR %)
Table 9.27 Global Other Distribution Channel OTC Drugs & Dietary Supplements Market by Region Forecast 2020-2030 (US$ billion, AGR %, CAGR %) (V-Shaped Recovery)
Table 9.28 Global Other Distribution Channel OTC Drugs & Dietary Supplements Market by Region Forecast 2020-2030 (US$ billion, AGR %, CAGR %) (W-Shaped Recovery)
Table 9.29 Global Other Distribution Channel OTC Drugs & Dietary Supplements Market by Region Forecast 2020-2030 (US$ billion, AGR %, CAGR %) (U-Shaped Recovery)
Table 9.30 Global Other Distribution Channel OTC Drugs & Dietary Supplements Market by Region Forecast 2020-2030 (US$ billion, AGR %, CAGR %) (L-Shaped Recovery)
Table 10.1 North America OTC Drugs & Dietary Supplements Market by Value Forecast 2020-2030 ( US$billion, AGR %, CAGR %)
Table 10.2 North America OTC Drugs & Dietary Supplements Market by Value Forecast 2020-2030 (US$ billion, AGR %, CAGR %) (V-Shaped Recovery)
Table 10.3 North America OTC Drugs & Dietary Supplements Market by Value Forecast 2020-2030 (US$ billion, AGR %, CAGR %) (W-Shaped Recovery)
Table 10.4 North America OTC Drugs & Dietary Supplements Market by Value Forecast 2020-2030 (US$ billion, AGR %, CAGR %) (U-Shaped Recovery)
Table 10.5 North America OTC Drugs & Dietary Supplements Market by Value Forecast 2020-2030 (US$ billion, AGR %, CAGR %) (L-Shaped Recovery)
Table 10.6 U.S. OTC Drugs & Dietary Supplements Market by Value Forecast 2020-2030 ( US$billion, AGR %, CAGR %)
Table 10.7 U.S. OTC Drugs & Dietary Supplements Market by Value Forecast 2020-2030 (US$ billion, AGR %, CAGR %) (V-Shaped Scenario)
Table 10.8 U.S. OTC Drugs & Dietary Supplements Market by Value Forecast 2020-2030 (US$ billion, AGR %, CAGR %) (W-Shaped Scenario)
Table 10.9 U.S. OTC Drugs & Dietary Supplements Market by Value Forecast 2020-2030 (US$ billion, AGR %, CAGR %) (U-Shaped Scenario)
Table 10.10 U.S. OTC Drugs & Dietary Supplements Market by Value Forecast 2020-2030 (US$ billion, AGR %, CAGR %) (L-Shaped Scenario)
Table 10.11 Canada OTC Drugs & Dietary Supplements Market by Value Forecast 2020-2030 ( US$billion, AGR %, CAGR %)
Table 10.12 Canada OTC Drugs & Dietary Supplements Market by Value Forecast 2020-2030 (US$ billion, AGR %, CAGR %) (V-Shaped Scenario)
Table 10.13 Canada OTC Drugs & Dietary Supplements Market by Value Forecast 2020-2030 (US$ billion, AGR %, CAGR %) (W-Shaped Scenario)
Table 10.14 Canada OTC Drugs & Dietary Supplements Market by Value Forecast 2020-2030 (US$ billion, AGR %, CAGR %) (U-Shaped Scenario)
Table 10.15 Canada OTC Drugs & Dietary Supplements Market by Value Forecast 2020-2030 (US$ billion, AGR %, CAGR %) (L-Shaped Scenario)
Table 10.16 North America OTC Drugs & Dietary Supplements Market by Category Forecast 2020-2030 ( US$billion, AGR %, CAGR %)
Table 10.17 North America OTC Drugs & Dietary Supplements Market by Category Forecast 2020-2030 (US$ billion, AGR %, CAGR %) (V-Shaped Recovery)
Table 10.18 North America OTC Drugs & Dietary Supplements Market by Category Forecast 2020-2030 (US$ billion, AGR %, CAGR %) (W-Shaped Recovery)
Table 10.19 North America OTC Drugs & Dietary Supplements Market by Category Forecast 2020-2030 (US$ billion, AGR %, CAGR %) (U-Shaped Recovery)
Table 10.20 North America OTC Drugs & Dietary Supplements Market by Category Forecast 2020-2030 (US$ billion, AGR %, CAGR %) (L-Shaped Recovery)
Table 10.21 North America OTC Drugs & Dietary Supplements Market by Product Type Forecast 2020-2030 ( US$billion, AGR %, CAGR %)
Table 10.22 North America OTC Drugs & Dietary Supplements Market by Product Type Forecast 2020-2030 (US$ billion, AGR %, CAGR %) (V-Shaped Recovery)
Table 10.23 North America OTC Drugs & Dietary Supplements Market by Product Type Forecast 2020-2030 (US$ billion, AGR %, CAGR %) (W-Shaped Recovery)
Table 10.24 North America OTC Drugs & Dietary Supplements Market by Product Type Forecast 2020-2030 (US$ billion, AGR %, CAGR %) (U-Shaped Recovery)
Table 10.25 North America OTC Drugs & Dietary Supplements Market by Product Type Forecast 2020-2030 (US$ billion, AGR %, CAGR %) (L-Shaped Recovery)
Table 10.26 North America OTC Drugs & Dietary Supplements Market by Dosage Form Forecast 2020-2030 ( US$billion, AGR %, CAGR %)
Table 10.27 North America OTC Drugs & Dietary Supplements Market by Dosage Form Forecast 2020-2030 (US$ billion, AGR %, CAGR %) (V-Shaped Recovery)
Table 10.28 North America OTC Drugs & Dietary Supplements Market by Dosage Form Forecast 2020-2030 (US$ billion, AGR %, CAGR %) (W-Shaped Recovery)
Table 10.29 North America OTC Drugs & Dietary Supplements Market by Dosage Form Forecast 2020-2030 (US$ billion, AGR %, CAGR %) (U-Shaped Recovery)
Table 10.30 North America OTC Drugs & Dietary Supplements Market by Dosage Form Forecast 2020-2030 (US$ billion, AGR %, CAGR %) (L-Shaped Recovery)
Table 10.31 North America OTC Drugs & Dietary Supplements Market by Distribution Channel Forecast 2020-2030 ( US$billion, AGR %, CAGR %)
Table 10.32 North America OTC Drugs & Dietary Supplements Market by Distribution Channel Forecast 2020-2030 (US$ billion, AGR %, CAGR %) (V-Shaped Recovery)
Table 10.33 North America OTC Drugs & Dietary Supplements Market by Distribution Channel Forecast 2020-2030 (US$ billion, AGR %, CAGR %) (W-Shaped Recovery)
Table 10.34 North America OTC Drugs & Dietary Supplements Market by Distribution Channel Forecast 2020-2030 (US$ billion, AGR %, CAGR %) (U-Shaped Recovery)
Table 10.35 North America OTC Drugs & Dietary Supplements Market by Distribution Channel Forecast 2020-2030 (US$ billion, AGR %, CAGR %) (L-Shaped Recovery)
Table 11.1 Europe OTC Drugs & Dietary Supplements Market by Value Forecast 2020-2030 ( US$billion, AGR %, CAGR %)
Table 11.2 Europe OTC Drugs & Dietary Supplements Market by Value Forecast 2020-2030 (US$ billion, AGR %, CAGR %) (V-Shaped Scenario)
Table 11.3 Europe OTC Drugs & Dietary Supplements Market by Value Forecast 2020-2030 (US$ billion, AGR %, CAGR %) (W-Shaped Scenario)
Table 11.4 Europe OTC Drugs & Dietary Supplements Market by Value Forecast 2020-2030 (US$ billion, AGR %, CAGR %) (U-Shaped Scenario)
Table 11.5 Europe OTC Drugs & Dietary Supplements Market by Value Forecast 2020-2030 (US$ billion, AGR %, CAGR %) (L-Shaped Scenario)
Table 11.6 UK OTC Drugs & Dietary Supplements Market by Value Forecast 2020-2030 ( US$billion, AGR %, CAGR %)
Table 11.7 UK OTC Drugs & Dietary Supplements Market by Value Forecast 2020-2030 (US$ billion, AGR %, CAGR %) (V-Shaped Scenario)
Table 11.8 UK OTC Drugs & Dietary Supplements Market by Value Forecast 2020-2030 (US$ billion, AGR %, CAGR %) (W-Shaped Scenario)
Table 11.9 UK OTC Drugs & Dietary Supplements Market by Value Forecast 2020-2030 (US$ billion, AGR %, CAGR %) (U-Shaped Scenario)
Table 11.10 UK OTC Drugs & Dietary Supplements Market by Value Forecast 2020-2030 (US$ billion, AGR %, CAGR %) (L-Shaped Scenario)
Table 11.11 Germany OTC Drugs & Dietary Supplements Market by Value Forecast 2020-2030 ( US$billion, AGR %, CAGR %)
Table 11.12 Germany OTC Drugs & Dietary Supplements Market by Value Forecast 2020-2030 (US$ billion, AGR %, CAGR %) (V-Shaped Scenario)
Table 11.13 Germany OTC Drugs & Dietary Supplements Market by Value Forecast 2020-2030 (US$ billion, AGR %, CAGR %) (W-Shaped Scenario)
Table 11.14 Germany OTC Drugs & Dietary Supplements Market by Value Forecast 2020-2030 (US$ billion, AGR %, CAGR %) (U-Shaped Scenario)
Table 11.15 Germany OTC Drugs & Dietary Supplements Market by Value Forecast 2020-2030 (US$ billion, AGR %, CAGR %) (L-Shaped Scenario)
Table 11.16 France OTC Drugs & Dietary Supplements Market by Value Forecast 2020-2030 ( US$billion, AGR %, CAGR %)
Table 11.17 France OTC Drugs & Dietary Supplements Market by Value Forecast 2020-2030 (US$ billion, AGR %, CAGR %) (V-Shaped Scenario)
Table 11.18 France OTC Drugs & Dietary Supplements Market by Value Forecast 2020-2030 (US$ billion, AGR %, CAGR %) (W-Shaped Scenario)
Table 11.19 France OTC Drugs & Dietary Supplements Market by Value Forecast 2020-2030 (US$ billion, AGR %, CAGR %) (U-Shaped Scenario)
Table 11.20 France OTC Drugs & Dietary Supplements Market by Value Forecast 2020-2030 (US$ billion, AGR %, CAGR %) (L-Shaped Scenario)
Table 11.21 Italy OTC Drugs & Dietary Supplements Market by Value Forecast 2020-2030 ( US$billion, AGR %, CAGR %)
Table 11.22 Italy OTC Drugs & Dietary Supplements Market by Value Forecast 2020-2030 (US$ billion, AGR %, CAGR %) (V-Shaped Scenario)
Table 11.23 Italy OTC Drugs & Dietary Supplements Market by Value Forecast 2020-2030 (US$ billion, AGR %, CAGR %) (W-Shaped Scenario)
Table 11.24 Italy OTC Drugs & Dietary Supplements Market by Value Forecast 2020-2030 (US$ billion, AGR %, CAGR %) (U-Shaped Scenario)
Table 11.25 Italy OTC Drugs & Dietary Supplements Market by Value Forecast 2020-2030 (US$ billion, AGR %, CAGR %) (L-Shaped Scenario)
Table 11.26 Spain OTC Drugs & Dietary Supplements Market by Value Forecast 2020-2030 ( US$billion, AGR %, CAGR %)
Table 11.27 Spain OTC Drugs & Dietary Supplements Market by Value Forecast 2020-2030 (US$ billion, AGR %, CAGR %) (V-Shaped Scenario)
Table 11.28 Spain OTC Drugs & Dietary Supplements Market by Value Forecast 2020-2030 (US$ billion, AGR %, CAGR %) (W-Shaped Scenario)
Table 11.29 Spain OTC Drugs & Dietary Supplements Market by Value Forecast 2020-2030 (US$ billion, AGR %, CAGR %) (U-Shaped Scenario)
Table 11.30 Spain OTC Drugs & Dietary Supplements Market by Value Forecast 2020-2030 (US$ billion, AGR %, CAGR %) (L-Shaped Scenario)
Table 11.31 Rest of Europe OTC Drugs & Dietary Supplements Market by Value Forecast 2020-2030 (US$ billion, AGR %, CAGR %)
Table 11.32 Rest of Europe OTC Drugs & Dietary Supplements Market by Value Forecast 2020-2030 (US$ billion, AGR %, CAGR %) (V-Shaped Scenario)
Table 11.33 Rest of Europe OTC Drugs & Dietary Supplements Market by Value Forecast 2020-2030 (US$ billion, AGR %, CAGR %) (W-Shaped Scenario)
Table 11.34 Rest of Europe OTC Drugs & Dietary Supplements Market by Value Forecast 2020-2030 (US$ billion, AGR %, CAGR %) (U-Shaped Scenario)
Table 11.35 Rest of Europe OTC Drugs & Dietary Supplements Market by Value Forecast 2020-2030 (US$ billion, AGR %, CAGR %) (L-Shaped Scenario)
Table 11.36 Europe OTC Drugs & Dietary Supplements Market by Category Forecast 2020-2030 ( US$billion, AGR %, CAGR %)
Table 11.37 Europe OTC Drugs & Dietary Supplements Market by Category Forecast 2020-2030 (US$ billion, AGR %, CAGR %) (V-Shaped Recovery)
Table 11.38 Europe OTC Drugs & Dietary Supplements Market by Category Forecast 2020-2030 (US$ billion, AGR %, CAGR %) (W-Shaped Recovery)
Table 11.39 Europe OTC Drugs & Dietary Supplements Market by Category Forecast 2020-2030 (US$ billion, AGR %, CAGR %) (U-Shaped Recovery)
Table 11.40 Europe OTC Drugs & Dietary Supplements Market by Category Forecast 2020-2030 (US$ billion, AGR %, CAGR %) (L-Shaped Recovery)
Table 11.41 Europe OTC Drugs & Dietary Supplements Market by Product Type Forecast 2020-2030 ( US$billion, AGR %, CAGR %)
Table 11.42 Europe OTC Drugs & Dietary Supplements Market by Product Type Forecast 2020-2030 (US$ billion, AGR %, CAGR %) (V-Shaped Recovery)
Table 11.43 Europe OTC Drugs & Dietary Supplements Market by Product Type Forecast 2020-2030 (US$ billion, AGR %, CAGR %) (W-Shaped Recovery)
Table 11.44 Europe OTC Drugs & Dietary Supplements Market by Product Type Forecast 2020-2030 (US$ billion, AGR %, CAGR %) (U-Shaped Recovery)
Table 11.45 Europe OTC Drugs & Dietary Supplements Market by Product Type Forecast 2020-2030 (US$ billion, AGR %, CAGR %) (L-Shaped Recovery)
Table 11.46 Europe OTC Drugs & Dietary Supplements Market by Dosage Form Forecast 2020-2030 ( US$billion, AGR %, CAGR %)
Table 11.47 Europe OTC Drugs & Dietary Supplements Market by Dosage Form Forecast 2020-2030 (US$ billion, AGR %, CAGR %) (V-Shaped Recovery)
Table 11.48 Europe OTC Drugs & Dietary Supplements Market by Dosage Form Forecast 2020-2030 (US$ billion, AGR %, CAGR %) (W-Shaped Recovery)
Table 11.49 Europe OTC Drugs & Dietary Supplements Market by Dosage Form Forecast 2020-2030 (US$ billion, AGR %, CAGR %) (U-Shaped Recovery)
Table 11.50 Europe OTC Drugs & Dietary Supplements Market by Dosage Form Forecast 2020-2030 (US$ billion, AGR %, CAGR %) (L-Shaped Recovery)
Table 11.51 Europe OTC Drugs & Dietary Supplements Market by Distribution Channel Forecast 2020-2030 ( US$billion, AGR %, CAGR %)
Table 11.52 Europe OTC Drugs & Dietary Supplements Market by Distribution Channel Forecast 2020-2030 (US$ billion, AGR %, CAGR %) (V-Shaped Recovery)
Table 11.53 Europe OTC Drugs & Dietary Supplements Market by Distribution Channel Forecast 2020-2030 (US$ billion, AGR %, CAGR %) (W-Shaped Recovery)
Table 11.54 Europe OTC Drugs & Dietary Supplements Market by Distribution Channel Forecast 2020-2030 (US$ billion, AGR %, CAGR %) (U-Shaped Recovery)
Table 11.55 Europe OTC Drugs & Dietary Supplements Market by Distribution Channel Forecast 2020-2030 (US$ billion, AGR %, CAGR %) (L-Shaped Recovery)
Table 12.1 Asia-Pacific OTC Drugs & Dietary Supplements Market by Value Forecast 2020-2030 ( US$billion, AGR %, CAGR %)
Table 12.2 Asia-Pacific OTC Drugs & Dietary Supplements Market by Value Forecast 2020-2030 (US$ billion, AGR %, CAGR %) (V-Shaped Scenario)
Table 12.3 Asia-Pacific OTC Drugs & Dietary Supplements Market by Value Forecast 2020-2030 (US$ billion, AGR %, CAGR %) (W-Shaped Scenario)
Table 12.4 Asia-Pacific OTC Drugs & Dietary Supplements Market by Value Forecast 2020-2030 (US$ billion, AGR %, CAGR %) (U-Shaped Scenario)
Table 12.5 Asia-Pacific OTC Drugs & Dietary Supplements Market by Value Forecast 2020-2030 (US$ billion, AGR %, CAGR %) (L-Shaped Scenario)
Table 12.6 China OTC Drugs & Dietary Supplements Market by Value Forecast 2020-2030 ( US$billion, AGR %, CAGR %)
Table 12.7 China OTC Drugs & Dietary Supplements Market by Value Forecast 2020-2030 (US$ billion, AGR %, CAGR %) (V-Shaped Scenario)
Table 12.8 China OTC Drugs & Dietary Supplements Market by Value Forecast 2020-2030 (US$ billion, AGR %, CAGR %) (W-Shaped Scenario)
Table 12.9 China OTC Drugs & Dietary Supplements Market by Value Forecast 2020-2030 (US$ billion, AGR %, CAGR %) (U-Shaped Scenario)
Table 12.10 China OTC Drugs & Dietary Supplements Market by Value Forecast 2020-2030 (US$ billion, AGR %, CAGR %) (L-Shaped Scenario)
Table 12.11 India OTC Drugs & Dietary Supplements Market by Value Forecast 2020-2030 ( US$billion, AGR %, CAGR %)
Table 12.12 India OTC Drugs & Dietary Supplements Market by Value Forecast 2020-2030 (US$ billion, AGR %, CAGR %) (V-Shaped Scenario)
Table 12.13 India OTC Drugs & Dietary Supplements Market by Value Forecast 2020-2030 (US$ billion, AGR %, CAGR %) (W-Shaped Scenario)
Table 12.14 India OTC Drugs & Dietary Supplements Market by Value Forecast 2020-2030 (US$ billion, AGR %, CAGR %) (U-Shaped Scenario)
Table 12.15 India OTC Drugs & Dietary Supplements Market by Value Forecast 2020-2030 (US$ billion, AGR %, CAGR %) (L-Shaped Scenario)
Table 12.16 Japan OTC Drugs & Dietary Supplements Market by Value Forecast 2020-2030 ( US$billion, AGR %, CAGR %)
Table 12.17 Japan OTC Drugs & Dietary Supplements Market by Value Forecast 2020-2030 (US$ billion, AGR %, CAGR %) (V-Shaped Scenario)
Table 12.18 Japan OTC Drugs & Dietary Supplements Market by Value Forecast 2020-2030 (US$ billion, AGR %, CAGR %) (W-Shaped Scenario)
Table 12.19 Japan OTC Drugs & Dietary Supplements Market by Value Forecast 2020-2030 (US$ billion, AGR %, CAGR %) (U-Shaped Scenario)
Table 12.20 Japan OTC Drugs & Dietary Supplements Market by Value Forecast 2020-2030 (US$ billion, AGR %, CAGR %) (L-Shaped Scenario)
Table 12.21 South Korea OTC Drugs & Dietary Supplements Market by Value Forecast 2020-2030 ( US$billion, AGR %, CAGR %)
Table 12.22 South Korea OTC Drugs & Dietary Supplements Market by Value Forecast 2020-2030 (US$ billion, AGR %, CAGR %) (V-Shaped Scenario)
Table 12.23 South Korea OTC Drugs & Dietary Supplements Market by Value Forecast 2020-2030 (US$ billion, AGR %, CAGR %) (W-Shaped Scenario)
Table 12.24 South Korea OTC Drugs & Dietary Supplements Market by Value Forecast 2020-2030 (US$ billion, AGR %, CAGR %) (U-Shaped Scenario)
Table 12.25 South Korea OTC Drugs & Dietary Supplements Market by Value Forecast 2020-2030 (US$ billion, AGR %, CAGR %) (L-Shaped Scenario)
Table 12.26 Australia OTC Drugs & Dietary Supplements Market by Value Forecast 2020-2030 ( US$billion, AGR %, CAGR %)
Table 12.27 Australia OTC Drugs & Dietary Supplements Market by Value Forecast 2020-2030 (US$ billion, AGR %, CAGR %) (V-Shaped Scenario)
Table 12.28 Australia OTC Drugs & Dietary Supplements Market by Value Forecast 2020-2030 (US$ billion, AGR %, CAGR %) (W-Shaped Scenario)
Table 12.29 Australia OTC Drugs & Dietary Supplements Market by Value Forecast 2020-2030 (US$ billion, AGR %, CAGR %) (U-Shaped Scenario)
Table 12.30 Australia OTC Drugs & Dietary Supplements Market by Value Forecast 2020-2030 (US$ billion, AGR %, CAGR %) (L-Shaped Scenario)
Table 12.31 Rest of Asia-Pacific OTC Drugs & Dietary Supplements Market by Value Forecast 2020-2030 ( US$billion, AGR %, CAGR %)
Table 12.32 Rest of Asia-Pacific OTC Drugs & Dietary Supplements Market by Value Forecast 2020-2030 (US$ billion, AGR %, CAGR %) (V-Shaped Scenario)
Table 12.33 Rest of Asia-Pacific OTC Drugs & Dietary Supplements Market by Value Forecast 2020-2030 (US$ billion, AGR %, CAGR %) (W-Shaped Scenario)
Table 12.34 Rest of Asia-Pacific OTC Drugs & Dietary Supplements Market by Value Forecast 2020-2030 (US$ billion, AGR %, CAGR %) (U-Shaped Scenario)
Table 12.35 Rest of Asia-Pacific OTC Drugs & Dietary Supplements Market by Value Forecast 2020-2030 (US$ billion, AGR %, CAGR %) (L-Shaped Scenario)
Table 12.36 Asia-Pacific OTC Drugs & Dietary Supplements Market by Category Forecast 2020-2030 ( US$billion, AGR %, CAGR %)
Table 12.37 Asia-Pacific OTC Drugs & Dietary Supplements Market by Category Forecast 2020-2030 (US$ billion, AGR %, CAGR %) (V-Shaped Recovery)
Table 12.38 Asia-Pacific OTC Drugs & Dietary Supplements Market by Category Forecast 2020-2030 (US$ billion, AGR %, CAGR %) (W-Shaped Recovery)
Table 12.39 Asia-Pacific OTC Drugs & Dietary Supplements Market by Category Forecast 2020-2030 (US$ billion, AGR %, CAGR %) (U-Shaped Recovery)
Table 12.40 Asia-Pacific OTC Drugs & Dietary Supplements Market by Category Forecast 2020-2030 (US$ billion, AGR %, CAGR %) (L-Shaped Recovery)
Table 12.41 Asia-Pacific OTC Drugs & Dietary Supplements Market by Product Type Forecast 2020-2030 ( US$billion, AGR %, CAGR %)
Table 12.42 Asia-Pacific OTC Drugs & Dietary Supplements Market by Product Type Forecast 2020-2030 (US$ billion, AGR %, CAGR %) (V-Shaped Recovery)
Table 12.43 Asia-Pacific OTC Drugs & Dietary Supplements Market by Product Type Forecast 2020-2030 (US$ billion, AGR %, CAGR %) (W-Shaped Recovery)
Table 12.44 Asia-Pacific OTC Drugs & Dietary Supplements Market by Product Type Forecast 2020-2030 (US$ billion, AGR %, CAGR %) (U-Shaped Recovery)
Table 12.45 Asia-Pacific OTC Drugs & Dietary Supplements Market by Product Type Forecast 2020-2030 (US$ billion, AGR %, CAGR %) (L-Shaped Recovery)
Table 12.46 Asia-Pacific OTC Drugs & Dietary Supplements Market by Dosage Form Forecast 2020-2030 ( US$billion, AGR %, CAGR %)
Table 12.47 Asia-Pacific OTC Drugs & Dietary Supplements Market by Dosage Form Forecast 2020-2030 (US$ billion, AGR %, CAGR %) (V-Shaped Recovery)
Table 12.48 Asia-Pacific OTC Drugs & Dietary Supplements Market by Dosage Form Forecast 2020-2030 (US$ billion, AGR %, CAGR %) (W-Shaped Recovery)
Table 12.49 Asia-Pacific OTC Drugs & Dietary Supplements Market by Dosage Form Forecast 2020-2030 (US$ billion, AGR %, CAGR %) (U-Shaped Recovery)
Table 12.50 Asia-Pacific OTC Drugs & Dietary Supplements Market by Dosage Form Forecast 2020-2030 (US$ billion, AGR %, CAGR %) (L-Shaped Recovery)
Table 12.51 Asia-Pacific OTC Drugs & Dietary Supplements Market by Distribution Channel Forecast 2020-2030 ( US$billion, AGR %, CAGR %)
Table 12.52 Asia-Pacific OTC Drugs & Dietary Supplements Market by Distribution Channel Forecast 2020-2030 (US$ billion, AGR %, CAGR %) (V-Shaped Recovery)
Table 12.53 Asia-Pacific OTC Drugs & Dietary Supplements Market by Distribution Channel Forecast 2020-2030 (US$ billion, AGR %, CAGR %) (W-Shaped Recovery)
Table 12.54 Asia-Pacific OTC Drugs & Dietary Supplements Market by Distribution Channel Forecast 2020-2030 (US$ billion, AGR %, CAGR %) (U-Shaped Recovery)
Table 12.55 Asia-Pacific OTC Drugs & Dietary Supplements Market by Distribution Channel Forecast 2020-2030 (US$ billion, AGR %, CAGR %) (L-Shaped Recovery)
Table 13.1 Middle East & Africa OTC Drugs & Dietary Supplements Market by Value Forecast 2020-2030 ( US$billion, AGR %, CAGR %)
Table 13.2 Middle East & Africa OTC Drugs & Dietary Supplements Market by Value Forecast 2020-2030 (US$ billion, AGR %, CAGR %) (V-Shaped Scenario)
Table 13.3 Middle East & Africa OTC Drugs & Dietary Supplements Market by Value Forecast 2020-2030 (US$ billion, AGR %, CAGR %) (W-Shaped Scenario)
Table 13.4 Middle East & Africa OTC Drugs & Dietary Supplements Market by Value Forecast 2020-2030 (US$ billion, AGR %, CAGR %) (U-Shaped Scenario)
Table 13.5 Middle East & Africa OTC Drugs & Dietary Supplements Market by Value Forecast 2020-2030 (US$ billion, AGR %, CAGR %) (L-Shaped Scenario)
Table 13.6 South Africa OTC Drugs & Dietary Supplements Market by Value Forecast 2020-2030 ( US$billion, AGR %, CAGR %)
Table 13.7 South Africa OTC Drugs & Dietary Supplements Market by Value Forecast 2020-2030 (US$ billion, AGR %, CAGR %) (V-Shaped Scenario)
Table 13.8 South Africa OTC Drugs & Dietary Supplements Market by Value Forecast 2020-2030 (US$ billion, AGR %, CAGR %) (W-Shaped Scenario)
Table 13.9 South Africa OTC Drugs & Dietary Supplements Market by Value Forecast 2020-2030 (US$ billion, AGR %, CAGR %) (U-Shaped Scenario)
Table 13.10 South Africa OTC Drugs & Dietary Supplements Market by Value Forecast 2020-2030 (US$ billion, AGR %, CAGR %) (L-Shaped Scenario)
Table 13.11 Turkey OTC Drugs & Dietary Supplements Market by Value Forecast 2020-2030 ( US$billion, AGR %, CAGR %)
Table 13.12 Turkey OTC Drugs & Dietary Supplements Market by Value Forecast 2020-2030 (US$ billion, AGR %, CAGR %) (V-Shaped Scenario)
Table 13.13 Turkey OTC Drugs & Dietary Supplements Market by Value Forecast 2020-2030 (US$ billion, AGR %, CAGR %) (W-Shaped Scenario)
Table 13.14 Turkey OTC Drugs & Dietary Supplements Market by Value Forecast 2020-2030 (US$ billion, AGR %, CAGR %) (U-Shaped Scenario)
Table 13.15 Turkey OTC Drugs & Dietary Supplements Market by Value Forecast 2020-2030 (US$ billion, AGR %, CAGR %) (L-Shaped Scenario)
Table 13.16 Saudi Arabia OTC Drugs & Dietary Supplements Market by Value Forecast 2020-2030 ( US$billion, AGR %, CAGR %)
Table 13.17 Saudi Arabia OTC Drugs & Dietary Supplements Market by Value Forecast 2020-2030 (US$ billion, AGR %, CAGR %) (V-Shaped Scenario)
Table 13.18 Saudi Arabia OTC Drugs & Dietary Supplements Market by Value Forecast 2020-2030 (US$ billion, AGR %, CAGR %) (W-Shaped Scenario)
Table 13.19 Saudi Arabia OTC Drugs & Dietary Supplements Market by Value Forecast 2020-2030 (US$ billion, AGR %, CAGR %) (U-Shaped Scenario)
Table 13.20 Saudi Arabia OTC Drugs & Dietary Supplements Market by Value Forecast 2020-2030 (US$ billion, AGR %, CAGR %) (L-Shaped Scenario)
Table 13.21 UAE OTC Drugs & Dietary Supplements Market by Value Forecast 2020-2030 ( US$billion, AGR %, CAGR %)
Table 13.22 UAE OTC Drugs & Dietary Supplements Market by Value Forecast 2020-2030 (US$ billion, AGR %, CAGR %) (V-Shaped Scenario)
Table 13.23 UAE OTC Drugs & Dietary Supplements Market by Value Forecast 2020-2030 (US$ billion, AGR %, CAGR %) (W-Shaped Scenario)
Table 13.24 UAE OTC Drugs & Dietary Supplements Market by Value Forecast 2020-2030 (US$ billion, AGR %, CAGR %) (U-Shaped Scenario)
Table 13.25 UAE OTC Drugs & Dietary Supplements Market by Value Forecast 2020-2030 (US$ billion, AGR %, CAGR %) (L-Shaped Scenario)
Table 13.26 Qatar OTC Drugs & Dietary Supplements Market by Value Forecast 2020-2030 ( US$billion, AGR %, CAGR %)
Table 13.27 Qatar OTC Drugs & Dietary Supplements Market by Value Forecast 2020-2030 (US$ billion, AGR %, CAGR %) (V-Shaped Scenario)
Table 13.28 Qatar OTC Drugs & Dietary Supplements Market by Value Forecast 2020-2030 (US$ billion, AGR %, CAGR %) (W-Shaped Scenario)
Table 13.29 Qatar OTC Drugs & Dietary Supplements Market by Value Forecast 2020-2030 (US$ billion, AGR %, CAGR %) (U-Shaped Scenario)
Table 13.30 Qatar OTC Drugs & Dietary Supplements Market by Value Forecast 2020-2030 (US$ billion, AGR %, CAGR %) (L-Shaped Scenario)
Table 13.31 Rest of MEA OTC Drugs & Dietary Supplements Market by Value Forecast 2020-2030 ( US$billion, AGR %, CAGR %)
Table 13.32 Rest of MEA OTC Drugs & Dietary Supplements Market by Value Forecast 2020-2030 (US$ billion, AGR %, CAGR %) (V-Shaped Scenario)
Table 13.33 Rest of MEA OTC Drugs & Dietary Supplements Market by Value Forecast 2020-2030 (US$ billion, AGR %, CAGR %) (W-Shaped Scenario)
Table 13.34 Rest of MEA OTC Drugs & Dietary Supplements Market by Value Forecast 2020-2030 (US$ billion, AGR %, CAGR %) (U-Shaped Scenario)
Table 13.35 Rest of MEA OTC Drugs & Dietary Supplements Market by Value Forecast 2020-2030 (US$ billion, AGR %, CAGR %) (L-Shaped Scenario)
Table 13.36 Middle East & Africa OTC Drugs & Dietary Supplements Market by Category Forecast 2020-2030 ( US$billion, AGR %, CAGR %)
Table 13.37 Middle East & Africa OTC Drugs & Dietary Supplements Market by Category Forecast 2020-2030 (US$ billion, AGR %, CAGR %) (V-Shaped Recovery)
Table 13.38 Middle East & Africa OTC Drugs & Dietary Supplements Market by Category Forecast 2020-2030 (US$ billion, AGR %, CAGR %) (W-Shaped Recovery)
Table 13.39 Middle East & Africa OTC Drugs & Dietary Supplements Market by Category Forecast 2020-2030 (US$ billion, AGR %, CAGR %) (U-Shaped Recovery)
Table 13.40 Middle East & Africa OTC Drugs & Dietary Supplements Market by Category Forecast 2020-2030 (US$ billion, AGR %, CAGR %) (L-Shaped Recovery)
Table 13.41 Middle East & Africa OTC Drugs & Dietary Supplements Market by Product Type Forecast 2020-2030 ( US$billion, AGR %, CAGR %)
Table 13.42 Middle East & Africa OTC Drugs & Dietary Supplements Market by Product Type Forecast 2020-2030 (US$ billion, AGR %, CAGR %) (V-Shaped Recovery)
Table 13.43 Middle East & Africa OTC Drugs & Dietary Supplements Market by Product Type Forecast 2020-2030 (US$ billion, AGR %, CAGR %) (W-Shaped Recovery)
Table 13.44 Middle East & Africa OTC Drugs & Dietary Supplements Market by Product Type Forecast 2020-2030 (US$ billion, AGR %, CAGR %) (U-Shaped Recovery)
Table 13.45 Middle East & Africa OTC Drugs & Dietary Supplements Market by Product Type Forecast 2020-2030 (US$ billion, AGR %, CAGR %) (L-Shaped Recovery)
Table 13.46 Middle East & Africa OTC Drugs & Dietary Supplements Market by Dosage Form Forecast 2020-2030 ( US$billion, AGR %, CAGR %)
Table 13.47 Middle East & Africa OTC Drugs & Dietary Supplements Market by Dosage Form Forecast 2020-2030 (US$ billion, AGR %, CAGR %) (V-Shaped Recovery)
Table 13.48 Middle East & Africa OTC Drugs & Dietary Supplements Market by Dosage Form Forecast 2020-2030 (US$ billion, AGR %, CAGR %) (W-Shaped Recovery)
Table 13.49 Middle East & Africa OTC Drugs & Dietary Supplements Market by Dosage Form Forecast 2020-2030 (US$ billion, AGR %, CAGR %) (U-Shaped Recovery)
Table 13.50 Middle East & Africa OTC Drugs & Dietary Supplements Market by Dosage Form Forecast 2020-2030 (US$ billion, AGR %, CAGR %) (L-Shaped Recovery)
Table 13.51 Middle East & Africa OTC Drugs & Dietary Supplements Market by Distribution Channel Forecast 2020-2030 ( US$billion, AGR %, CAGR %)
Table 13.52 Middle East & Africa OTC Drugs & Dietary Supplements Market by Distribution Channel Forecast 2020-2030 (US$ billion, AGR %, CAGR %) (V-Shaped Recovery)
Table 13.53 Middle East & Africa OTC Drugs & Dietary Supplements Market by Distribution Channel Forecast 2020-2030 (US$ billion, AGR %, CAGR %) (W-Shaped Recovery)
Table 13.54 Middle East & Africa OTC Drugs & Dietary Supplements Market by Distribution Channel Forecast 2020-2030 (US$ billion, AGR %, CAGR %) (U-Shaped Recovery)
Table 13.55 Middle East & Africa OTC Drugs & Dietary Supplements Market by Distribution Channel Forecast 2020-2030 (US$ billion, AGR %, CAGR %) (L-Shaped Recovery)
Table 14.1 Latin America OTC Drugs & Dietary Supplements Market by Value Forecast 2020-2030 ( US$billion, AGR %, CAGR %)
Table 14.2 Latin America OTC Drugs & Dietary Supplements Market by Value Forecast 2020-2030 (US$ billion, AGR %, CAGR %) (V-Shaped Scenario)
Table 14.3 Latin America OTC Drugs & Dietary Supplements Market by Value Forecast 2020-2030 (US$ billion, AGR %, CAGR %) (W-Shaped Scenario)
Table 14.4 Latin America OTC Drugs & Dietary Supplements Market by Value Forecast 2020-2030 (US$ billion, AGR %, CAGR %) (U-Shaped Scenario)
Table 14.5 Latin America OTC Drugs & Dietary Supplements Market by Value Forecast 2020-2030 (US$ billion, AGR %, CAGR %) (L-Shaped Scenario)
Table 14.6 Brazil OTC Drugs & Dietary Supplements Market by Value Forecast 2020-2030 ( US$billion, AGR %, CAGR %)
Table 14.7 Brazil OTC Drugs & Dietary Supplements Market by Value Forecast 2020-2030 (US$ billion, AGR %, CAGR %) (V-Shaped Scenario)
Table 14.8 Brazil OTC Drugs & Dietary Supplements Market by Value Forecast 2020-2030 (US$ billion, AGR %, CAGR %) (W-Shaped Scenario)
Table 14.9 Brazil OTC Drugs & Dietary Supplements Market by Value Forecast 2020-2030 (US$ billion, AGR %, CAGR %) (U-Shaped Scenario)
Table 14.10 Brazil OTC Drugs & Dietary Supplements Market by Value Forecast 2020-2030 (US$ billion, AGR %, CAGR %) (L-Shaped Scenario)
Table 14.11 Mexico OTC Drugs & Dietary Supplements Market by Value Forecast 2020-2030 ( US$billion, AGR %, CAGR %)
Table 14.12 Mexico OTC Drugs & Dietary Supplements Market by Value Forecast 2020-2030 (US$ billion, AGR %, CAGR %) (V-Shaped Scenario)
Table 14.13 Mexico OTC Drugs & Dietary Supplements Market by Value Forecast 2020-2030 (US$ billion, AGR %, CAGR %) (W-Shaped Scenario)
Table 14.14 Mexico OTC Drugs & Dietary Supplements Market by Value Forecast 2020-2030 (US$ billion, AGR %, CAGR %) (U-Shaped Scenario)
Table 14.15 Mexico OTC Drugs & Dietary Supplements Market by Value Forecast 2020-2030 (US$ billion, AGR %, CAGR %) (L-Shaped Scenario)
Table 14.16 Colombia OTC Drugs & Dietary Supplements Market by Value Forecast 2020-2030 ( US$billion, AGR %, CAGR %)
Table 14.17 Colombia OTC Drugs & Dietary Supplements Market by Value Forecast 2020-2030 (US$ billion, AGR %, CAGR %) (V-Shaped Scenario)
Table 14.18 Colombia OTC Drugs & Dietary Supplements Market by Value Forecast 2020-2030 (US$ billion, AGR %, CAGR %) (W-Shaped Scenario)
Table 14.19 Colombia OTC Drugs & Dietary Supplements Market by Value Forecast 2020-2030 (US$ billion, AGR %, CAGR %) (U-Shaped Scenario)
Table 14.20 Colombia OTC Drugs & Dietary Supplements Market by Value Forecast 2020-2030 (US$ billion, AGR %, CAGR %) (L-Shaped Scenario)
Table 14.21 Rest of Latin America OTC Drugs & Dietary Supplements Market by Value Forecast 2020-2030 ( US$billion, AGR %, CAGR %)
Table 14.22 Rest of Latin America OTC Drugs & Dietary Supplements Market by Value Forecast 2020-2030 (US$ billion, AGR %, CAGR %) (V-Shaped Scenario)
Table 14.23 Rest of Latin America OTC Drugs & Dietary Supplements Market by Value Forecast 2020-2030 (US$ billion, AGR %, CAGR %) (W-Shaped Scenario)
Table 14.24 Rest of Latin America OTC Drugs & Dietary Supplements Market by Value Forecast 2020-2030 (US$ billion, AGR %, CAGR %) (U-Shaped Scenario)
Table 14.25 Rest of Latin America OTC Drugs & Dietary Supplements Market by Value Forecast 2020-2030 (US$ billion, AGR %, CAGR %) (L-Shaped Scenario)
Table 14.26 Latin America OTC Drugs & Dietary Supplements Market by Category Forecast 2020-2030 ( US$billion, AGR %, CAGR %)
Table 14.27 Latin America OTC Drugs & Dietary Supplements Market by Category Forecast 2020-2030 (US$ billion, AGR %, CAGR %) (V-Shaped Recovery)
Table 14.28 Latin America OTC Drugs & Dietary Supplements Market by Category Forecast 2020-2030 (US$ billion, AGR %, CAGR %) (W-Shaped Recovery)
Table 14.29 Latin America OTC Drugs & Dietary Supplements Market by Category Forecast 2020-2030 (US$ billion, AGR %, CAGR %) (U-Shaped Recovery)
Table 14.30 Latin America OTC Drugs & Dietary Supplements Market by Category Forecast 2020-2030 (US$ billion, AGR %, CAGR %) (L-Shaped Recovery)
Table 14.31 Latin America OTC Drugs & Dietary Supplements Market by Product Type Forecast 2020-2030 ( US$billion, AGR %, CAGR %)
Table 14.32 Latin America OTC Drugs & Dietary Supplements Market by Product Type Forecast 2020-2030 (US$ billion, AGR %, CAGR %) (V-Shaped Recovery)
Table 14.33 Latin America OTC Drugs & Dietary Supplements Market by Product Type Forecast 2020-2030 (US$ billion, AGR %, CAGR %) (W-Shaped Recovery)
Table 14.34 Latin America OTC Drugs & Dietary Supplements Market by Product Type Forecast 2020-2030 (US$ billion, AGR %, CAGR %) (U-Shaped Recovery)
Table 14.35 Latin America OTC Drugs & Dietary Supplements Market by Product Type Forecast 2020-2030 (US$ billion, AGR %, CAGR %) (L-Shaped Recovery)
Table 14.36 Latin America OTC Drugs & Dietary Supplements Market by Dosage Form Forecast 2020-2030 ( US$billion, AGR %, CAGR %)
Table 14.37 Latin America OTC Drugs & Dietary Supplements Market by Dosage Form Forecast 2020-2030 (US$ billion, AGR %, CAGR %) (V-Shaped Recovery)
Table 14.38 Latin America OTC Drugs & Dietary Supplements Market by Dosage Form Forecast 2020-2030 (US$ billion, AGR %, CAGR %) (W-Shaped Recovery)
Table 14.39 Latin America OTC Drugs & Dietary Supplements Market by Dosage Form Forecast 2020-2030 (US$ billion, AGR %, CAGR %) (U-Shaped Recovery)
Table 14.40 Latin America OTC Drugs & Dietary Supplements Market by Dosage Form Forecast 2020-2030 (US$ billion, AGR %, CAGR %) (L-Shaped Recovery)
Table 14.41 Latin America OTC Drugs & Dietary Supplements Market by Distribution Channel Forecast 2020-2030 ( US$billion, AGR %, CAGR %)
Table 14.42 Latin America OTC Drugs & Dietary Supplements Market by Distribution Channel Forecast 2020-2030 (US$ billion, AGR %, CAGR %) (V-Shaped Recovery)
Table 14.43 Latin America OTC Drugs & Dietary Supplements Market by Distribution Channel Forecast 2020-2030 (US$ billion, AGR %, CAGR %) (W-Shaped Recovery)
Table 14.44 Latin America OTC Drugs & Dietary Supplements Market by Distribution Channel Forecast 2020-2030 (US$ billion, AGR %, CAGR %) (U-Shaped Recovery)
Table 14.45 Latin America OTC Drugs & Dietary Supplements Market by Distribution Channel Forecast 2020-2030 (US$ billion, AGR %, CAGR %) (L-Shaped Recovery)
Companies Profiled in the Report
Abbott Laboratories
ASKA Pharmaceutical Co., Ltd.
Fresenius SE & Co KGaA
H Lundbeck A/S
Lupin Limited
Mylan N.V.
Nippon Chemiphar Co., Ltd.
Novartis AG
Pfizer Inc.
Roche Holding AG (Roche)
Sanofi
Sun Pharmaceutical Industries Limited
Taisho Pharmaceutical Holdings Co., Ltd.
Teva Pharmaceutical Industries Limited
List of Other Companies
AbbVie
Alexion Pharmaceuticals
Allergan
Amgen
Angelini Group
Astellas Pharma
AstraZeneca
Bausch Health
Beacons Pharmaceuticals (Pte) Ltd.
BeiGene
Biogen
Boehringer Ingelheim
Bristol-Myers Squibb
Bristol-Myers Squibb
Celgene
Celgene
Dabur India Limited
Daewoong Pharmaceutical
Daiichi Sankyo
Dainippon Sumitomo Pharma
Eisai
Eli Lilly
Emami Limited
Gilead Sciences
Gilead Sciences
Harbin Pharmaceutical Group
Incyte
Ipsen
Jazz Pharmaceuticals
Jeil Pharmaceutical
Jiangzhong Pharmaceutical Co., Ltd
Kissei Pharmaceutical
Kyowa Hakko Kirin
Lundbeck
Lundbeck,
Mallinckrodt
Merck & Co.
Novo Nordisk
Ono Pharmaceutical
Otsuka Pharmaceutical
Regeneron Pharmaceuticals
Renhe (Group) Development Co., Ltd
Santen Pharmaceutical
Seattle Genetics
Shionogi
Shire
Sumitomo Pharma
Sunward Pharmaceutical Pte Ltd
Teijin Pharma
Tianjin SK&F Pharmaceutical Co., Ltd
Torii Pharmaceutical
UCB
Vertex Pharmaceuticals
Wyeth Pharmaceutical
Xi'an-Janssen Pharmaceutical
Yangtze River Pharmaceutical Group
Yunnan Baiyao Group Co., Ltd
Zhejiang Conba Pharmaceutical Co., Ltd,
List of Organizations
American Association of Pharmaceutical Scientists
American Pharmacists Association
American Society of Health Systems Pharmacists
Drug Information Association (DIA)
European Personalised Medicine Association (EPEMED)
Generic Pharmaceutical Association
International Federation of Pharmaceutical Manufacturers & Associations
International Society for Biological and Environmental Repositories (ISBER)
National Association of Boards of Pharmacy
National Association of Chain Drug Stores (NACDS)
National Community Pharmacists Association
National Institute on Drug Abuse (NIDA)
Parenteral Drug Association (PDA)
Pharmaceutical Care Management Association (PCMA)
The American Association of Pharmaceutical Scientists (AAPS)
The Association for Accessible Medicines (AAM)
The Association of the British Pharmaceutical Industry (ABPI)
The BioIndustry Association (BIA)
The European Federation of Pharmaceutical Industries and Associations (EFPIA)
The International Society for Pharmaceutical Engineering (ISPE)
The mission of Biotechnology Industry Organization (BIO)
The Pharmaceutical Research and Manufacturers of America (PhRMA)
U.S. Association Representing Pharmacy Benefit Managers (PBMs)
Download sample pages
Complete the form below to download your free sample pages for OTC Drugs & Dietary Supplements Market Report 2020-2030Related reports
-

Biopharmaceuticals Contract Manufacturing Market Report 2020-2030
As of 2019, the global biopharmaceuticals market’s size was estimated at ~$232 billion. It is expected to grow at a...
Full DetailsPublished: 04 March 2020 -
Pharmaceutical Contract Manufacturing Market Report 2020-2030
Fierce competition, stringent regulations, diminishing research and development, shrinking margins, strong price pressures and patent cliffs encompass today’s drug industry.
...Full DetailsPublished: 10 August 2020 -
CRO Regulatory Services for Generics and Biosimilars Drugs Market Report 2020-2030
Growing demand for contract manufacturing services; concentrating on core competencies of pharmaceutical and biopharmaceutical companies; and increasing demand for biosimilars...Full DetailsPublished: 10 August 2020 -
Top 50 Pharmaceutical Wholesale & Distribution Companies 2021
Our work identifies which organizations hold the greatest potential. Discover their capabilities, progress, and commercial prospects, helping you stay ahead....Full DetailsPublished: 19 July 2021 -
Pharmaceutical Sterility Testing Market Report 2020-2030
The initiative by governments in developing countries to offer cost-effective medications, increase in launch of advanced drug, rise in R&D...
Full DetailsPublished: 01 January 1970 -

Topical Drug Delivery Market Report 2020-2030
Delivery of biologics through the transdermal route is anticipated to open new avenues for the manufacturers of topical drugs. Transdermal...Full DetailsPublished: 22 October 2020 -
Pharmacokinetics Services Market Report 2020-2030
The rise in awareness regarding the importance of implementing pharmacokinetic studies during drug discovery and development have motivated the regulatory...
Full DetailsPublished: 01 January 1970 -

Generic Drugs Market Report 2020-2030
Reduction in healthcare expenditure by generic medicines has been acknowledged for a long time. Multiple studies have proven that substituting...
Full DetailsPublished: 03 July 2020 -

Pharma Wholesale and Distribution Market Forecasts 2020-2030
The pharma wholesale and distribution market is estimated to grow at a CAGR of 5% in the first half of...Full DetailsPublished: 30 September 2019
Download sample pages
Complete the form below to download your free sample pages for OTC Drugs & Dietary Supplements Market Report 2020-2030Do you have any custom requirements we can help you with?
Any specific country, geo region, market segment or specific company information?
Email us today, we can discuss your needs and see how we can help: jamie.roberts@visiongain.com
Would you like a free report overview of the report of your choice?
If so, please drop an email to Jamie Roberts stating your chosen report title to jamie.roberts@visiongain.com
Visiongain’s reports are based on comprehensive primary and secondary research. Those studies provide global market forecasts (sales by drug and class, with sub-markets and leading nations covered) and analyses of market drivers and restraints (including SWOT analysis) and current pipeline developments. To find out more about our reports methodology, please email jamie.roberts@visiongain.com
“Thank you for this Gene Therapy R&D Market report and for how easy the process was. Your colleague was very helpful and the report is just right for my purpose. This is the 2nd good report from Visiongain and a good price.”
Dr Luz Chapa Azuella, Mexico
American Association of Colleges of Pharmacy
American College of Clinical Pharmacy
American Pharmacists Association
American Society for Pharmacy Law
American Society of Consultant Pharmacists
American Society of Health-System Pharmacists
Association of Special Pharmaceutical Manufacturers
Australian College of Pharmacy
Biotechnology Industry Organization
Canadian Pharmacists Association
Canadian Society of Hospital Pharmacists
Chinese Pharmaceutical Association
College of Psychiatric and Neurologic Pharmacists
Danish Association of Pharmaconomists
European Association of Employed Community Pharmacists in Europe
European Medicines Agency
Federal Drugs Agency
General Medical Council
Head of Medicines Agency
International Federation of Pharmaceutical Manufacturers & Associations
International Pharmaceutical Federation
International Pharmaceutical Students’ Federation
Medicines and Healthcare Products Regulatory Agency
National Pharmacy Association
Norwegian Pharmacy Association
Ontario Pharmacists Association
Pakistan Pharmacists Association
Pharmaceutical Association of Mauritius
Pharmaceutical Group of the European Union
Pharmaceutical Society of Australia
Pharmaceutical Society of Ireland
Pharmaceutical Society Of New Zealand
Pharmaceutical Society of Northern Ireland
Professional Compounding Centers of America
Royal Pharmaceutical Society
The American Association of Pharmaceutical Scientists
The BioIndustry Association
The Controlled Release Society
The European Federation of Pharmaceutical Industries and Associations
The European Personalised Medicine Association
The Institute of Clinical Research
The International Society for Pharmaceutical Engineering
The Pharmaceutical Association of Israel
The Pharmaceutical Research and Manufacturers of America
The Pharmacy Guild of Australia
The Society of Hospital Pharmacists of Australia
Latest Pharma news
Visiongain Publishes Drug Delivery Technologies Market Report 2024-2034
The global Drug Delivery Technologies market is estimated at US$1,729.6 billion in 2024 and is projected to grow at a CAGR of 5.5% during the forecast period 2024-2034.
23 April 2024
Visiongain Publishes Cell Therapy Technologies Market Report 2024-2034
The cell therapy technologies market is estimated at US$7,041.3 million in 2024 and is projected to grow at a CAGR of 10.7% during the forecast period 2024-2034.
18 April 2024
Visiongain Publishes Automation in Biopharma Industry Market Report 2024-2034
The global Automation in Biopharma Industry market is estimated at US$1,954.3 million in 2024 and is projected to grow at a CAGR of 7% during the forecast period 2024-2034.
17 April 2024
Visiongain Publishes Anti-obesity Drugs Market Report 2024-2034
The global Anti-obesity Drugs market is estimated at US$11,540.2 million in 2024 and is expected to register a CAGR of 21.2% from 2024 to 2034.
12 April 2024


