Visiongain’s new 183 pages report assesses that the global oil field specialty chemicals market will reach $11.1 billion in 2017.
Are you involved in oil field specialty chemicals or need to understand its market dynamics? If so, then you must read this report
It’s vital that you keep your knowledge up to date. You need this report.
Market scope: This brand new report from Visiongain is a completely fresh market assessment of the oil field specialty chemicals market based upon the latest information. Our new market study contains forecasts, original analysis, company profiles and, most crucially, fresh conclusions. The report gives detailed forecasts and analysis of the oil field specialty chemicals markets by region and end-use sectors.
Oil field specialty chemicals Market Forecast 2017-2027 report responds to your need for definitive market data:
• Where are the oil field specialty chemicals market opportunities?
– 208 tables, charts, and graphs reveal market data allowing you to target your strategy more effectively
• When will the oil field specialty chemicals market grow?
– Global, national and the oil field specialty chemicals submarket forecasts and analysis from 2017-2027 illustrate the market progression
• Which oil field specialty chemicals submarkets will flourish from 2017-2027?
– Drilling Fluids Submarket Forecast 2017-2027
– Well Stimulation Submarket Forecast 2017-2027
– Production Chemicals Submarket Forecast 2017-2027
– Cementing Submarket Forecast 2017-2027
– Workover & Completion Submarket Forecast 2017-2027
– Enhanced Oil Recovery Submarket Forecast 2017-2027
– Corrosion Inhibitors Submarket Forecast 2017-2027
– Biocides Submarket Forecast 2017-2027
– Demulsifiers Submarket Forecast 2017-2027
– Pour-Point Depressants Submarket Forecast 2017-2027
– Surfactants Submarket Forecast 2017-2027
– Natural Polymers Submarket Forecast 2017-2027
– Synthetic Polymers Submarket Forecast 2017-2027
– Others Submarket Forecast 2017-2027
• Where are the regional oil field specialty chemicals market opportunities from 2017-2027?
Focused regional forecasts and analysis explore the future opportunities
– U.S. forecast 2017-2027
– Canada forecast 2017-2027
– Mexico forecast 2017-2027
– Russia forecast 2017-2027
– Norway forecast 2017-2027
– U.K. forecast 2017-2027
– China forecast 2017-2027
– Indonesia forecast 2017-2027
– Malaysia forecast 2017-2027
– Saudi Arabia forecast 2017-2027
– Iran forecast 2017-2027
– Iraq forecast 2017-2027
– UAE forecast 2017-2027
– Nigeria forecast 2017-2027
– Brazil forecast 2017-2027
• What are the factors influencing oil field specialty chemicals market dynamics?
– SWOT analysis explores the factors.
– Research and development (R&D) strategy
– Supply and demand dynamics
– Advances in product quality
• Who are the leading 10 oil field specialty chemicals companies?
– We reveal market share, positioning, capabilities, product portfolios, R&D activity, services, focus, strategies, M&A activity, and future outlook.
– BASF SE
– The Dow Chemical Co.
– Solvay SA
– Schlumberger
– Halliburton
– Baker Hughes, Inc.
– AkzoNobel
– Kemira OYJ
– Clariant AG
– Albemarle Corp.
• Who should read this report?
– Anyone within the Oil Field Specialty Chemicals value chain, including
– Raw material suppliers
– R&D specialists
– CEO’s
– COO’s
– CIO’s
– Business development managers
– Marketing managers
– Technologists
– Investors
– Banks
– Government agencies
– Contractors
Get our report today Oil Field Specialty Chemicals Market 2017-2027: Forecasts By Type (Corrosion Inhibitors, Biocides, Demulsifiers, Pour-Point Depressants, Surfactants, Natural Polymers, Synthetic Polymers), By Application (Drilling Fluids, Well Stimulation, Production Chemicals, Cementing, Workover & Completion, Enhanced Oil Recovery) & By Region Plus Profiles of Top Companies. Avoid missing out – order our report now.
Visiongain is a trading partner with the US Federal Government
CCR Ref number: KD4R6
1. Report Overview
1.1 Global Oil field Specialty Chemicals Market Overview
1.2 Why You Should Read This Report
1.3 How This Report Delivers
1.4 Key Questions Answered by This Analytical Report Include:
1.5 Who is This Report For?
1.6 Methodology
1.6.1 Primary Research
1.6.2 Secondary Research
1.6.3 Market Evaluation & Forecasting Methodology
1.7 Frequently Asked Questions (FAQ)
1.8 Associated Visiongain Reports
1.9 About Visiongain
2. Introduction to the Global Oil Field Specialty Chemicals Market
2.1 Oil Field Specialty Chemicals Market Structure
2.2 Oil Field Specialty Chemicals Market Definition
2.3 Properties of Oil Field Specialty Chemicals
2.4 Where are Oil Field Specialty Chemicals Used?
3. Global Oil Field Specialty Chemicals Market 2017-2027
3.1 How Does Oil Field Specialty Chemicals Demand Compare to GDP Growth?
3.2 The Global Economic Outlook 2017
3.3 Global Oil Field Specialty Chemicals Market Forecast 2017-2027
3.4 Global Oil Field Specialty Chemicals Drivers & Restraints 2017
3.5 Global Oil field Specialty Chemicals Market Trends 2017
4. Global Oil Field Specialty Chemicals Submarket Forecast 2017-2027
4.1 Global Outlook for Oil field Specialty Chemicals Products
4.2 Corrosion Inhibitors Submarket Forecast 2017-2027
4.2.1 Global Corrosion Inhibitors Submarket Cumulative Market Share Forecast 2017-2027
4.2.2 Corrosion Inhibitors Submarket Analysis 2017-2027
4.3 Biocides Submarket Forecast 2017-2027
4.3.1 Global Biocides Submarket Cumulative Market Share Forecast 2017-2027
4.3.2 Biocides Submarket Analysis 2017-2027
4.4 Demulsifiers Submarket Analysis 2017-2027
4.4.1 Global Demulsifier Submarket Cumulative Market Share Forecast 2017-2027
4.4.2 Demulsifier Submarket Analysis 2017-2027
4.5 Pour-Point Depressants Submarket Analysis 2017-2027
4.5.1 Global Pour-Point Depressants Submarket Cumulative Market Share Forecast 2017-2027
4.5.2 Pour-Point Depressants Submarket Analysis 2017-2027
4.6 Surfactants Submarket Analysis 2017-2027
4.6.1 Global Surfactants Submarket Cumulative Market Share Forecast 2017-2027
4.6.2 Surfactants Submarket Analysis 2017-2027
4.7 Natural Polymers Submarket Analysis 2017-2027
4.7.1 Global Natural Polymers Submarket Cumulative Market Share Forecast 2017-2027
4.7.2 Natural Polymers Submarket Analysis 2017-2027
4.8 Synthetic Polymers Submarket Analysis 2017-2027
4.8.1 Global Synthetic Polymers Submarket Cumulative Market Share Forecast 2017-2027
4.8.2 Synthetic Polymers Submarket Analysis 2017-2027
4.9 Other Oil Field Chemicals Submarket Analysis 2017-2027
4.9.1 Global Other Oil Field Chemicals Submarket Cumulative Market Share Forecast 2017-2027
4.9.2 Other Oil Field Chemicals Submarket Analysis 2017-2027
5. Global Oil Field Specialty Chemicals Application Submarket Analysis 2017-2027
5.1 Drilling Fluids Submarket Analysis 2017-2027
5.1.1 Global Drilling Fluids Submarket Cumulative Market Share Forecast 2017-2027
5.1.2 Drilling Fluids Submarket Analysis 2017-2027
5.2 Well Stimulation Submarket Analysis 2017-2027
5.2.1 Global Well Stimulation Submarket Cumulative Market Share Forecast 2017-2027
5.2.2 Well Stimulation Submarket Analysis 2017-2027
5.3 Production Chemicals Submarket Analysis 2017-2027
5.3.1 Global Production Chemicals Submarket Cumulative Market Share Forecast 2017-2027
5.3.2 Production Chemicals Submarket Analysis 2017-2027
5.4 Cementing Submarket Analysis 2017-2027
5.4.1 Global Drilling Fluids Submarket Cumulative Market Share Forecast 2017-2027
5.4.2 Cementing Submarket Analysis 2017-2027
5.5 Workover and Completion Submarket Analysis 2017-2027
5.5.1 Global Workover and Completion Submarket Cumulative Market Share Forecast 2017-2027
5.5.2 Workover and Completion Submarket Analysis 2017-2027
5.6 Enhanced Oil Recovery Submarket Analysis 2017-2027
5.6.1 Global Enhanced Oil Recovery Submarket Cumulative Market Share Forecast 2017-2027
5.6.2 Enhanced Oil Recovery Submarket Analysis 2017-2027
6. Leading National Oil Field Specialty Chemicals Market Forecasts 2017-2027
6.1 An Overview of Leading National Oil Field Specialty Chemicals Market 2017-2017
6.2 U.S. Oil Field Specialty Chemicals Market Forecast 2017-2017
6.2.1 U.S. Oil Field Specialty Chemicals Markets Analysis 2017-2027
6.3 Canada Oil Field Specialty Chemicals Market Forecast 2017-2027
6.3.1 Canada Oil Field Specialty Chemicals Markets Analysis 2017-2027
6.4 Mexico Oil Field Specialty Chemicals Market Forecast 2017-2027
6.4.1 Mexico oil Feld Specialty Chemicals Markets Analysis 2017-2027
6.5 Russia Oil Field Specialty Chemicals Market Forecast 2017-2027
6.5.1 Russia oil Feld Specialty Chemicals Markets Analysis 2017-2027
6.6 Norway Oil Field Specialty Chemicals Market Forecast 2017-2027
6.6.1 Norway Oil Field Specialty Chemicals Markets Analysis 2017-2027
6.7 U.K. Oil Field Specialty Chemicals Market Forecast 2017-2027
6.7.1 U.K. Oil Field Specialty Chemicals Markets Analysis 2017-2027
6.8 China Oil Field Specialty Chemicals Market Forecast 2017-2027
6.8.1 China Oil Field Specialty Chemicals Markets Analysis 2017-2027
6.9 Indonesia Oil Field Specialty Chemicals Market Forecast 2017-2027
6.9.1 Indonesia Oil Field Specialty Chemicals Markets Analysis 2017-2027
6.10 Malaysia Oil Field Specialty Chemicals Market Forecast 2017-2027
6.10.1 Malaysia Oil Field Specialty Chemicals Markets Analysis 2017-2027
6.11 Saudi Arabia Oil Field Specialty Chemicals Market Forecast 2017-2027
6.11.1 Saudi Arabia Oil field specialty chemicals Market Outlook
6.12 Iran Oil Field Specialty Chemicals Market Forecast 2017-2027
6.12.1 Iran Oil Field Specialty Chemicals Markets Analysis 2017-2027
6.13 Iraq Oil Field Specialty Chemicals Market Forecast 2017-2027
6.13.1 Iraq Oil Field Specialty Chemicals Markets Analysis 2017-2027
6.14 UAE Oil Field Specialty Chemicals Market Forecast 2017-2027
6.14.1 UAE Oil Field Specialty Chemicals Markets Analysis 2017-2027
6.15 Nigeria Oil Field Specialty Chemicals Market Forecast 2017-2027
6.15.1 Nigeria Oil Field Specialty Chemicals Markets Analysis 2017-2027
6.16 Brazil Oil Field Specialty Chemicals Market Forecast 2017-2027
6.16.1 Brazil Oil Field Specialty Chemicals Markets Analysis 2017-2027
7. SWOT Analysis of the Global Specialty Oil Field Chemicals Market 2017-2027
8. Expert Opinion
8.1 Anonymous
8.2 Key Trends
8.3 Drivers & Restraints
8.4 Growth of the Market
9. Leading Companies in the Oil Field Specialty Chemicals Market 2015
9.1 BASF SE
9.2 The Dow Chemical Company
9.3 Solvay SA
9.4 Schlumberger Limited
9.5 Halliburton Company
9.6 Baker Hughes Incorporated
9.7 AkzoNobel NV
9.8 Kemira OYJ
9.9 Clariant
9.10 Albemarle Corporation
10. Conclusions
10.1 The Global Oil Field Specialty Chemicals Market Overview
10.2 Oil Field Specialty Chemicals Market Prospects By Type
10.3 Oil Field Specialty Chemicals Market Prospects By Applications
10.4 Leading National Oil Field Specialty Chemicals Markets Summary
11. Glossary
Associated Visiongain Reports
Visiongain Report Sales Order Form
Appendix A
About Visiongain
Appendix B
Visiongain report evaluation form
List of Tables
Table 1.1 Leading National & Regional Oil Field Specialty Chemicals Market Forecast by Submarket 2017-2027 (US$m, AGR %, Cumulative)
Table 3.1 Global Oil Field Specialty Chemicals Market Forecast 2017-2027 (US $bn, AGR %, CAGR %, Cumulative)
Table 3.2 Global Oil Field Specialty Chemicals Market Drivers & Restraints 2017
Table 4.1 Global Oil Field Specialty Chemicals Submarket Forecast 2017-2027 (US $bn, AGR %, Cumulative)
Table 4.2 Global Oil Field Specialty Chemicals Submarket Value Forecasts by Type 2017-2027 (AGR %)
Table 4.3 Corrosion Inhibitors Submarket by Type Value Forecast 2017-2027 ($bn, AGR %, CAGR %, Cumulative)
Table 4.4 Biocides Submarket Value Forecast 2017-2027 ($bn, AGR %, CAGR %, Cumulative)
Table 4.5 Demulsifiers Submarket Value Forecast 2017-2027 ($bn, AGR %, CAGR %, Cumulative)
Table 4.6 Pour-Point Depressants Submarket Value Forecast 2017-2027 ($bn, AGR %, CAGR %, Cumulative)
Table 4.7 Surfactants Submarket Value Forecast 2017-2027 ($bn, AGR %, CAGR %, Cumulative)
Table 4.8 Natural Polymers Submarket Value Forecast 2017-2027 ($bn, AGR %, CAGR %, Cumulative)
Table 4.9 Synthetic Polymers Submarket Value Forecast 2017-2027 ($bn, AGR %, CAGR %, Cumulative)
Table 4.10 Other Oil Field Chemicals Submarket Value Forecast 2017-2027 ($bn, AGR %, CAGR %, Cumulative)
Table 5.1 Global Oil Field Specialty Chemicals Submarket Forecast 2017-2027 (US $bn, AGR %, Cumulative)
Table 5.2 Global Oil Field Specialty Chemicals Submarket Value Forecasts by Application 2017-2027 (AGR %)
Table 5.3 Drilling Fluids Submarket Value Forecast 2017-2027 ($bn, AGR %, CAGR %, Cumulative)
Table 5.4 Well Stimulation Submarket Value Forecast 2017-2027 ($bn, AGR %, CAGR %, Cumulative)
Table 5.5 Production Chemicals Submarket Value Forecast 2017-2027 ($bn, AGR %, CAGR %, Cumulative)
Table 5.6 Cementing Submarket Value Forecast 2017-2027 ($bn, AGR %, CAGR %, Cumulative)
Table 5.7 Workover and Completion Submarket Value Forecast 2017-2027 ($bn, AGR %, CAGR %, Cumulative)
Table 5.8 Enhanced Oil Recovery Submarket Value Forecast 2017-2027 ($bn, AGR %, CAGR %, Cumulative)
Table 6.1 Leading National Oil Field Specialty Chemicals Market Value Forecasts 2017-2027 ($bn, AGR %, Cumulative)
Table 6.2 U.S. Oil Field Specialty Chemicals Market Forecast 2017-2027 ($bn, AGR %, CAGR %, Cumulative)
Table 6.3 U.S. Oil Field Specialty Chemicals Market Share Forecast 2017-2027 (%, Share)
Table 6.4 Canada Oil Field Specialty Chemicals Market Forecast 2017-2027 ($bn, AGR %, CAGR %, Cumulative)
Table 6.5 Canada Oil Field Specialty Chemicals Market Share Forecast 2017-2027 (%, Share)
Table 6.6 Mexico Oil Field Specialty Chemicals Market Forecast 2017-2027 ($bn, AGR %, CAGR %, Cumulative)
Table 6.7 Mexico Oil Field Specialty Chemicals Market Forecast 2017-2027 (%, Share)
Table 6.8 Russia Oil Field Specialty Chemicals Market Forecast 2017-2027 ($bn, AGR %, CAGR %, Cumulative)
Table 6.9 Russia Oil Field Specialty Chemicals Market Forecast 2017-2027 (%, Share)
Table 6.10 Norway Oil Field Specialty Chemicals Market Forecast 2017-2027 ($bn, AGR %, CAGR %, Cumulative)
Table 6.11 Norway Oil Field Specialty Chemicals Market Forecast 2017-2027 (% Share)
Table 6.12 U.K. Oil Field Specialty Chemicals Market Forecast 2017-2027 ($bn, AGR %, CAGR %, Cumulative)
Table 6.13 U.K Oil Field Specialty Chemicals Market Forecast 2017-2027 (% Share)
Table 6.14 China Oil Field Specialty Chemicals Market Forecast 2017-2027 ($bn, AGR %, CAGR %, Cumulative)
Table 6.15 China Oil Field Specialty Chemicals Market Forecast 2017-2027 (% Share)
Table 6.16 Indonesia Oil Field Specialty Chemicals Market Forecast 2017-2027 ($bn, AGR %, CAGR %, Cumulative)
Table 6.17 China Oil Field Specialty Chemicals Market Forecast 2017-2027 (% Share)
Table 6.18 Malaysia Oil Field Specialty Chemicals Market Forecast 2017-2027 ($bn, AGR %, CAGR %, Cumulative)
Table 6.19 Malaysia Oil Field Specialty Chemicals Market Forecast 2017-2027 (% Share)
Table 6.20 Saudi Arabia Oil Field Specialty Chemicals Market Forecast 2017-2027 ($bn, AGR %, CAGR %, Cumulative)
Table 6.21 Saudi Arabia Oil Field Specialty Chemicals Market Forecast 2017-2027 (% Share)
Table 6.22 Iran Oil Field Specialty Chemicals Market Forecast 2017-2027 ($bn, AGR %, CAGR %, Cumulative)
Table 6.23 Iran Oil Field Specialty Chemicals Market Forecast 2017-2027 (% Share)
Table 6.24 Iraq Oil Field Specialty Chemicals Market Forecast 2017-2027 ($bn, AGR %, CAGR %, Cumulative)
Table 6.25 Iraq Oil Field Specialty Chemicals Market Forecast 2017-2027 (% Share)
Table 6.26 UAE Oil Field Specialty Chemicals Market Forecast 2017-2027 ($bn, AGR %, CAGR %, Cumulative)
Table 6.27 UAE Oil Field Specialty Chemicals Market Forecast 2017-2027 (% Share)
Table 6.28 Nigeria Oil Field Specialty Chemicals Market Forecast 2017-2027 ($bn, AGR %, CAGR %, Cumulative)
Table 6.29 Nigeria Oil Field Specialty Chemicals Market Forecast 2017-2027 (% Share)
Table 6.30 Brazil Oil Field Specialty Chemicals Market Forecast 2017-2027 ($bn, AGR %, CAGR %, Cumulative)
Table 6.31 Brazil Oil Field Specialty Chemicals Market Forecast 2017-2027 (% Share)
Table 8.1 Global Polymers Market SWOT Analysis 2017-2027
Table 9.1 BASF SE Profile 2015 (CEO, Total Company Sales $bn, HQ, Founded, No. of Employees, Ticker, Website)
Table 9.2 BASF SE Annual Revenues 2011-2015 ($bn, AGR%)
Table 9.3 The Dow Chemical Company Profile 2015 (CEO, Total Company Sales $bn, HQ, Founded, No. of Employees, Ticker, Website)
Table 9.4 Arkema Annual Revenues 2011-2015 ($bn, AGR %)
Table 9.5 Solvay SA Profile 2015 (CEO, Total Company Sales $bn, HQ, Founded, No. of Employees, Ticker, Website)
Table 9.6 Solvay SA Annual Revenues 2011-2015 ($bn, AGR %)
Table 9.7 Schlumberger Limited Profile 2015 (CEO, Total Company Sales $bn, HQ, Founded, No. of Employees, Ticker, Website)
Table 9.8 Schlumberger Limited Annual Revenues 2011-2015 ($bn, AGR %)
Table 9.9 Halliburton Company Profile 2015 (CEO, Total Company Sales $bn, HQ, Founded, No. of Employees, Ticker, Website)
Table 9.10 Halliburton Annual Revenues 2011-2015 ($bn, AGR %)
Table 9.11 Baker Hughes Profile 2015 (CEO, Total Company Sales $bn, HQ, Founded, No. of Employees, Ticker, Website)
Table 9.12 Baker Hughes Incorporated Annual Revenues 2011-2015 ($bn, AGR %)
Table 9.13 AkzoNobel NV Profile 2015 (CEO, Total Company Sales $bn, HQ, Founded, No. of Employees, Ticker, Website)
Table 9.14 AkzoNobel Annual Revenues 2011-2015 ($bn, AGR %)
Table 9.15 Kemira OYJ Profile 2015 (CEO, Total Company Sales $bn, HQ, Founded, No. of Employees, Ticker, Website)
Table 9.16 Kemira Annual Revenues 2011-2015 ($bn, AGR %)
Table 9.17 Clariant Profile 2015 (CEO, Total Company Sales $bn, HQ, Founded, No. of Employees, Ticker, Website)
Table 9.18 Clariant Annual Revenues 2011-2015 ($bn, AGR %)
Table 9.19 Albemarle Corporation Profile 2015 (CEO, Total Company Sales $bn, HQ, Founded, No. of Employees, Ticker, Website)
Table 9.20 Albemarle Annual Revenues 2011-2015 ($bn, AGR %)
Table 10.1 Global Specialty Oil Field Chemicals Market Value Forecasts Summary 2017, 2022, 2027 ($bn, CAGR %)
Table 10.2 Global Oil Field Specialty Chemicals Submarket Value Forecasts by Type 2017, 2022, 2027 ($bn, CAGR %)
Table 10.3 Global Oil Field Specialty Chemicals Submarket Value Forecasts by Application 2017, 2022, 2027 ($bn, CAGR %)
Table 10.4 Global Leading Oil Field Specialty Chemicals Submarket Value Forecasts Summary 2017, 2022, 2027 ($bn, CAGR %)
List of Figures
Figure 2.1 Global Oil Field Specialty Chemicals Market Segmentation Overview
Figure 3.1 Global Growth in Oil Field Specialty Chemicals Market Value vs. Global GDP 2017-2027
Figure 3.2 Global Oil Field Specialty Chemicals Market Forecast 2017-2027 ($bn, AGR %)
Figure 4.1 Global Oil Field Specialty Chemicals Value Forecasts 2017-2027 ($bn)
Figure 4.2 Global Oil Field Specialty Chemicals Submarket Value Forecasts by Type 2017-2027 (AGR %)
Figure 4.3 Global Oil Field Specialty Chemicals Submarket Share Forecast 2017 (% of Total Market Value)
Figure 4.4 Global Oil Field Specialty Chemicals Submarket Share Forecast 2022 (% of Total Market Value)
Figure 4.5 Global Oil Field Specialty Chemicals Submarket Share Forecast 2027 (% of Total Market Value)
Figure 4.6 Corrosion Inhibitors Submarket Value Forecast 2017-2027 ($bn, AGR %)
Figure 4.7 Global Corrosion Inhibitors Submarket Cumulative Market Share Forecast 2017 (% of Total Value)
Figure 4.8 Global Corrosion Inhibitors Submarket Cumulative Market Share Forecast 2022 (% of Total Value)
Figure 4.9 Global Corrosion Inhibitors Submarket Cumulative Market Share Forecast 2027 (% of Total Value)
Figure 4.10 Biocides Submarket Value Forecast 2017-2027 ($bn, AGR %)
Figure 4.11 Global Biocides Submarket Cumulative Market Share Forecast 2017 (% of Total Value)
Figure 4.12 Global Biocides Submarket Cumulative Market Share Forecast 2022 (% of Total Value)
Figure 4.13 Global Biocides Submarket Cumulative Market Share Forecast 2027 (% of Total Value)
Figure 4.14 Demulsifiers Submarket Value Forecast 2017-2027 ($bn, AGR %)
Figure 4.15 Global Demulsifier Submarket Cumulative Market Share Forecast 2017 (% of Total Value)
Figure 4.16 Global Demulsifier Submarket Cumulative Market Share Forecast 2022 (% of Total Value)
Figure 4.17 Global Demulsifier Submarket Cumulative Market Share Forecast 2027 (% of Total Value)
Figure 4.18 Pour-Point Depressants Submarket Value Forecast 2017-2027 ($bn, AGR %)
Figure 4.19 Global Pour-Point Depressants Submarket Cumulative Market Share Forecast 2017 (% of Total Value)
Figure 4.20 Global Pour-Point Depressants Submarket Cumulative Market Share Forecast 2022 (% of Total Value)
Figure 4.21 Global Pour-Point Depressants Submarket Cumulative Market Share Forecast 2027 (% of Total Value)
Figure 4.22 Surfactants Submarket Value Forecast 2017-2027 ($bn, AGR %)
Figure 4.23 Global Surfactants Submarket Cumulative Market Share Forecast 2017 (% of Total Value)
Figure 4.24 Global Surfactants Submarket Cumulative Market Share Forecast 2022 (% of Total Value)
Figure 4.25 Global Surfactants Submarket Cumulative Market Share Forecast 2027 (% of Total Value)
Figure 4.26 Natural Polymers Submarket Value Forecast 2017-2027 ($bn, AGR %)
Figure 4.27 Global Natural Polymers Submarket Cumulative Market Share Forecast 2017 (% of Total Value)
Figure 4.28 Global Natural Polymers Submarket Cumulative Market Share Forecast 2022 (% of Total Value)
Figure 4.29 Global Natural Polymers Submarket Cumulative Market Share Forecast 2027 (% of Total Value)
Figure 4.30 Synthetic Polymers Submarket Value Forecast 2017-2027 ($bn, AGR %)
Figure 4.31 Global Synthetic Polymers Submarket Cumulative Market Share Forecast 2017 (% of Total Value)
Figure 4.32 Global Synthetic Polymers Submarket Cumulative Market Share Forecast 2022 (% of Total Value)
Figure 4.33 Global Synthetic Polymers Submarket Cumulative Market Share Forecast 2027 (% of Total Value)
Figure 4.34 Other Oil Field Chemicals Submarket Value Forecast 2017-2027 ($bn, AGR %)
Figure 4.35 Global Other Oil Field Chemicals Submarket Cumulative Market Share Forecast 2017 (% of Total Value)
Figure 4.36 Global Other Oil Field Chemicals Submarket Cumulative Market Share Forecast 2022 (% of Total Value)
Figure 4.37 Global Other Oil Field Chemicals Submarket Cumulative Market Share Forecast 2027 (% of Total Value)
Figure 5.1 Global Oil Field Specialty Chemicals Value Forecasts 2017-2027 ($bn)
Figure 5.2 Global Oil Field Specialty Chemicals Submarket Consumption Forecasts by Application 2017-2027 (AGR %)
Figure 5.3 Global Oil Field Specialty Chemicals Submarket Share Forecast 2017 (% of Total Market Value)
Figure 5.4 Global Oil Field Specialty Chemicals Submarket Share Forecast 2022 (% of Total Market Value)
Figure 5.5 Global Oil Field Specialty Chemicals Submarket Share Forecast 2027 (% of Total Market Value)
Figure 5.6 Drilling Fluids Submarket Value Forecast 2017-2027 ($bn, AGR %)
Figure 5.7 Global Drilling Fluids Submarket Cumulative Market Share Forecast 2017 (% of Total Value)
Figure 5.8 Global Drilling Fluids Submarket Cumulative Market Share Forecast 2022 (% of Total Value)
Figure 5.9 Global Drilling Fluids Submarket Cumulative Market Share Forecast 2027 (% of Total Value)
Figure 5.10 Well Stimulation Submarket Value Forecast 2017-2027 ($bn, AGR %)
Figure 5.11 Global Well Stimulation Submarket Cumulative Market Share Forecast 2017 (% of Total Value)
Figure 5.12 Global Well Stimulation Submarket Cumulative Market Share Forecast 2022 (% of Total Value)
Figure 5.13 Global Well Stimulation Submarket Cumulative Market Share Forecast 2027 (% of Total Value)
Figure 5.14 Production Chemicals Submarket Value Forecast 2017-2027 ($bn, AGR %)
Figure 5.15 Global Production Chemicals Submarket Cumulative Market Share Forecast 2017 (% of Total Value)
Figure 5.16 Global Production Chemicals Submarket Cumulative Market Share Forecast 2022 (% of Total Value)
Figure 5.17 Global Production Chemicals Submarket Cumulative Market Share Forecast 2027 (% of Total Value)
Figure 5.18 Cementing Submarket Value Forecast 2017-2027 ($bn, AGR %)
Figure 5.19 Global Cementing Submarket Cumulative Market Share Forecast 2017 (% of Total Value)
Figure 5.20 Global Cementing Submarket Cumulative Market Share Forecast 2022 (% of Total Value)
Figure 5.21 Global Cementing Submarket Cumulative Market Share Forecast 2027 (% of Total Value)
Figure 5.22 Workover and Completion Submarket Value Forecast 2017-2027 ($bn, AGR %)
Figure 5.23 Global Workover and Completion Submarket Cumulative Market Share Forecast 2017 (% of Total Value)
Figure 5.24 Global Workover and Completion Submarket Cumulative Market Share Forecast 2022 (% of Total Value)
Figure 5.25 Global Workover and Completion Submarket Cumulative Market Share Forecast 2027 (% of Total Value)
Figure 5.26 Enhanced Oil Recovery Submarket Value Forecast 2017-2027 ($bn, AGR %)
Figure 5.27 Global Enhanced Oil Recovery Submarket Cumulative Market Share Forecast 2017 (% of Total Value)
Figure 5.28 Global Enhanced Oil Recovery Submarket Cumulative Market Share Forecast 2022 (% of Total Value)
Figure 5.29 Global Enhanced Oil Recovery Submarket Cumulative Market Share Forecast 2027 (% of Total Value)
Figure 6.1 Leading National Oil Field Specialty Chemicals Market Value Forecast 2017-2027 ($bn)
Figure 6.2 Leading National Oil Field Specialty Chemicals Market Share Forecast 2017 (Market Value %)
Figure 6.3 Leading National Oil Field Specialty Chemicals Market Share Forecast 2022 (Market Value %)
Figure 6.4 Leading National Oil Field Specialty Chemicals Market Share Forecast 2027 (Market Value %)
Figure 6.5 U.S. Oil Filed Specialty Chemicals Market Forecast 2016-2026 ($bn, AGR %)
Figure 6.6 U.S. Oil Field Specialty Chemicals Market Share Forecast 2017, 2022, 2027 (% Share)
Figure 6.7 Canada Oil Field Specialty Chemicals Market Forecast 2017-2027 ($bn, AGR %)
Figure 6.8 Canada Oil Field Specialty Chemicals Market Share Forecast 2017, 2022, 2027 (% Share)
Figure 6.9 Mexico Oil Field Specialty Chemicals Market Forecast 2017-2027 ($bn, AGR %)
Figure 6.10 Mexico Oil Field Specialty Chemicals Market Share Forecast 2017, 2022, 2027 (% Share)
Figure 6.11 Russia Oil Field Specialty Chemicals Market Forecast 2017-2027 ($bn, AGR %)
Figure 6.12 Russia Oil Field Specialty Chemicals Market Share Forecast 2017, 2022, 2027 (% Share)
Figure 6.13 Norway Oil Field Specialty Chemicals Market Forecast 2017-2027 ($bn, AGR %)
Figure 6.14 Norway Oil Field Specialty Chemicals Market Share Forecast 2017, 2022, 2027 (% Share)
Figure 6.15 U.K. Oil Field Specialty Chemicals Market Forecast 2017-2027 ($bn, AGR %)
Figure 6.16 U.K. Oil Field Specialty Chemicals Market Share Forecast 2017, 2022, 2027 (% Share)
Figure 6.17 China Oil Field Specialty Chemicals Market Forecast 2017-2027 ($bn, AGR %)
Figure 6.18 China Oil Field Specialty Chemicals Market Share Forecast 2017, 2022, 2027 (% Share)
Figure 6.19 Indonesia Oil Field Specialty Chemicals Market Forecast 2017-2027 ($bn, AGR %)
Figure 6.20 Indonesia Oil Field Specialty Chemicals Market Share Forecast 2017, 2022, 2027 (% Share)
Figure 6.21 Malaysia Oil Field Specialty Chemicals Market Forecast 2017-2027 ($bn, AGR %)
Figure 6.22 Malaysia Oil Field Specialty Chemicals Market Share Forecast 2017, 2022, 2027 (% Share)
Figure 6.23 Saudi Arabia Oil Field Specialty Chemicals Market Forecast 2017-2027 ($bn, AGR %)
Figure 6.24 Saudi Arabia Oil Field Specialty Chemicals Market Share Forecast 2017, 2022, 2027 (% Share)
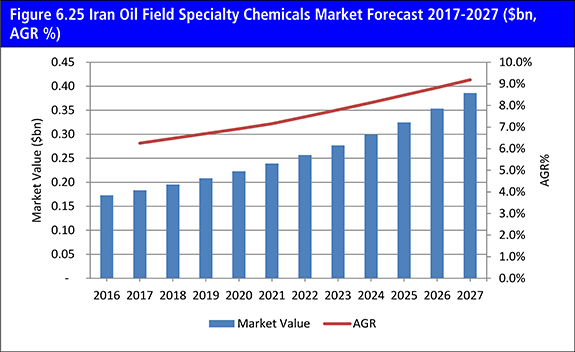
Figure 6.25 Iran Oil Field Specialty Chemicals Market Forecast 2017-2027 ($bn, AGR %)
Figure 6.26 Iran Oil Field Specialty Chemicals Market Share Forecast 2017, 2022, 2027 (% Share)
Figure 6.27 Iraq Oil Field Specialty Chemicals Market Forecast 2017-2027 ($bn, AGR %)
Figure 6.28 Iraq Oil Field Specialty Chemicals Market Share Forecast 2017, 2022, 2027 (% Share)
Figure 6.29 UAE Oil Field Specialty Chemicals Market Forecast 2017-2027 ($bn, AGR %)
Figure 6.30 UAE Oil Field Specialty Chemicals Market Share Forecast 2017, 2022, 2027 (% Share)
Figure 6.31 Nigeria Oil Field Specialty Chemicals Market Forecast 2017-2027 ($bn, AGR %)
Figure 6.32 Nigeria Oil Field Specialty Chemicals Market Share Forecast 2017, 2022, 2027 (% Share)
Figure 6.33 Brazil Oil Field Specialty Chemicals Market Forecast 2017-2027 ($bn, AGR %)
Figure 6.34 Brazil Oil Field Specialty Chemicals Market Share Forecast 2017, 2022, 2027 (% Share)
Figure 9.1 BASF SE Revenue by Business Segment 2015 (% Share)
Figure 9.2 BASF SE Revenue by Region 2015 (% Share)
Figure 9.3 BASF SE Annual Revenue by 2011-2015 ($bn, AGR %)
Figure 9.4 The Dow Chemical Company Revenue by Business Segment 2015 (% Share)
Figure 9.5 The Dow Chemical Company Revenue by Region 2015 (% Share)
Figure 9.6 The Dow Chemical Company Annual Revenue by 2011-2015 ($bn, AGR %)
Figure 9.7 Solvay SA Revenue by Business Segment 2015 (% Share)
Figure 9.8 Solvay SA Revenue by Region 2015 (% Share)
Figure 9.9 Solvay SA Annual Revenue by 2011-2015 ($bn, AGR %)
Figure 9.10 Schlumberger Limited Revenue by Business Segment 2015 (% Share)
Figure 9.11 Schlumberger Limited Revenue by Region 2015 (% Share)
Figure 9.12 Schlumberger Limited Annual Revenue by 2011-2015 ($bn, AGR %)
Figure 9.13 Halliburton Company Revenue by Business Segment 2015 (% Share)
Figure 9.14 Halliburton Revenue by Region 2015 (% Share)
Figure 9.15 Halliburton Annual Revenue by 2011-2015 ($bn, AGR %)
Figure 9.16 Baker Hughes Limited Revenue by Region 2015 (% Share)
Figure 9.17 Baker Hughes Annual Revenue by 2011-2015 ($bn, AGR %)
Figure 9.18 AkzoNobel Revenue by Business Segment 2015 (% Share)
Figure 9.19 AkzoNobel Revenue by Region 2015 (% Share)
Figure 9.20 AkzoNobel Annual Revenue by 2011-2015 ($bn, AGR %)
Figure 9.21 Kemira OYJ Revenue by Business Segment 2015 (% Share)
Figure 9.22 Kemira OYJ Revenue by Region 2015 (% Share)
Figure 9.23 Kemira Annual Revenue by 2011-2015 ($bn, AGR %)
Figure 9.24 Clariant Revenue by Business Segment 2015 (% Share)
Figure 9.25 Clariant Revenue by Region 2015 (% Share)
Figure 9.26 Clariant Annual Revenue by 2011-2015 ($bn, AGR %)
Figure 9.27 Albemarle Revenue by Business Segment 2015 (% Share)
Figure 9.28 Albemarle Annual Revenue by 2011-2015 ($bn, AGR %)


