Industries > Pharma > Nanotechnology in Drug Delivery Market Report 2022-2032

Nanotechnology in Drug Delivery Market Report 2022-2032
Forecasts by Technology (Nanocrystals, Nanoparticles, Liposomes, Micelles, Nanotubes), by Application (Neurology, Oncology, Cardiovascular/ Physiology, Anti-inflammatory/Immunology, Anti-infective, Other), by Nanoparticles (Dendrimers, Gold Nanoparticles, Fullerenes, Other) AND Regional and Leading National Market Analysis PLUS Analysis of Leading Companies AND COVID-19 Recovery Scenarios
The Nanotechnology in Drug Delivery Market Report 2022-2032: This report will prove invaluable to leading firms striving for new revenue pockets if they wish to better understand the industry and its underlying dynamics. It will be useful for companies that would like to expand into different industries or to expand their existing operations in a new region.
Nanoparticles are Gaining Tractions in the Global Market for Drug Deliveries
Nanomedicine is a relatively recent field in which nanotechnology knowledge & technology are used for disease prevention and treatment. It comprises the diagnostic, transport, and sensing functions of nanostructured materials including nano robots, nano sensors, and also the activation of nanomaterials in living cells. For example, a nanomaterials cancer diagnostic approach has been developed that incorporates both medicine and imaging modalities. Lipid systems such like lipid nanoparticles and micelles, which are both now FDA-approved, were used in the first generation of nanoparticle-based treatment. These liposomes and micelles include inorganic nanomaterials such like gold or magnetic nanoparticles. Due to these characteristics, inorganic nanoparticles are increasingly being used for delivery of drug, imaging, and therapeutic applications.
What Questions Should You Ask before Buying a Market Research Report?
• How is the nanotechnology in drug delivery market evolving?
• What is driving and restraining the nanotechnology in drug delivery market?
• How will each nanotechnology in drug delivery submarket segment grow over the forecast period and how much revenue will these submarkets account for in 2032?
• How will the market shares for each nanotechnology in drug delivery submarket develop from 2022 to 2032?
• What will be the main drivers for the overall market from 2022 to 2032?
• Will leading nanotechnology in drug delivery markets broadly follow the macroeconomic dynamics, or will individual national markets outperform others?
• How will the market shares of the national markets change by 2032 and which geographical region will lead the market in 2032?
• Who are the leading players and what are their prospects over the forecast period?
• What are the nanotechnology in drug delivery projects for these leading companies?
• How will the industry evolve during the period between 2020 and 2032? What are the implication of nanotechnology in drug delivery projects taking place now and over the next 10 years?
• Is there a greater need for product commercialisation to further scale the nanotechnology in drug delivery market?
• Where is the nanotechnology in drug delivery market heading? And how can you ensure you are at the forefront of the market?
• What can be the best investment options for new product and service lines?
• What are the key prospects for moving companies into a new growth path and C-suite?
You need to discover how this will impact the nanotechnology in drug delivery market today, and over the next 10 years:
• Our 470+ page report provides 320 tables and 304 charts/graphs exclusively to you.
• The report highlights key lucrative areas in the industry so you can target them – NOW.
• Contains in-depth analyse of global, regional and national sales and growth
• Highlights for you the key successful trends, changes and revenue projections made by your competitors
This report tells you TODAY how the nanotechnology in drug delivery market will develop in the next 10 years, and in-line with the variations in COVID-19 economic recession and bounce. This market is more critical now than at any point over the last 10 years.
Forecasts to 2032 and other analyses reveal the commercial prospects
• In addition to revenue forecasting to 2032, our new study provides you with recent results, growth rates, and market shares.
• You find original analyses, with business outlooks and developments.
• Discover qualitative analyses (including market dynamics, drivers, opportunities, restraints and challenges), cost structure, impact of rising nanotechnology in drug delivery prices and recent developments.
This report includes data analysis and invaluable insight into how COVID-19 will affect the industry and your company. Four COVID-19 recovery patterns and their impact, namely, “V”, “L”, “W” and “U” are discussed in this report.
Segments Covered in this report
Technology
• Nanocrystals
• Nanoparticles
• Liposomes
• Micelles
• Nanotubes
Application
• Neurology
• Oncology
• Cardiovascular/ Physiology
• Anti-inflammatory/ Immunology
• Anti-infective
• Other Application
Nanoparticles
• Dendrimers
• Gold Nanoparticles
• Fullerenes
• Other Nanoparticles

In addition to the revenue predictions for the overall world market and segments, you will also find revenue forecasts for 4 regional and 20 leading national markets:
North America
• U.S.
• Canada
• Mexico
Europe
• Germany
• Spain
• United Kingdom
• France
• Italy
• Rest of Europe
Asia Pacific
• China
• Japan
• India
• Australia
• South Korea
• Rest of Asia Pacific
LAMEA
• Brazil
• Turkey
• Saudi Arabia
• South Africa
• UAE
• Rest of Latin America, Middle East and Africa
Need industry data? Please contact us today.
The report also includes profiles and for some of the leading companies in the Nanotechnology in Drug Delivery Market, 2022 to 2032, with a focus on this segment of these companies’ operations.
Leading companies and the potential for market growth
• AbbVie Inc. (AbbVie)
• Amgen Inc.
• Aquanova AG
• Bayer AG
• Camarus AB
• Celgene Corporation
• Cytimmune Sciences
• GlaxoSmithKline PLC
• Johnson & Johnson
• Merck & Co., Inc.
• Nanobiotix
• NanoCarrier Co, Ltd
• NanOlogy LLC
• Novartis AG
• Pfizer Inc. (Pfizer)
• Roche Holding AG (Roche)
• Sanofi SA
• Selecta Biosciences Inc.
• Starpharma Holdings Limited
• Taiwan Liposome Co.
• Tarveda Therapeutics
Overall world revenue for Nanotechnology in Drug Delivery Market, 2022 to 2032 in terms of value the market will surpass US$59.5 billion in 2022, our work calculates. We predict strong revenue growth through to 2032. Our work identifies which organizations hold the greatest potential. Discover their capabilities, progress, and commercial prospects, helping you stay ahead.
How the Nanotechnology in Drug Delivery Market, 2022 to 2032 Market report helps you?
In summary, our 472-page report provides you with the following knowledge:
• Revenue forecasts to 2032 for Nanotechnology in Drug Delivery Market, 2022 to 2032 Market, with forecasts for technology, application, nanoparticles each forecasted at a global and regional level– discover the industry’s prospects, finding the most lucrative places for investments and revenues
• Revenue forecasts to 2032 for 4 regional and 20 key national markets – See forecasts for the Nanotechnology in Drug Delivery Market, 2022 to 2032 market in North America, Europe, Asia-Pacific and LAMEA. Also forecasted is the market in the US, Canada, Mexico, Brazil, Germany, France, UK, Italy, China, India, Japan, and Australia among other prominent economies.
• Prospects for established firms and those seeking to enter the market– including company profiles for 21 of the major companies involved in the Nanotechnology in Drug Delivery Market, 2022 to 2032 Market.
Find quantitative and qualitative analyses with independent predictions. Receive information that only our report contains, staying informed with this invaluable business intelligence.
Information found nowhere else
With our newly report title, you are less likely to fall behind in knowledge or miss out on opportunities. See how our work could benefit your research, analyses, and decisions. Visiongain’s study is for everybody needing commercial analyses for the Nanotechnology in Drug Delivery Market, 2022 to 2032 Market and leading companies. You will find data, trends and predictions.
To access the data contained in this document please email contactus@visiongain.com
Buy our report today Nanotechnology in Drug Delivery Market Report 2022-2032: Forecasts by Technology (Nanocrystals, Nanoparticles, Liposomes, Micelles, Nanotubes), by Application (Neurology, Oncology, Cardiovascular/ Physiology, Anti-inflammatory/Immunology, Anti-infective, Other), by Nanoparticles (Dendrimers, Gold Nanoparticles, Fullerenes, Other) AND Regional and Leading National Market Analysis PLUS Analysis of Leading Companies AND COVID-19 Recovery Scenarios. Avoid missing out by staying informed – order our report now.
Visiongain is a trading partner with the US Federal Government
CCR Ref number: KD4R6
Do you have any custom requirements we can help you with? Any need for a specific country, geo region, market segment or specific company information? Contact us today, we can discuss your needs and see how we can help: contactus@visiongain.com
1.1 Introduction to Nanotechnology in Drug Delivery Market
1.2 Global Nanotechnology in Drug Delivery Market Overview
1.3 What Are the Objectives of this Report?
1.4 What is the Scope of the Report?
1.5 Nanotechnology in Drug Delivery Market Definition
1.6 Why You Should Read this Report
1.7 What this Report Delivers
1.8 Key Questions Answered by this Analytical Report Include:
1.9 Who is this Report for?
1.10 Research Methodology
1.10.1 Primary Research
1.10.2 Secondary Research
1.10.3 Market Evaluation & Forecasting Methodology
1.11 Frequently Asked Questions (FAQs)
1.12 Associated Visiongain Reports
1.13 About Visiongain
2 Executive Summary
3 Global Market Dynamics
3.1 Market Driving Factors
3.1.1 Increased Use of Inorganic Nanoparticles with a Focus on Medication Delivery
3.1.2 Drug Delivery Using Nanotechnology
3.1.3 Increasing Development of Nanotechnology and Nanomaterials
3.1.4 Advancements in Nanoscale Technologies
3.1.5 Growing Preference for Personalized Medicines
3.2 Market Restraining Factors
3.2.1 Large-Scale Production is a Problem in Nanomaterials R&D for Medication Delivery
3.2.2 New Regulatory Control Challenges
3.2.3 Safety Issues for Nanotechnology
3.2.4 Certain Restrictions of Using Nanoparticles with X-Ray
3.3 Opportunities in the Global Market
3.3.1 Nanotechnology is Important in the Development of Drug Delivery Technologies
3.3.2 Nanoscale Has a Number of Advantages
3.3.3 Nanotechnology is Undergoing in a Great Deal of Research and Development
3.4 Challenges in the Global Market
3.4.1 Complication of Nanotechnology Delivery Services
3.4.2 Formulation Scientists Face a Hurdle When it Comes to Drug Distribution to Ocular Tissues
3.4.3 Low Bioavailability is a Problem with Most Medication Delivery Technologies
3.5 SWOT Analysis
3.6 PEST Analysis
3.7 Porter’s Five Forces Analysis
3.7.1 Competitive Rivalry
3.7.2 Bargaining Power of Suppliers
3.7.3 Bargaining Power of Customers
3.7.4 Threat of New Entrants
3.7.5 Threat of Substitutes
4 Global Nanotechnology in Drug Delivery Market Analysis
4.1 Global Market Outlook
4.2 Global Market Size Estimation and Forecast
4.2.1 Pre-COVID-19 Market Scenario
4.2.2 Post-COVID-19 Market Scenarios (V, W, U, L-Shaped Recovery Analysis)
5 Global Nanotechnology in Drug Delivery Market Analysis by Region
5.1 North America
5.2 Europe
5.3 Asia-Pacific
5.4 LAMEA
5.5 Regional Market Size Estimation and Forecast
5.5.1 Pre-COVID-19 Market Scenario
5.5.2 Post-COVID-19 Market Scenarios (V, W, U, L-Shaped Recovery Analysis)
6 Global Market Size Estimation and Forecast by Technology
6.1 Nanocrystals
6.2 Nanoparticles
6.3 Liposomes
6.4 Micelles
6.5 Nanotubes
6.6 Pre-COVID-19 Market Scenario
6.7 Post-COVID-19 Market Scenarios (V, W, U, L-Shaped Recovery Analysis)
7 Global Market Size Estimation and Forecast by Application
7.1 Neurology
7.2 Oncology
7.3 Cardiovascular/ Physiology
7.4 Anti-inflammatory/ Immunology
7.5 Others
7.5.1 Nanotechnology Application in Hematology
7.5.2 Nanotechnology Application in Ophthalmology
7.6 Pre-COVID-19 Market Scenario
7.7 Post-COVID-19 Market Scenarios (V, W, U, L-Shaped Recovery Analysis)
8 Global Market Size Estimation and Forecast by Nanoparticle
8.1 Dendrimers
8.2 Gold Nanoparticles
8.3 Fullerenes
8.4 Other Nanoparticles
8.5 Pre-COVID-19 Market Scenario
8.6 Post-COVID-19 Market Scenarios (V, W, U, L-Shaped Recovery Analysis)
9 North America Market Size Estimation and Forecast
9.1 Market Outlook
9.2 North America Market Size Estimation and Forecast
9.2.1 Pre-COVID-19 Market Scenario
9.2.2 Post-COVID-19 Market Scenarios (V, W, U, L-Shaped Recovery Analysis)
9.3 Country Market Size Estimation and Forecast
9.3.1 Pre-COVID-19 Market Scenario
9.3.2 Post-COVID-19 Market Scenarios (V, W, U, L-Shaped Recovery Analysis)
9.4 North America Market Size Estimation and Forecast Technology
9.4.1 Pre-COVID-19 Market Scenario
9.4.2 Post-COVID-19 Market Scenarios (V, W, U, L-Shaped Recovery Analysis)
9.5 North America Market Size Estimation and Forecast Application
9.5.1 Pre-COVID-19 Market Scenario
9.5.2 Post-COVID-19 Market Scenarios (V, W, U, L-Shaped Recovery Analysis)
9.6 North America Market Size Estimation and Forecast Nanoparticle
9.6.1 Pre-COVID-19 Market Scenario
9.6.2 Post-COVID-19 Market Scenarios (V, W, U, L-Shaped Recovery Analysis)
9.7 U.S. Nanotechnology in Drug Delivery Market Analysis
9.7.1 Nanotechnology Advances in the United States
9.7.2 Pre-COVID-19 Market Scenario
9.7.3 Post-COVID-19 Market Scenarios (V, W, U, L-Shaped Recovery Analysis)
9.8 Canada Nanotechnology in Drug Delivery Market Analysis
9.8.1 Increasing Demand of Nanotechnology in Canada
9.8.2 Pre-COVID-19 Market Scenario
9.8.3 Post-COVID-19 Market Scenarios (V, W, U, L-Shaped Recovery Analysis)
9.9 Mexico Nanotechnology in Drug Delivery Market Analysis
9.9.1 Development of Nanoscience and Nanotechnologies (NCT) in Mexico
9.9.2 Pre-COVID-19 Market Scenario
9.9.3 Post-COVID-19 Market Scenarios (V, W, U, L-Shaped Recovery Analysis)
10 Europe Market Size Estimation and Forecast
10.1 Market Outlook
10.2 Europe Market Size Estimation and Forecast
10.2.1 Pre-COVID-19 Market Scenario
10.2.2 Post-COVID-19 Market Scenarios (V, W, U, L-Shaped Recovery Analysis)
10.3 Country Market Size Estimation and Forecast
10.3.1 Pre-COVID-19 Market Scenario
10.3.2 Post-COVID-19 Market Scenarios (V, W, U, L-Shaped Recovery Analysis)
10.4 Europe Market Size Estimation and Forecast Technology
10.4.1 Pre-COVID-19 Market Scenario
10.4.2 Post-COVID-19 Market Scenarios (V, W, U, L-Shaped Recovery Analysis)
10.5 Europe Market Size Estimation and Forecast Application
10.5.1 Pre-COVID-19 Market Scenario
10.5.2 Post-COVID-19 Market Scenarios (V, W, U, L-Shaped Recovery Analysis)
10.6 Europe Market Size Estimation and Forecast Nanoparticle
10.6.1 Pre-COVID-19 Market Scenario
10.6.2 Post-COVID-19 Market Scenarios (V, W, U, L-Shaped Recovery Analysis)
10.7 Germany Nanotechnology in Drug Delivery Market Analysis
10.7.1 Nanotechnology is One of the Most Innovative Technology Industries in Germany
10.7.2 Pre-COVID-19 Market Scenario
10.7.3 Post-COVID-19 Market Scenarios (V, W, U, L-Shaped Recovery Analysis)
10.8 UK Nanotechnology in Drug Delivery Market Analysis
10.8.1 In UK There is Significant Investments in Nanotechnology
10.8.2 Pre-COVID-19 Market Scenario
10.8.3 Post-COVID-19 Market Scenarios (V, W, U, L-Shaped Recovery Analysis)
10.9 France Nanotechnology in Drug Delivery Market Analysis
10.9.1 In Order to Improve Drug Safety, a Nanomedicine Company Has been Established in France.
10.9.2 Pre-COVID-19 Market Scenario
10.9.3 Post-COVID-19 Market Scenarios (V, W, U, L-Shaped Recovery Analysis)
10.10 Italy Nanotechnology in Drug Delivery Market Analysis
10.10.1 Nanotechnology Drug Research and Development Companies in Italy
10.10.2 Pre-COVID-19 Market Scenario
10.10.3 Post-COVID-19 Market Scenarios (V, W, U, L-Shaped Recovery Analysis)
10.11 Spain Nanotechnology in Drug Delivery Market Analysis
10.11.1 Nanomedicine and Drug Delivery Technologies Are Crucial in Modern Medicine in Spain
10.11.2 Pre-COVID-19 Market Scenario
10.11.3 Post-COVID-19 Market Scenarios (V, W, U, L-Shaped Recovery Analysis)
10.12 Rest of Europe Nanotechnology in Drug Delivery Market Analysis
10.12.1 Pre-COVID-19 Market Scenario
10.12.2 Post-COVID-19 Market Scenarios (V, W, U, L-Shaped Recovery Analysis)
11 Asia-Pacific Market Size Estimation and Forecast
11.1 Market Outlook
11.2 Asia-Pacific Market Size Estimation and Forecast
11.2.1 Pre-COVID-19 Market Scenario
11.2.2 Post-COVID-19 Market Scenarios (V, W, U, L-Shaped Recovery Analysis)
11.3 Country Market Size Estimation and Forecast
11.3.1 Pre-COVID-19 Market Scenario
11.3.2 Post-COVID-19 Market Scenarios (V, W, U, L-Shaped Recovery Analysis)
11.4 Asia-Pacific Market Size Estimation and Forecast Technology
11.4.1 Pre-COVID-19 Market Scenario
11.4.2 Post-COVID-19 Market Scenarios (V, W, U, L-Shaped Recovery Analysis)
11.5 Asia-Pacific Market Size Estimation and Forecast Application
11.5.1 Pre-COVID-19 Market Scenario
11.5.2 Post-COVID-19 Market Scenarios (V, W, U, L-Shaped Recovery Analysis)
11.6 Asia-Pacific Market Size Estimation and Forecast Nanoparticle
11.6.1 Pre-COVID-19 Market Scenario
11.6.2 Post-COVID-19 Market Scenarios (V, W, U, L-Shaped Recovery Analysis)
11.7 China Nanotechnology in Drug Delivery Market Analysis
11.7.1 China's Nanotechnology Sector Continues to Expand at a Rapid Pace
11.7.2 Pre-COVID-19 Market Scenario
11.7.3 Post-COVID-19 Market Scenarios (V, W, U, L-Shaped Recovery Analysis)
11.8 India Nanotechnology in Drug Delivery Market Analysis
11.8.1 In India, Biopharmaceutical Companies Enabled Nanotechnology Drug Delivery
11.8.2 Pre-COVID-19 Market Scenario
11.8.3 Post-COVID-19 Market Scenarios (V, W, U, L-Shaped Recovery Analysis)
11.9 Japan Nanotechnology in Drug Delivery Market Analysis
11.9.1 Drug Delivery Systems (DDS) for Drugs Such as Anti-Cancer Therapeutics and Nucleic Acids Were Developed in Japan.
11.9.2 Pre-COVID-19 Market Scenario
11.9.3 Post-COVID-19 Market Scenarios (V, W, U, L-Shaped Recovery Analysis)
11.10 South Korea Nanotechnology in Drug Delivery Market Analysis
11.10.1 South Korean Pharmaceutical Companies Are Hesitant to Invest More in Drug Discovery and Delivery Systems Based on Natural Products
11.10.2 Pre-COVID-19 Market Scenario
11.10.3 Post-COVID-19 Market Scenarios (V, W, U, L-Shaped Recovery Analysis)
11.11 Australia Nanotechnology in Drug Delivery Market Analysis
11.11.1 Australia is a Leader in Nanotechnology Research and Development
11.11.2 Pre-COVID-19 Market Scenario
11.11.3 Post-COVID-19 Market Scenarios (V, W, U, L-Shaped Recovery Analysis)
11.12 Rest of Asia-Pacific Nanotechnology in Drug Delivery Market Analysis
11.12.1 Pre-COVID-19 Market Scenario
11.12.2 Post-COVID-19 Market Scenarios (V, W, U, L-Shaped Recovery Analysis)
12 LAMEA Market Size Estimation and Forecast
12.1 Market Outlook
12.2 LAMEA Market Size Estimation and Forecast
12.2.1 Pre-COVID-19 Market Scenario
12.2.2 Post-COVID-19 Market Scenarios (V, W, U, L-Shaped Recovery Analysis)
12.3 Country Market Size Estimation and Forecast
12.3.1 Pre-COVID-19 Market Scenario
12.3.2 Post-COVID-19 Market Scenarios (V, W, U, L-Shaped Recovery Analysis)
12.4 LAMEA Market Size Estimation and Forecast Technology
12.4.1 Pre-COVID-19 Market Scenario
12.4.2 Post-COVID-19 Market Scenarios (V, W, U, L-Shaped Recovery Analysis)
12.5 LAMEA Market Size Estimation and Forecast Application
12.5.1 Pre-COVID-19 Market Scenario
12.5.2 Post-COVID-19 Market Scenarios (V, W, U, L-Shaped Recovery Analysis)
12.6 LAMEA Market Size Estimation and Forecast Nanoparticle
12.6.1 Pre-COVID-19 Market Scenario
12.6.2 Post-COVID-19 Market Scenarios (V, W, U, L-Shaped Recovery Analysis)
12.7 Brazil Nanotechnology in Drug Delivery Market Analysis
12.7.1 Nanotechnology Sector is Innovating and Developing Applications in Biotech, Medicine, and Pharmaceuticals
12.7.2 Pre-COVID-19 Market Scenario
12.7.3 Post-COVID-19 Market Scenarios (V, W, U, L-Shaped Recovery Analysis)
12.8 South Africa Nanotechnology in Drug Delivery Market Analysis
12.8.1 South Africa is Experimenting with Nanotechnology to Improve Tuberculosis Treatments
12.8.2 Pre-COVID-19 Market Scenario
12.8.3 Post-COVID-19 Market Scenarios (V, W, U, L-Shaped Recovery Analysis)
12.9 South Arabia Nanotechnology in Drug Delivery Market Analysis
12.9.1 Nanotechnology is Essential in Medical and Pharmaceutical Delivery in Saudi Arabia
12.9.2 Pre-COVID-19 Market Scenario
12.9.3 Post-COVID-19 Market Scenarios (V, W, U, L-Shaped Recovery Analysis)
12.10 Turkey Nanotechnology in Drug Delivery Market Analysis
12.10.1 Nanomaterials and Nano-Drug Delivery Systems in Human and Veterinary Medicine Are Emerging Technologies in Turkey
12.10.2 Pre-COVID-19 Market Scenario
12.10.3 Post-COVID-19 Market Scenarios (V, W, U, L-Shaped Recovery Analysis)
12.11 UAE Nanotechnology in Drug Delivery Market Analysis
12.11.1 Research & Development of Nanotechnology in UAE
12.11.2 Pre-COVID-19 Market Scenario
12.11.3 Post-COVID-19 Market Scenarios (V, W, U, L-Shaped Recovery Analysis)
12.12 Rest of LAMEA Nanotechnology in Drug Delivery Market Analysis
12.12.1 Pre-COVID-19 Market Scenario
12.12.2 Post-COVID-19 Market Scenarios (V, W, U, L-Shaped Recovery Analysis)
13 Company Profiles
13.1 Merck & Co., Inc.
13.1.1 Company Snapshot
13.1.2 Company Overview
13.1.3 Company Financial Profile
13.1.4 Company Product Benchmarking
13.1.5 Company Recent Developments
13.2 Bayer AG
13.2.1 Company Snapshot
13.2.2 Company Overview
13.2.3 Company Financial Profile
13.2.4 Company Product Benchmarking
13.2.5 Company Recent Developments
13.3 Amgen, Inc
13.3.1 Company Snapshot
13.3.2 Company Overview
13.3.3 Company Financial Profile
13.3.4 Company Product Benchmarking
13.3.5 Company Recent Developments
13.4 Pfizer Inc.
13.4.1 Company Snapshot
13.4.2 Company Overview
13.4.3 Company Financial Profile
13.4.4 Company Product Benchmarking
13.4.5 Company Recent Developments
13.5 Novartis AG
13.5.1 Company Snapshot
13.5.2 Company Overview
13.5.3 Company Financial Profile
13.5.4 Company Product Benchmarking
13.5.5 Company Recent Developments
13.6 AbbVie Inc.
13.6.1 Company Snapshot
13.6.2 Company Overview
13.6.3 Company Financial Profile
13.6.4 Company Product Benchmarking
13.6.5 Company Recent Developments
13.7 Roche Holding AG
13.7.1 Company Snapshot
13.7.2 Company Overview
13.7.3 Company Financial Profile
13.7.4 Company Product Benchmarking
13.7.5 Company Recent Developments
13.8 Johnson & Johnson
13.8.1 Company Snapshot
13.8.2 Company Overview
13.8.3 Company Financial Profile
13.8.4 Company Product Benchmarking
13.8.5 Company Recent Developments
13.9 Glaxo SmithKline plc.
13.9.1 Company Snapshot
13.9.2 Company Overview
13.9.3 Company Financial Profile
13.9.4 Company Product Benchmarking
13.9.5 Company Recent Developments
13.10 Sanofi SA
13.10.1 Company Snapshot
13.10.2 Company Overview
13.10.3 Company Financial Profile
13.10.4 Company Product Benchmarking
13.10.5 Company Recent Developments
13.11 Celgene Inc (A Bristol-Myers Squibb Company)
13.11.1 Company Snapshot
13.11.2 Company Overview
13.11.3 Product Benchmarking
13.11.4 Strategic Outlook
13.12 Aquanova AG
13.12.1 Company Snapshot
13.12.2 Company Overview
13.12.3 Product Benchmarking
13.13 Cytimmune Sciences, Inc.
13.13.1 Company Snapshot
13.13.2 Company Overview
13.13.3 Product Benchmarking
13.13.4 Strategic Outlook
13.14 Nanobiotix
13.14.1 Company Snapshot
13.14.2 Company Overview
13.14.3 Product Benchmarking
13.14.4 Strategic Outlook
13.15 NanoCarrier Co, Ltd
13.15.1 Company Snapshot
13.15.2 Company Overview
13.15.3 Product Benchmarking
13.15.4 Strategic Outlook
13.16 NanOlogy LLC
13.16.1 Company Snapshot
13.16.2 Company Overview
13.16.3 Product Benchmarking
13.16.4 Strategic Outlook
13.17 Taiwan Liposome Co.
13.17.1 Company Snapshot
13.17.2 Company Overview
13.17.3 Product Benchmarking
13.17.4 Strategic Outlook
13.18 Tarveda Therapeutics
13.18.1 Company Snapshot
13.18.2 Company Overview
13.18.3 Product Benchmarking
13.18.4 Strategic Outlook
13.19 Camarus AB
13.19.1 Company Snapshot
13.19.2 Company Overview
13.19.3 Product Benchmarking
13.19.4 Strategic Outlook
13.20 Selecta Biosciences
13.20.1 Company Snapshot
13.20.2 Company Overview
13.20.3 Financial Analysis
13.20.4 Product Benchmarking
13.20.5 Strategic Outlook
13.21 Starpharma Holdings Limited
13.21.1 Company Snapshot
13.21.2 Company Overview
13.21.3 Financial Analysis
13.21.4 Product Benchmarking
13.21.5 Strategic Outlook
14 Conclusion and Recommendations
14.1 Concluding Remarks
14.2 Recommendations for Market Players
List of Figure
Figure 1 Global Nanotechnology in Drug Delivery Market Forecast, 2022-2032 (USD Bn, AGR (%))
Figure 2 Global Nanotechnology in Drug Delivery Market Segmentation
Figure 3 Global Nanotechnology in Drug Delivery Market Forecast, 2022-2032 (USD Bn, AGR (%))
Figure 4 Global Nanotechnology in Drug Delivery Market Forecast, 2022-2032 (USD Bn, AGR (%)) (V-Shaped Recovery Scenario)
Figure 5 Global Nanotechnology in Drug Delivery Market Forecast, 2022-2032 (USD Bn, AGR (%)) (W-Shaped Recovery Scenario)
Figure 6 Global Nanotechnology in Drug Delivery Market Forecast, 2022-2032 (USD Bn, AGR (%)) (U-Shaped Recovery Scenario)
Figure 7 Global Nanotechnology in Drug Delivery Market Forecast, 2022-2032 (USD Bn, AGR (%)) (L-Shaped Recovery Scenario)
Figure 8 Global Nanotechnology in Drug Delivery Market Share Forecast by Region 2022, 2027, 2032 (%)
Figure 9 Global Nanotechnology in Drug Delivery Market by Region, 2022-2032 (USD Bn, AGR (%))
Figure 10 Global Nanotechnology in Drug Delivery Market by Region, 2022-2032 (USD Bn, AGR (%)) (V-Shaped Recovery Scenario)
Figure 11 Global Nanotechnology in Drug Delivery Market by Region, 2022-2032 (USD Bn, AGR (%)) (W-Shaped Recovery Scenario)
Figure 12 Global Nanotechnology in Drug Delivery Market by Region, 2022-2032 (USD Bn, AGR (%)) (U-Shaped Recovery Scenario)
Figure 13 Global Nanotechnology in Drug Delivery Market by Region, 2022-2032 (USD Bn, AGR (%)) (L-Shaped Recovery Scenario)
Figure 14 Global Nanotechnology in Drug Delivery Market Share Forecast by Technology 2022, 2027, 2032 (%)
Figure 15 Global Nanotechnology in Drug Delivery Market by Technology, 2022-2032 (USD Bn, AGR (%))
Figure 16 Global Nanotechnology in Drug Delivery Market by Technology, 2022-2032 (USD Bn, AGR (%)) (V-Shaped Recovery Scenario)
Figure 17 Global Nanotechnology in Drug Delivery Market by Technology, 2022-2032 (USD Bn, AGR (%)) (W-Shaped Recovery Scenario)
Figure 18 Global Nanotechnology in Drug Delivery Market by Technology, 2022-2032 (USD Bn, AGR (%)) (U-Shaped Recovery Scenario)
Figure 19 Global Nanotechnology in Drug Delivery Market by Technology, 2022-2032 (USD Bn, AGR (%)) (L-Shaped Recovery Scenario)
Figure 20 Global Nanotechnology in Drug Delivery Market Share Forecast by Application 2022, 2027, 2032 (%)
Figure 21 Global Nanotechnology in Drug Delivery Market by Application, 2022-2032 (USD Bn, AGR (%))
Figure 22 Global Nanotechnology in Drug Delivery Market by Application, 2022-2032 (USD Bn, AGR (%)) (V-Shaped Recovery Scenario)
Figure 23 Global Nanotechnology in Drug Delivery Market by Application, 2022-2032 (USD Bn, AGR (%)) (W-Shaped Recovery Scenario)
Figure 24 Global Nanotechnology in Drug Delivery Market by Application, 2022-2032 (USD Bn, AGR (%)) (U-Shaped Recovery Scenario)
Figure 25 Global Nanotechnology in Drug Delivery Market by Application, 2022-2032 (USD Bn, AGR (%)) (L-Shaped Recovery Scenario)
Figure 26 Global Nanotechnology in Drug Delivery Market Share Forecast by Nanoparticle 2022, 2027, 2032 (%)
Figure 27 Global Nanotechnology in Drug Delivery Market by Nanoparticles, 2022-2032 (USD Bn, AGR (%))
Figure 28 Global Nanotechnology in Drug Delivery Market by Nanoparticles, 2022-2032 (USD Bn, AGR (%)) (V-Shaped Recovery Scenario)
Figure 29 Global Nanotechnology in Drug Delivery Market by Nanoparticles, 2022-2032 (USD Bn, AGR (%)) (W-Shaped Recovery Scenario)
Figure 30 Global Nanotechnology in Drug Delivery Market by Nanoparticles, 2022-2032 (USD Bn, AGR (%)) (U-Shaped Recovery Scenario)
Figure 31 Global Nanotechnology in Drug Delivery Market by Nanoparticles, 2022-2032 (USD Bn, AGR (%)) (L-Shaped Recovery Scenario)
Figure 32 North America Nanotechnology in Drug Delivery Market by Value, 2022-2032 (USD Bn, AGR (%))
Figure 33 North America Nanotechnology in Drug Delivery Market by Value, 2022-2032 (USD Bn, AGR (%)) (V-Shaped Recovery Scenario)
Figure 34 North America Nanotechnology in Drug Delivery Market by Value, 2022-2032 (USD Bn, AGR (%)) (W-Shaped Recovery Scenario)
Figure 35 North America Nanotechnology in Drug Delivery Market by Value, 2022-2032 (USD Bn, AGR (%)) (U-Shaped Recovery Scenario)
Figure 36 North America Nanotechnology in Drug Delivery Market by Value, 2022-2032 (USD Bn, AGR (%)) (L-Shaped Recovery Scenario)
Figure 37 North America Nanotechnology in Drug Delivery Market by Country, 2022-2032 (USD Bn, AGR (%))
Figure 38 North America Nanotechnology in Drug Delivery Market by Country, 2022-2032 (USD Bn, AGR (%)) (V-Shaped Recovery Scenario)
Figure 39 North America Nanotechnology in Drug Delivery Market by Country, 2022-2032 (USD Bn, AGR (%)) (W-Shaped Recovery Scenario)
Figure 40 North America Nanotechnology in Drug Delivery Market by Country, 2022-2032 (USD Bn, AGR (%)) (U-Shaped Recovery Scenario)
Figure 41 North America Nanotechnology in Drug Delivery Market by Country, 2022-2032 (USD Bn, AGR (%)) (L-Shaped Recovery Scenario)
Figure 42 North America Nanotechnology in Drug Delivery Market by Technology, 2022-2032 (USD Bn, AGR (%))
Figure 43 North America Nanotechnology in Drug Delivery Market by Technology, 2022-2032 (USD Bn, AGR (%)) (V-Shaped Recovery Scenario)
Figure 44 North America Nanotechnology in Drug Delivery Market by Technology, 2022-2032 (USD Bn, AGR (%)) (W-Shaped Recovery Scenario)
Figure 45 North America Nanotechnology in Drug Delivery Market by Technology, 2022-2032 (USD Bn, AGR (%)) (U-Shaped Recovery Scenario)
Figure 46 North America Nanotechnology in Drug Delivery Market by Technology, 2022-2032 (USD Bn, AGR (%)) (L-Shaped Recovery Scenario)
Figure 47 North America Nanotechnology in Drug Delivery Market by Application, 2022-2032 (USD Bn, AGR (%))
Figure 48 North America Nanotechnology in Drug Delivery Market by Application, 2022-2032 (USD Bn, AGR (%)) (V-Shaped Recovery Scenario)
Figure 49 North America Nanotechnology in Drug Delivery Market by Application, 2022-2032 (USD Bn, AGR (%)) (W-Shaped Recovery Scenario)
Figure 50 North America Nanotechnology in Drug Delivery Market by Application, 2022-2032 (USD Bn, AGR (%)) (U-Shaped Recovery Scenario)
Figure 51 North America Nanotechnology in Drug Delivery Market by Application, 2022-2032 (USD Bn, AGR (%)) (L-Shaped Recovery Scenario)
Figure 52 North America Nanotechnology in Drug Delivery Market by Nanoparticles, 2022-2032 (USD Bn, AGR (%))
Figure 53 North America Nanotechnology in Drug Delivery Market by Nanoparticles, 2022-2032 (USD Bn, AGR (%)) (V-Shaped Recovery Scenario)
Figure 54 North America Nanotechnology in Drug Delivery Market by Nanoparticles, 2022-2032 (USD Bn, AGR (%)) (W-Shaped Recovery Scenario)
Figure 55 North America Nanotechnology in Drug Delivery Market by Nanoparticles, 2022-2032 (USD Bn, AGR (%)) (U-Shaped Recovery Scenario)
Figure 56 North America Nanotechnology in Drug Delivery Market by Nanoparticles, 2022-2032 (USD Bn, AGR (%)) (L-Shaped Recovery Scenario)
Figure 57 U.S. Nanotechnology in Drug Delivery Market by Value, 2022-2032 (USD Bn, AGR (%))
Figure 58 U.S. Nanotechnology in Drug Delivery Market by Value, 2022-2032 (USD Bn, AGR (%)) (V-Shaped Recovery Scenario)
Figure 59 U.S. Nanotechnology in Drug Delivery Market by Value, 2022-2032 (USD Bn, AGR (%)) (W-Shaped Recovery Scenario)
Figure 60 U.S. Nanotechnology in Drug Delivery Market by Value, 2022-2032 (USD Bn, AGR (%)) (U-Shaped Recovery Scenario)
Figure 61 U.S. Nanotechnology in Drug Delivery Market by Value, 2022-2032 (USD Bn, AGR (%)) (L-Shaped Recovery Scenario)
Figure 62 Canada Nanotechnology in Drug Delivery Market by Value, 2022-2032 (USD Bn, AGR (%))
Figure 63 Canada Nanotechnology in Drug Delivery Market by Value, 2022-2032 (USD Bn, AGR (%)) (V-Shaped Recovery Scenario)
Figure 64 Canada Nanotechnology in Drug Delivery Market by Value, 2022-2032 (USD Bn, AGR (%)) (W-Shaped Recovery Scenario)
Figure 65 Canada Nanotechnology in Drug Delivery Market by Value, 2022-2032 (USD Bn, AGR (%)) (U-Shaped Recovery Scenario)
Figure 66 Canada Nanotechnology in Drug Delivery Market by Value, 2022-2032 (USD Bn, AGR (%)) (L-Shaped Recovery Scenario)
Figure 67 Mexico Nanotechnology in Drug Delivery Market by Value, 2022-2032 (USD Bn, AGR (%))
Figure 68 Mexico Nanotechnology in Drug Delivery Market by Value, 2022-2032 (USD Bn, AGR (%)) (V-Shaped Recovery Scenario)
Figure 69 Mexico Nanotechnology in Drug Delivery Market by Value, 2022-2032 (USD Bn, AGR (%)) (W-Shaped Recovery Scenario)
Figure 70 Mexico Nanotechnology in Drug Delivery Market by Value, 2022-2032 (USD Bn, AGR (%)) (U-Shaped Recovery Scenario)
Figure 71 Mexico Nanotechnology in Drug Delivery Market by Value, 2022-2032 (USD Bn, AGR (%)) (L-Shaped Recovery Scenario)
Figure 72 Europe Nanotechnology in Drug Delivery Market by Value, 2022-2032 (USD Bn, AGR (%))
Figure 73 Europe Nanotechnology in Drug Delivery Market by Value, 2022-2032 (USD Bn, AGR (%)) (V-Shaped Recovery Scenario)
Figure 74 Europe Nanotechnology in Drug Delivery Market by Value, 2022-2032 (USD Bn, AGR (%)) (W-Shaped Recovery Scenario)
Figure 75 Europe Nanotechnology in Drug Delivery Market by Value, 2022-2032 (USD Bn, AGR (%)) (U-Shaped Recovery Scenario)
Figure 76 Europe Nanotechnology in Drug Delivery Market by Value, 2022-2032 (USD Bn, AGR (%)) (L-Shaped Recovery Scenario)
Figure 77 Europe Nanotechnology in Drug Delivery Market by Country, 2022-2032 (USD Bn, AGR (%))
Figure 78 Europe Nanotechnology in Drug Delivery Market by Country, 2022-2032 (USD Bn, AGR (%)) (V-Shaped Recovery Scenario)
Figure 79 Europe Nanotechnology in Drug Delivery Market by Country, 2022-2032 (USD Bn, AGR (%)) (W-Shaped Recovery Scenario)
Figure 80 Europe Nanotechnology in Drug Delivery Market by Country, 2022-2032 (USD Bn, AGR (%)) (U-Shaped Recovery Scenario)
Figure 81 Europe Nanotechnology in Drug Delivery Market by Country, 2022-2032 (USD Bn, AGR (%)) (L-Shaped Recovery Scenario)
Figure 82 Europe Nanotechnology in Drug Delivery Market by Technology, 2022-2032 (USD Bn, AGR (%))
Figure 83 Europe Nanotechnology in Drug Delivery Market by Technology, 2022-2032 (USD Bn, AGR (%)) (V-Shaped Recovery Scenario)
Figure 84 Europe Nanotechnology in Drug Delivery Market by Technology, 2022-2032 (USD Bn, AGR (%)) (W-Shaped Recovery Scenario)
Figure 85 Europe Nanotechnology in Drug Delivery Market by Technology, 2022-2032 (USD Bn, AGR (%)) (U-Shaped Recovery Scenario)
Figure 86 Europe Nanotechnology in Drug Delivery Market by Technology, 2022-2032 (USD Bn, AGR (%)) (L-Shaped Recovery Scenario)
Figure 87 Europe Nanotechnology in Drug Delivery Market by Application, 2022-2032 (USD Bn, AGR (%))
Figure 88 Europe Nanotechnology in Drug Delivery Market by Application, 2022-2032 (USD Bn, AGR (%)) (V-Shaped Recovery Scenario)
Figure 89 Europe Nanotechnology in Drug Delivery Market by Application, 2022-2032 (USD Bn, AGR (%)) (W-Shaped Recovery Scenario)
Figure 90 Europe Nanotechnology in Drug Delivery Market by Application, 2022-2032 (USD Bn, AGR (%)) (U-Shaped Recovery Scenario)
Figure 91 Europe Nanotechnology in Drug Delivery Market by Application, 2022-2032 (USD Bn, AGR (%)) (L-Shaped Recovery Scenario)
Figure 92 Europe Nanotechnology in Drug Delivery Market by Nanoparticles, 2022-2032 (USD Bn, AGR (%))
Figure 93 Europe Nanotechnology in Drug Delivery Market by Nanoparticles, 2022-2032 (USD Bn, AGR (%)) (V-Shaped Recovery Scenario)
Figure 94 Europe Nanotechnology in Drug Delivery Market by Nanoparticles, 2022-2032 (USD Bn, AGR (%)) (W-Shaped Recovery Scenario)
Figure 95 Europe Nanotechnology in Drug Delivery Market by Nanoparticles, 2022-2032 (USD Bn, AGR (%)) (U-Shaped Recovery Scenario)
Figure 96 Europe Nanotechnology in Drug Delivery Market by Nanoparticles, 2022-2032 (USD Bn, AGR (%)) (L-Shaped Recovery Scenario)
Figure 97 Germany Nanotechnology in Drug Delivery Market by Value, 2022-2032 (USD Bn, AGR (%))
Figure 98 Germany Nanotechnology in Drug Delivery Market by Value, 2022-2032 (USD Bn, AGR (%)) (V-Shaped Recovery Scenario)
Figure 99 Germany Nanotechnology in Drug Delivery Market by Value, 2022-2032 (USD Bn, AGR (%)) (W-Shaped Recovery Scenario)
Figure 100 Germany Nanotechnology in Drug Delivery Market by Value, 2022-2032 (USD Bn, AGR (%)) (U-Shaped Recovery Scenario)
Figure 101 Germany Nanotechnology in Drug Delivery Market by Value, 2022-2032 (USD Bn, AGR (%)) (L-Shaped Recovery Scenario)
Figure 102 UK Nanotechnology in Drug Delivery Market by Value, 2022-2032 (USD Bn, AGR (%))
Figure 103 UK Nanotechnology in Drug Delivery Market by Value, 2022-2032 (USD Bn, AGR (%)) (V-Shaped Recovery Scenario)
Figure 104 UK Nanotechnology in Drug Delivery Market by Value, 2022-2032 (USD Bn, AGR (%)) (W-Shaped Recovery Scenario)
Figure 105 UK Nanotechnology in Drug Delivery Market by Value, 2022-2032 (USD Bn, AGR (%)) (U-Shaped Recovery Scenario)
Figure 106 UK Nanotechnology in Drug Delivery Market by Value, 2022-2032 (USD Bn, AGR (%)) (L-Shaped Recovery Scenario)
Figure 107 France Nanotechnology in Drug Delivery Market by Value, 2022-2032 (USD Bn, AGR (%))
Figure 108 France Nanotechnology in Drug Delivery Market by Value, 2022-2032 (USD Bn, AGR (%)) (V-Shaped Recovery Scenario)
Figure 109 France Nanotechnology in Drug Delivery Market by Value, 2022-2032 (USD Bn, AGR (%)) (W-Shaped Recovery Scenario)
Figure 110 France Nanotechnology in Drug Delivery Market by Value, 2022-2032 (USD Bn, AGR (%)) (U-Shaped Recovery Scenario)
Figure 111 France Nanotechnology in Drug Delivery Market by Value, 2022-2032 (USD Bn, AGR (%)) (L-Shaped Recovery Scenario)
Figure 112 Italy Nanotechnology in Drug Delivery Market by Value, 2022-2032 (USD Bn, AGR (%))
Figure 113 Italy Nanotechnology in Drug Delivery Market by Value, 2022-2032 (USD Bn, AGR (%)) (V-Shaped Recovery Scenario)
Figure 114 Italy Nanotechnology in Drug Delivery Market by Value, 2022-2032 (USD Bn, AGR (%)) (W-Shaped Recovery Scenario)
Figure 115 Italy Nanotechnology in Drug Delivery Market by Value, 2022-2032 (USD Bn, AGR (%)) (U-Shaped Recovery Scenario)
Figure 116 Italy Nanotechnology in Drug Delivery Market by Value, 2022-2032 (USD Bn, AGR (%)) (L-Shaped Recovery Scenario)
Figure 117 Spain Nanotechnology in Drug Delivery Market by Value, 2022-2032 (USD Bn, AGR (%))
Figure 118 Spain Nanotechnology in Drug Delivery Market by Value, 2022-2032 (USD Bn, AGR (%)) (V-Shaped Recovery Scenario)
Figure 119 Spain Nanotechnology in Drug Delivery Market by Value, 2022-2032 (USD Bn, AGR (%)) (W-Shaped Recovery Scenario)
Figure 120 Spain Nanotechnology in Drug Delivery Market by Value, 2022-2032 (USD Bn, AGR (%)) (U-Shaped Recovery Scenario)
Figure 121 Spain Nanotechnology in Drug Delivery Market by Value, 2022-2032 (USD Bn, AGR (%)) (L-Shaped Recovery Scenario)
Figure 122 Rest of Europe Nanotechnology in Drug Delivery Market by Value, 2022-2032 (USD Bn, AGR (%))
Figure 123 Rest of Europe Nanotechnology in Drug Delivery Market by Value, 2022-2032 (USD Bn, AGR (%)) (V-Shaped Recovery Scenario)
Figure 124 Rest of Europe Nanotechnology in Drug Delivery Market by Value, 2022-2032 (USD Bn, AGR (%)) (W-Shaped Recovery Scenario)
Figure 125 Rest of Europe Nanotechnology in Drug Delivery Market by Value, 2022-2032 (USD Bn, AGR (%)) (U-Shaped Recovery Scenario)
Figure 126 Rest of Europe Nanotechnology in Drug Delivery Market by Value, 2022-2032 (USD Bn, AGR (%)) (L-Shaped Recovery Scenario)
Figure 127 Asia-Pacific Nanotechnology in Drug Delivery Market by Value, 2022-2032 (USD Bn, AGR (%))
Figure 128 Asia-Pacific Nanotechnology in Drug Delivery Market by Value, 2022-2032 (USD Bn, AGR (%)) (V-Shaped Recovery Scenario)
Figure 129 Asia-Pacific Nanotechnology in Drug Delivery Market by Value, 2022-2032 (USD Bn, AGR (%)) (W-Shape recovery)
Figure 130 Asia-Pacific Nanotechnology in Drug Delivery Market by Value, 2022-2032 (USD Bn, AGR (%)) (U-Shaped Recovery Scenario)
Figure 131 Asia-Pacific Nanotechnology in Drug Delivery Market by Value, 2022-2032 (USD Bn, AGR (%)) (L-Shaped Recovery Scenario)
Figure 132 Asia-Pacific Nanotechnology in Drug Delivery Market by Country, 2022-2032 (USD Bn, AGR (%))
Figure 133 Asia-Pacific Nanotechnology in Drug Delivery Market by Country, 2022-2032 (USD Bn, AGR (%)) (V-Shaped Recovery Scenario)
Figure 134 Asia-Pacific Nanotechnology in Drug Delivery Market by Country, 2022-2032 (USD Bn, AGR (%)) (W-Shape recovery)
Figure 135 Asia-Pacific Nanotechnology in Drug Delivery Market by Country, 2022-2032 (USD Bn, AGR (%)) (U-Shaped Recovery Scenario)
Figure 136 Asia-Pacific Nanotechnology in Drug Delivery Market by Country, 2022-2032 (USD Bn, AGR (%)) (L-Shaped Recovery Scenario)
Figure 137 Asia-Pacific Nanotechnology in Drug Delivery Market by Technology, 2022-2032 (USD Bn, AGR (%))
Figure 138 Asia-Pacific Nanotechnology in Drug Delivery Market by Technology, 2022-2032 (USD Bn, AGR (%)) (V-Shaped Recovery Scenario)
Figure 139 Asia-Pacific Nanotechnology in Drug Delivery Market by Technology, 2022-2032 (USD Bn, AGR (%)) (W-Shape recovery)
Figure 140 Asia-Pacific Nanotechnology in Drug Delivery Market by Technology, 2022-2032 (USD Bn, AGR (%)) (U-Shaped Recovery Scenario)
Figure 141 Asia-Pacific Nanotechnology in Drug Delivery Market by Technology, 2022-2032 (USD Bn, AGR (%)) (L-Shaped Recovery Scenario)
Figure 142 Asia-Pacific Nanotechnology in Drug Delivery Market by Application, 2022-2032 (USD Bn, AGR (%))
Figure 143 Asia-Pacific Nanotechnology in Drug Delivery Market by Application, 2022-2032 (USD Bn, AGR (%)) (V-Shaped Recovery Scenario)
Figure 144 Asia-Pacific Nanotechnology in Drug Delivery Market by Application, 2022-2032 (USD Bn, AGR (%)) (W-Shape recovery)
Figure 145 Asia-Pacific Nanotechnology in Drug Delivery Market by Application, 2022-2032 (USD Bn, AGR (%)) (U-Shaped Recovery Scenario)
Figure 146 Asia-Pacific Nanotechnology in Drug Delivery Market by Application, 2022-2032 (USD Bn, AGR (%)) (L-Shaped Recovery Scenario)
Figure 147 Asia-Pacific Nanotechnology in Drug Delivery Market by Nanoparticles, 2022-2032 (USD Bn, AGR (%))
Figure 148 Asia-Pacific Nanotechnology in Drug Delivery Market by Nanoparticles, 2022-2032 (USD Bn, AGR (%)) (V-Shaped Recovery Scenario)
Figure 149 Asia-Pacific Nanotechnology in Drug Delivery Market by Nanoparticles, 2022-2032 (USD Bn, AGR (%)) (W-Shape recovery)
Figure 150 Asia-Pacific Nanotechnology in Drug Delivery Market by Nanoparticles, 2022-2032 (USD Bn, AGR (%)) (U-Shaped Recovery Scenario)
Figure 151 Asia-Pacific Nanotechnology in Drug Delivery Market by Nanoparticles, 2022-2032 (USD Bn, AGR (%)) (L-Shaped Recovery Scenario)
Figure 152 China Nanotechnology in Drug Delivery Market by Value, 2022-2032 (USD Bn, AGR (%))
Figure 153 China Nanotechnology in Drug Delivery Market by Value, 2022-2032 (USD Bn, AGR (%)) (V-Shaped Recovery Scenario)
Figure 154 China Nanotechnology in Drug Delivery Market by Value, 2022-2032 (USD Bn, AGR (%)) (W-Shaped Recovery Scenario)
Figure 155 China Nanotechnology in Drug Delivery Market by Value, 2022-2032 (USD Bn, AGR (%)) (U-Shaped Recovery Scenario)
Figure 156 China Nanotechnology in Drug Delivery Market by Value, 2022-2032 (USD Bn, AGR (%)) (L-Shaped Recovery Scenario)
Figure 157 India Nanotechnology in Drug Delivery Market by Value, 2022-2032 (USD Bn, AGR (%))
Figure 158 India Nanotechnology in Drug Delivery Market by Value, 2022-2032 (USD Bn, AGR (%)) (V-Shaped Recovery Scenario)
Figure 159 India Nanotechnology in Drug Delivery Market by Value, 2022-2032 (USD Bn, AGR (%)) (W-Shaped Recovery Scenario)
Figure 160 India Nanotechnology in Drug Delivery Market by Value, 2022-2032 (USD Bn, AGR (%)) (U-Shaped Recovery Scenario)
Figure 161 India Nanotechnology in Drug Delivery Market by Value, 2022-2032 (USD Bn, AGR (%)) (L-Shaped Recovery Scenario)
Figure 162 Japan Nanotechnology in Drug Delivery Market by Value, 2022-2032 (USD Bn, AGR (%))
Figure 163 Japan Nanotechnology in Drug Delivery Market by Value, 2022-2032 (USD Bn, AGR (%)) (V-Shaped Recovery Scenario)
Figure 164 Japan Nanotechnology in Drug Delivery Market by Value, 2022-2032 (USD Bn, AGR (%)) (W-Shaped Recovery Scenario)
Figure 165 Japan Nanotechnology in Drug Delivery Market by Value, 2022-2032 (USD Bn, AGR (%)) (U-Shaped Recovery Scenario)
Figure 166 Japan Nanotechnology in Drug Delivery Market by Value, 2022-2032 (USD Bn, AGR (%)) (L-Shaped Recovery Scenario)
Figure 167 South Korea Nanotechnology in Drug Delivery Market by Value, 2022-2032 (USD Bn, AGR (%))
Figure 168 South Korea Nanotechnology in Drug Delivery Market by Value, 2022-2032 (USD Bn, AGR (%)) (V-Shaped Recovery Scenario)
Figure 169 South Korea Nanotechnology in Drug Delivery Market by Value, 2022-2032 (USD Bn, AGR (%)) (W-Shaped Recovery Scenario)
Figure 170 South Korea Nanotechnology in Drug Delivery Market by Value, 2022-2032 (USD Bn, AGR (%)) (U-Shaped Recovery Scenario)
Figure 171 South Korea Nanotechnology in Drug Delivery Market by Value, 2022-2032 (USD Bn, AGR (%)) (L-Shaped Recovery Scenario)
Figure 172 Australia Nanotechnology in Drug Delivery Market by Value, 2022-2032 (USD Bn, AGR (%))
Figure 173 Australia Nanotechnology in Drug Delivery Market by Value, 2022-2032 (USD Bn, AGR (%)) (V-Shaped Recovery Scenario)
Figure 174 Australia Nanotechnology in Drug Delivery Market by Value, 2022-2032 (USD Bn, AGR (%)) (W-Shaped Recovery Scenario)
Figure 175 Australia Nanotechnology in Drug Delivery Market by Value, 2022-2032 (USD Bn, AGR (%)) (U-Shaped Recovery Scenario)
Figure 176 Australia Nanotechnology in Drug Delivery Market by Value, 2022-2032 (USD Bn, AGR (%)) (L-Shaped Recovery Scenario)
Figure 177 Rest of Asia-Pacific Nanotechnology in Drug Delivery Market by Value, 2022-2032 (USD Bn, AGR (%))
Figure 178 Rest of Asia-Pacific Nanotechnology in Drug Delivery Market by Value, 2022-2032 (USD Bn, AGR (%)) (V-Shaped Recovery Scenario)
Figure 179 Rest of Asia-Pacific Nanotechnology in Drug Delivery Market by Value, 2022-2032 (USD Bn, AGR (%)) (W-Shaped Recovery Scenario)
Figure 180 Rest of Asia-Pacific Nanotechnology in Drug Delivery Market by Value, 2022-2032 (USD Bn, AGR (%)) (U-Shaped Recovery Scenario)
Figure 181 Rest of Asia-Pacific Nanotechnology in Drug Delivery Market by Value, 2022-2032 (USD Bn, AGR (%)) (L-Shaped Recovery Scenario)
Figure 182 LAMEA Nanotechnology in Drug Delivery Market by Value, 2022-2032 (USD Bn, AGR (%))
Figure 183 LAMEA Nanotechnology in Drug Delivery Market by Value, 2022-2032 (USD Bn, AGR (%)) (V-Shaped Recovery Scenario)
Figure 184 LAMEA Nanotechnology in Drug Delivery Market by Value, 2022-2032 (USD Bn, AGR (%)) (W-Shaped Recovery Scenario)
Figure 185 LAMEA Nanotechnology in Drug Delivery Market by Value, 2022-2032 (USD Bn, AGR (%)) (U-Shaped Recovery Scenario)
Figure 186 LAMEA Nanotechnology in Drug Delivery Market by Value, 2022-2032 (USD Bn, AGR (%)) (L-Shaped Recovery Scenario)
Figure 187 LAMEA Nanotechnology in Drug Delivery Market by Country, 2022-2032 (USD Bn, AGR (%))
Figure 188 LAMEA Nanotechnology in Drug Delivery Market by Country, 2022-2032 (USD Bn, AGR (%)) (V-Shaped Recovery Scenario)
Figure 189 LAMEA Nanotechnology in Drug Delivery Market by Country, 2022-2032 (USD Bn, AGR (%)) (W-Shaped Recovery Scenario)
Figure 190 LAMEA Nanotechnology in Drug Delivery Market by Country, 2022-2032 (USD Bn, AGR (%)) (U-Shaped Recovery Scenario)
Figure 191 LAMEA Nanotechnology in Drug Delivery Market by Country, 2022-2032 (USD Bn, AGR (%)) (L-Shaped Recovery Scenario)
Figure 192 LAMEA Nanotechnology in Drug Delivery Market by Technology, 2022-2032 (USD Bn, AGR (%))
Figure 193 LAMEA Nanotechnology in Drug Delivery Market by Technology, 2022-2032 (USD Bn, AGR (%)) (V-Shaped Recovery Scenario)
Figure 194 LAMEA Nanotechnology in Drug Delivery Market by Technology, 2022-2032 (USD Bn, AGR (%)) (W-Shaped Recovery Scenario)
Figure 195 LAMEA Nanotechnology in Drug Delivery Market by Technology, 2022-2032 (USD Bn, AGR (%)) (U-Shaped Recovery Scenario)
Figure 196 LAMEA Nanotechnology in Drug Delivery Market by Technology, 2022-2032 (USD Bn, AGR (%)) (L-Shaped Recovery Scenario)
Figure 197 LAMEA Nanotechnology in Drug Delivery Market by Application, 2022-2032 (USD Bn, AGR (%))
Figure 198 LAMEA Nanotechnology in Drug Delivery Market by Application, 2022-2032 (USD Bn, AGR (%)) (V-Shaped Recovery Scenario)
Figure 199 LAMEA Nanotechnology in Drug Delivery Market by Application, 2022-2032 (USD Bn, AGR (%)) (W-Shaped Recovery Scenario)
Figure 200 LAMEA Nanotechnology in Drug Delivery Market by Application, 2022-2032 (USD Bn, AGR (%)) (U-Shaped Recovery Scenario)
Figure 201 LAMEA Nanotechnology in Drug Delivery Market by Application, 2022-2032 (USD Bn, AGR (%)) (L-Shaped Recovery Scenario)
Figure 202 LAMEA Nanotechnology in Drug Delivery Market by Nanoparticles, 2022-2032 (USD Bn, AGR (%))
Figure 203 LAMEA Nanotechnology in Drug Delivery Market by Nanoparticles, 2022-2032 (USD Bn, AGR (%)) (V-Shaped Recovery Scenario)
Figure 204 LAMEA Nanotechnology in Drug Delivery Market by Nanoparticles, 2022-2032 (USD Bn, AGR (%)) (W-Shaped Recovery Scenario)
Figure 205 LAMEA Nanotechnology in Drug Delivery Market by Nanoparticles, 2022-2032 (USD Bn, AGR (%)) (U-Shaped Recovery Scenario)
Figure 206 LAMEA Nanotechnology in Drug Delivery Market by Nanoparticles, 2022-2032 (USD Bn, AGR (%)) (L-Shaped Recovery Scenario)
Figure 207 Brazil Nanotechnology in Drug Delivery Market by Value, 2022-2032 (USD Bn, AGR (%))
Figure 208 Brazil Nanotechnology in Drug Delivery Market by Value, 2022-2032 (USD Bn, AGR (%)) (V-Shaped Recovery Scenario)
Figure 209 Brazil Nanotechnology in Drug Delivery Market by Value, 2022-2032 (USD Bn, AGR (%)) (W-Shaped Recovery Scenario)
Figure 210 Brazil Nanotechnology in Drug Delivery Market by Value, 2022-2032 (USD Bn, AGR (%)) (U-Shaped Recovery Scenario)
Figure 211 Brazil Nanotechnology in Drug Delivery Market by Value, 2022-2032 (USD Bn, AGR (%)) (L-Shaped Recovery Scenario)
Figure 212 South Africa Nanotechnology in Drug Delivery Market by Value, 2022-2032 (USD Bn, AGR (%))
Figure 213 South Africa Nanotechnology in Drug Delivery Market by Value, 2022-2032 (USD Bn, AGR (%)) (V-Shaped Recovery Scenario)
Figure 214 South Africa Nanotechnology in Drug Delivery Market by Value, 2022-2032 (USD Bn, AGR (%)) (W-Shaped Recovery Scenario)
Figure 215 South Africa Nanotechnology in Drug Delivery Market by Value, 2022-2032 (USD Bn, AGR (%)) (U-Shaped Recovery Scenario)
Figure 216 South Africa Nanotechnology in Drug Delivery Market by Value, 2022-2032 (USD Bn, AGR (%)) (L-Shaped Recovery Scenario)
Figure 217 Saudi Arabia Nanotechnology in Drug Delivery Market by Value, 2022-2032 (USD Bn, AGR (%))
Figure 218 Saudi Arabia Nanotechnology in Drug Delivery Market by Value, 2022-2032 (USD Bn, AGR (%)) (V-Shaped Recovery Scenario)
Figure 219 Saudi Arabia Nanotechnology in Drug Delivery Market by Value, 2022-2032 (USD Bn, AGR (%)) (W-Shaped Recovery Scenario)
Figure 220 Saudi Arabia Nanotechnology in Drug Delivery Market by Value, 2022-2032 (USD Bn, AGR (%)) (U-Shaped Recovery Scenario)
Figure 221 Saudi Arabia Nanotechnology in Drug Delivery Market by Value, 2022-2032 (USD Bn, AGR (%)) (L-Shaped Recovery Scenario)
Figure 222 Turkey Nanotechnology in Drug Delivery Market by Value, 2022-2032 (USD Bn, AGR (%))
Figure 223 Turkey Nanotechnology in Drug Delivery Market by Value, 2022-2032 (USD Bn, AGR (%)) (V-Shaped Recovery Scenario)
Figure 224 Turkey Nanotechnology in Drug Delivery Market by Value, 2022-2032 (USD Bn, AGR (%)) (W-Shaped Recovery Scenario)
Figure 225 Turkey Nanotechnology in Drug Delivery Market by Value, 2022-2032 (USD Bn, AGR (%)) (U-Shaped Recovery Scenario)
Figure 226 Turkey Nanotechnology in Drug Delivery Market by Value, 2022-2032 (USD Bn, AGR (%)) (L-Shaped Recovery Scenario)
Figure 227 UAE Nanotechnology in Drug Delivery Market by Value, 2022-2032 (USD Bn, AGR (%))
Figure 228 UAE Nanotechnology in Drug Delivery Market by Value, 2022-2032 (USD Bn, AGR (%)) (V-Shaped Recovery Scenario)
Figure 229 UAE Nanotechnology in Drug Delivery Market by Value, 2022-2032 (USD Bn, AGR (%)) (W-Shaped Recovery Scenario)
Figure 230 UAE Nanotechnology in Drug Delivery Market by Value, 2022-2032 (USD Bn, AGR (%)) (U-Shaped Recovery Scenario)
Figure 231 UAE Nanotechnology in Drug Delivery Market by Value, 2022-2032 (USD Bn, AGR (%)) (L-Shaped Recovery Scenario)
Figure 232 Rest of LAMEA Nanotechnology in Drug Delivery Market by Value, 2022-2032 (USD Bn, AGR (%))
Figure 233 Rest of LAMEA Nanotechnology in Drug Delivery Market by Value, 2022-2032 (USD Bn, AGR (%)) (V-Shaped Recovery Scenario)
Figure 234 Rest of LAMEA Nanotechnology in Drug Delivery Market by Value, 2022-2032 (USD Bn, AGR (%)) (W-Shaped Recovery Scenario)
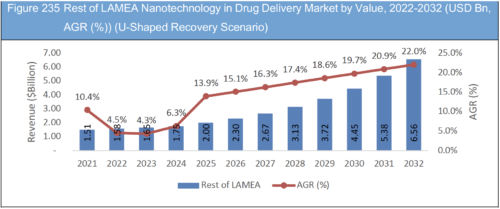
Figure 235 Rest of LAMEA Nanotechnology in Drug Delivery Market by Value, 2022-2032 (USD Bn, AGR (%)) (U-Shaped Recovery Scenario)
Figure 236 Rest of LAMEA Nanotechnology in Drug Delivery Market by Value, 2022-2032 (USD Bn, AGR (%)) (L-Shaped Recovery Scenario)
Figure 237 Merck & Co Inc: Company Revenue 2017-2021 (US$Mn, AGR %)
Figure 238 Merck & Co Inc: Company Operating Income 2017-2021 (US$Mn, AGR %)
Figure 239 Merck & Co Inc: Company Net Income 2017-2021 (US$Mn, AGR %)
Figure 240 Merck & Co Inc: Company EBITDA 2017-2021 (US$Mn, AGR %)
Figure 241 Bayer AG: Company Revenue 2017-2021 (US$Mn, AGR %)
Figure 242 Bayer AG: Company Operating Income 2017-2021 (US$Mn, AGR %)
Figure 243 Bayer AG: Company Net Income 2017-2021 (US$Mn, AGR %)
Figure 244 Bayer AG: Company EBITDA 2017-2021 (US$Mn, AGR %)
Figure 245 Amgen Inc: Company Revenue 2017-2021 (US$Mn, AGR %)
Figure 246 Amgen Inc: Company Operating Income 2017-2021 (US$Mn, AGR %)
Figure 247 Amgen Inc: Company Net Income 2017-2021 (US$Mn, AGR %)
Figure 248 Amgen Inc: Company EBITDA 2017-2021 (US$Mn, AGR %)
Figure 249 Pfizer Inc: Company Revenue 2017-2021 (US$Mn, AGR %)
Figure 250 Pfizer Inc: Company Operating Income 2017-2021 (US$Mn, AGR %)
Figure 251 Pfizer Inc: Company Net Income 2017-2021 (US$Mn, AGR %)
Figure 252 Pfizer Inc: Company EBITDA 2017-2021 (US$Mn, AGR %)
Figure 253 Novartis AG: Company Revenue 2017-2021 (US$Mn, AGR %)
Figure 254 Novartis AG: Company Operating Income 2017-2021 (US$Mn, AGR %)
Figure 255 Novartis AG: Company Net Income 2017-2021 (US$Mn, AGR %)
Figure 256 Novartis AG: Company EBITDA 2017-2021 (US$Mn, AGR %)
Figure 257 AbbVie Inc: Company Revenue 2017-2021 (US$Mn, AGR %)
Figure 258 AbbVie Inc: Company Operating Income 2017-2021 (US$Mn, AGR %)
Figure 259 AbbVie Inc: Company Net Income 2017-2021 (US$Mn, AGR %)
Figure 260 AbbVie Inc: Company EBITDA 2017-2021 (US$Mn, AGR %)
Figure 261 Roche Holding AG: Company Revenue 2017-2021 (US$Mn, AGR %)
Figure 262 Roche Holding AG: Company Operating Income 2017-2021 (US$Mn, AGR %)
Figure 263 Roche Holding AG: Company Net Income 2017-2021 (US$Mn, AGR %)
Figure 264 Roche Holding AG: Company EBITDA 2017-2021 (US$Mn, AGR %)
Figure 265 Johnson & Johnson: Company Revenue 2017-2021 (US$Mn, AGR %)
Figure 266 Johnson & Johnson: Company Operating Income 2017-2021 (US$Mn, AGR %)
Figure 267 Johnson & Johnson: Company Net Income 2017-2021 (US$Mn, AGR %)
Figure 268 Johnson & Johnson: Company EBITDA 2017-2021 (US$Mn, AGR %)
Figure 269 Glaxo SmithKline plc: Company Revenue 2017-2021 (US$Mn, AGR %)
Figure 270 Glaxo SmithKline plc: Company Operating Income 2017-2021 (US$Mn, AGR %)
Figure 271 Glaxo SmithKline plc: Company Net Income 2017-2021 (US$Mn, AGR %)
Figure 272 Glaxo SmithKline plc: Company EBITDA 2017-2021 (US$Mn, AGR %)
Figure 273 Sanofi SA: Company Revenue 2017-2021 (US$Mn, AGR %)
Figure 274 Sanofi SA: Company Operating Income 2017-2021 (US$Mn, AGR %)
Figure 275 Sanofi SA: Company Net Income 2017-2021 (US$Mn, AGR %)
Figure 276 Sanofi SA: Company EBITDA 2017-2021 (US$Mn, AGR %)
Figure 277 Selecta Biosciences: Net Revenue, 2017-2021 (US$million, AGR%)
Figure 278 Selecta Biosciences: Gross Profit, 2017-2021 (US$million, AGR%)
Figure 279 Selecta Biosciences: Net Profit 2017-2021 (US$million, AGR%)
Figure 280 Selecta Biosciences: EBITDA, 2017-2021 (US$million, AGR%)
Figure 281 Starpharma Holdings: Net Revenue, 2017-2021 (US$million, AGR%)
Figure 282 Starpharma Holdings: Gross Profit, 2017-2021 (US$million, AGR%)
Figure 283 Starpharma Holdings: Net Profit 2017-2021 (US$million, AGR%)
Figure 284 Starpharma Holdings: EBITDA, 2017-2021 (US$million, AGR%)
List of Table
Table 1 Global Nanotechnology in Drug Delivery Market Forecast, 2022-2032 (USD Bn, AGR (%), CAGR(%))
Table 2 Global Nanotechnology in Drug Delivery Market Snapshot, 2022 & 2032 (US$billion, CAGR %)
Table 3 Global Nanotechnology in Drug Delivery Market Forecast, 2022-2032 (USD Bn, AGR (%), CAGR(%))
Table 4 Global Nanotechnology in Drug Delivery Market Forecast, 2022-2032 (USD Bn, AGR (%), CAGR(%)) (V-Shaped Recovery Scenario)
Table 5 Global Nanotechnology in Drug Delivery Market Forecast, 2022-2032 (USD Bn, AGR (%), CAGR(%)) (W-Shaped Recovery Scenario)
Table 6 Global Nanotechnology in Drug Delivery Market Forecast, 2022-2032 (USD Bn, AGR (%), CAGR(%)) (U-Shaped Recovery Scenario)
Table 7 Global Nanotechnology in Drug Delivery Market Forecast, 2022-2032 (USD Bn, AGR (%), CAGR(%)) (L-Shaped Recovery Scenario)
Table 8 Global Nanotechnology in Drug Delivery Market by Region, 2022-2032 (USD Bn, AGR (%), CAGR(%))
Table 9 Global Nanotechnology in Drug Delivery Market by Region, 2022-2032 (USD Bn, AGR (%), CAGR(%)) (V-Shaped Recovery Scenario)
Table 10 Global Nanotechnology in Drug Delivery Market by Region, 2022-2032 (USD Bn, AGR (%), CAGR(%)) (W-Shaped Recovery Scenario)
Table 11 Global Nanotechnology in Drug Delivery Market by Region, 2022-2032 (USD Bn, AGR (%), CAGR(%)) (U-Shaped Recovery Scenario)
Table 12 Global Nanotechnology in Drug Delivery Market by Region, 2022-2032 (USD Bn, AGR (%), CAGR(%)) (L-Shaped Recovery Scenario)
Table 13 Global Nanotechnology in Drug Delivery Market by Technology, 2022-2032 (USD Bn, AGR (%), CAGR(%))
Table 14 Global Nanotechnology in Drug Delivery Market by Technology, 2022-2032 (USD Bn, AGR (%), CAGR(%)) (V-Shaped Recovery Scenario)
Table 15 Global Nanotechnology in Drug Delivery Market by Technology, 2022-2032 (USD Bn, AGR (%), CAGR(%)) (W-Shaped Recovery Scenario)
Table 16 Global Nanotechnology in Drug Delivery Market by Technology, 2022-2032 (USD Bn, AGR (%), CAGR(%)) (U-Shaped Recovery Scenario)
Table 17 Global Nanotechnology in Drug Delivery Market by Technology, 2022-2032 (USD Bn, AGR (%), CAGR(%)) (L-Shaped Recovery Scenario)
Table 18 Global Nanotechnology in Drug Delivery Market by Application, 2022-2032 (USD Bn, AGR (%), CAGR(%))
Table 19 Global Nanotechnology in Drug Delivery Market by Application, 2022-2032 (USD Bn, AGR (%), CAGR(%)) (V-Shaped Recovery Scenario)
Table 20 Global Nanotechnology in Drug Delivery Market by Application, 2022-2032 (USD Bn, AGR (%), CAGR(%)) (W-Shaped Recovery Scenario)
Table 21 Global Nanotechnology in Drug Delivery Market by Application, 2022-2032 (USD Bn, AGR (%), CAGR(%)) (U-Shaped Recovery Scenario)
Table 22 Global Nanotechnology in Drug Delivery Market by Application, 2022-2032 (USD Bn, AGR (%), CAGR(%)) (L-Shaped Recovery Scenario)
Table 23 Global Nanotechnology in Drug Delivery Market by Nanoparticles, 2022-2032 (USD Bn, AGR (%), CAGR(%))
Table 24 Global Nanotechnology in Drug Delivery Market by Nanoparticles, 2022-2032 (USD Bn, AGR (%), CAGR(%)) (V-Shaped Recovery Scenario)
Table 25 Global Nanotechnology in Drug Delivery Market by Nanoparticles, 2022-2032 (USD Bn, AGR (%), CAGR(%)) (W-Shaped Recovery Scenario)
Table 26 Global Nanotechnology in Drug Delivery Market by Nanoparticles, 2022-2032 (USD Bn, AGR (%), CAGR(%)) (U-Shaped Recovery Scenario)
Table 27 Global Nanotechnology in Drug Delivery Market by Nanoparticles, 2022-2032 (USD Bn, AGR (%), CAGR(%)) (L-Shaped Recovery Scenario)
Table 28 North America Nanotechnology in Drug Delivery Market by Value, 2022-2032 (USD Bn, AGR (%), CAGR(%))
Table 29 North America Nanotechnology in Drug Delivery Market by Value, 2022-2032 (USD Bn, AGR (%), CAGR(%)) (V-Shaped Recovery Scenario)
Table 30 North America Nanotechnology in Drug Delivery Market by Value, 2022-2032 (USD Bn, AGR (%), CAGR(%)) (W-Shaped Recovery Scenario)
Table 31 North America Nanotechnology in Drug Delivery Market by Value, 2022-2032 (USD Bn, AGR (%), CAGR(%)) (U-Shaped Recovery Scenario)
Table 32 North America Nanotechnology in Drug Delivery Market by Value, 2022-2032 (USD Bn, AGR (%), CAGR(%)) (L-Shaped Recovery Scenario)
Table 33 North America Nanotechnology in Drug Delivery Market by Country, 2022-2032 (USD Bn, AGR (%), CAGR(%))
Table 34 North America Nanotechnology in Drug Delivery Market by Country, 2022-2032 (USD Bn, AGR (%), CAGR(%)) (V-Shaped Recovery Scenario)
Table 35 North America Nanotechnology in Drug Delivery Market by Country, 2022-2032 (USD Bn, AGR (%), CAGR(%)) (W-Shaped Recovery Scenario)
Table 36 North America Nanotechnology in Drug Delivery Market by Country, 2022-2032 (USD Bn, AGR (%), CAGR(%)) (U-Shaped Recovery Scenario)
Table 37 North America Nanotechnology in Drug Delivery Market by Country, 2022-2032 (USD Bn, AGR (%), CAGR(%)) (L-Shaped Recovery Scenario)
Table 38 North America Nanotechnology in Drug Delivery Market by Technology, 2022-2032 (USD Bn, AGR (%), CAGR(%))
Table 39 North America Nanotechnology in Drug Delivery Market by Technology, 2022-2032 (USD Bn, AGR (%), CAGR(%)) (V-Shaped Recovery Scenario)
Table 40 North America Nanotechnology in Drug Delivery Market by Technology, 2022-2032 (USD Bn, AGR (%), CAGR(%)) (W-Shaped Recovery Scenario)
Table 41 North America Nanotechnology in Drug Delivery Market by Technology, 2022-2032 (USD Bn, AGR (%), CAGR(%)) (U-Shaped Recovery Scenario)
Table 42 North America Nanotechnology in Drug Delivery Market by Technology, 2022-2032 (USD Bn, AGR (%), CAGR(%)) (L-Shaped Recovery Scenario)
Table 43 North America Nanotechnology in Drug Delivery Market by Application, 2022-2032 (USD Bn, AGR (%), CAGR(%))
Table 44 North America Nanotechnology in Drug Delivery Market by Application, 2022-2032 (USD Bn, AGR (%), CAGR(%)) (V-Shaped Recovery Scenario)
Table 45 North America Nanotechnology in Drug Delivery Market by Application, 2022-2032 (USD Bn, AGR (%), CAGR(%)) (W-Shaped Recovery Scenario)
Table 46 North America Nanotechnology in Drug Delivery Market by Application, 2022-2032 (USD Bn, AGR (%), CAGR(%)) (U-Shaped Recovery Scenario)
Table 47 North America Nanotechnology in Drug Delivery Market by Application, 2022-2032 (USD Bn, AGR (%), CAGR(%)) (L-Shaped Recovery Scenario)
Table 48 North America Nanotechnology in Drug Delivery Market by Nanoparticles, 2022-2032 (USD Bn, AGR (%), CAGR(%))
Table 49 North America Nanotechnology in Drug Delivery Market by Nanoparticles, 2022-2032 (USD Bn, AGR (%), CAGR(%)) (V-Shaped Recovery Scenario)
Table 50 North America Nanotechnology in Drug Delivery Market by Nanoparticles, 2022-2032 (USD Bn, AGR (%), CAGR(%)) (W-Shaped Recovery Scenario)
Table 51 North America Nanotechnology in Drug Delivery Market by Nanoparticles, 2022-2032 (USD Bn, AGR (%), CAGR(%)) (U-Shaped Recovery Scenario)
Table 52 North America Nanotechnology in Drug Delivery Market by Nanoparticles, 2022-2032 (USD Bn, AGR (%), CAGR(%)) (L-Shaped Recovery Scenario)
Table 53 U.S. Nanotechnology in Drug Delivery Market by Value, 2022-2032 (USD Bn, AGR (%), CAGR(%))
Table 54 U.S. Nanotechnology in Drug Delivery Market by Value, 2022-2032 (USD Bn, AGR (%), CAGR(%)) (V-Shaped Recovery Scenario)
Table 55 U.S. Nanotechnology in Drug Delivery Market by Value, 2022-2032 (USD Bn, AGR (%), CAGR(%)) (W-Shaped Recovery Scenario)
Table 56 U.S. Nanotechnology in Drug Delivery Market by Value, 2022-2032 (USD Bn, AGR (%), CAGR(%)) (U-Shaped Recovery Scenario)
Table 57 U.S. Nanotechnology in Drug Delivery Market by Value, 2022-2032 (USD Bn, AGR (%), CAGR(%)) (L-Shaped Recovery Scenario)
Table 58 Canada Nanotechnology in Drug Delivery Market by Value, 2022-2032 (USD Bn, AGR (%), CAGR(%))
Table 59 Canada Nanotechnology in Drug Delivery Market by Value, 2022-2032 (USD Bn, AGR (%), CAGR(%)) (V-Shaped Recovery Scenario)
Table 60 Canada Nanotechnology in Drug Delivery Market by Value, 2022-2032 (USD Bn, AGR (%), CAGR(%)) (W-Shaped Recovery Scenario)
Table 61 Canada Nanotechnology in Drug Delivery Market by Value, 2022-2032 (USD Bn, AGR (%), CAGR(%)) (U-Shaped Recovery Scenario)
Table 62 Canada Nanotechnology in Drug Delivery Market by Value, 2022-2032 (USD Bn, AGR (%), CAGR(%)) (L-Shaped Recovery Scenario)
Table 63 Mexico Nanotechnology in Drug Delivery Market by Value, 2022-2032 (USD Bn, AGR (%), CAGR(%))
Table 64 Mexico Nanotechnology in Drug Delivery Market by Value, 2022-2032 (USD Bn, AGR (%), CAGR(%)) (V-Shaped Recovery Scenario)
Table 65 Mexico Nanotechnology in Drug Delivery Market by Value, 2022-2032 (USD Bn, AGR (%), CAGR(%)) (W-Shaped Recovery Scenario)
Table 66 Mexico Nanotechnology in Drug Delivery Market by Value, 2022-2032 (USD Bn, AGR (%), CAGR(%)) (U-Shaped Recovery Scenario)
Table 67 Mexico Nanotechnology in Drug Delivery Market by Value, 2022-2032 (USD Bn, AGR (%), CAGR(%)) (L-Shaped Recovery Scenario)
Table 68 Europe Nanotechnology in Drug Delivery Market by Value, 2022-2032 (USD Bn, AGR (%), CAGR(%))
Table 69 Europe Nanotechnology in Drug Delivery Market by Value, 2022-2032 (USD Bn, AGR (%), CAGR(%)) (V-Shaped Recovery Scenario)
Table 70 Europe Nanotechnology in Drug Delivery Market by Value, 2022-2032 (USD Bn, AGR (%), CAGR(%)) (W-Shaped Recovery Scenario)
Table 71 Europe Nanotechnology in Drug Delivery Market by Value, 2022-2032 (USD Bn, AGR (%), CAGR(%)) (U-Shaped Recovery Scenario)
Table 72 Europe Nanotechnology in Drug Delivery Market by Value, 2022-2032 (USD Bn, AGR (%), CAGR(%)) (L-Shaped Recovery Scenario)
Table 73 Europe Nanotechnology in Drug Delivery Market by Country, 2022-2032 (USD Bn, AGR (%), CAGR(%))
Table 74 Europe Nanotechnology in Drug Delivery Market by Country, 2022-2032 (USD Bn, AGR (%), CAGR(%)) (V-Shaped Recovery Scenario)
Table 75 Europe Nanotechnology in Drug Delivery Market by Country, 2022-2032 (USD Bn, AGR (%), CAGR(%)) (W-Shaped Recovery Scenario)
Table 76 Europe Nanotechnology in Drug Delivery Market by Country, 2022-2032 (USD Bn, AGR (%), CAGR(%)) (U-Shaped Recovery Scenario)
Table 77 Europe Nanotechnology in Drug Delivery Market by Country, 2022-2032 (USD Bn, AGR (%), CAGR(%)) (L-Shaped Recovery Scenario)
Table 78 Europe Nanotechnology in Drug Delivery Market by Technology, 2022-2032 (USD Bn, AGR (%), CAGR(%))
Table 79 Europe Nanotechnology in Drug Delivery Market by Technology, 2022-2032 (USD Bn, AGR (%), CAGR(%)) (V-Shaped Recovery Scenario)
Table 80 Europe Nanotechnology in Drug Delivery Market by Technology, 2022-2032 (USD Bn, AGR (%), CAGR(%)) (W-Shaped Recovery Scenario)
Table 81 Europe Nanotechnology in Drug Delivery Market by Technology, 2022-2032 (USD Bn, AGR (%), CAGR(%)) (U-Shaped Recovery Scenario)
Table 82 Europe Nanotechnology in Drug Delivery Market by Technology, 2022-2032 (USD Bn, AGR (%), CAGR(%)) (L-Shaped Recovery Scenario)
Table 83 Europe Nanotechnology in Drug Delivery Market by Application, 2022-2032 (USD Bn, AGR (%), CAGR(%))
Table 84 Europe Nanotechnology in Drug Delivery Market by Application, 2022-2032 (USD Bn, AGR (%), CAGR(%)) (V-Shaped Recovery Scenario)
Table 85 Europe Nanotechnology in Drug Delivery Market by Application, 2022-2032 (USD Bn, AGR (%), CAGR(%)) (W-Shaped Recovery Scenario)
Table 86 Europe Nanotechnology in Drug Delivery Market by Application, 2022-2032 (USD Bn, AGR (%), CAGR(%)) (U-Shaped Recovery Scenario)
Table 87 Europe Nanotechnology in Drug Delivery Market by Application, 2022-2032 (USD Bn, AGR (%), CAGR(%)) (L-Shaped Recovery Scenario)
Table 88 Europe Nanotechnology in Drug Delivery Market by Nanoparticles, 2022-2032 (USD Bn, AGR (%), CAGR(%))
Table 89 Europe Nanotechnology in Drug Delivery Market by Nanoparticles, 2022-2032 (USD Bn, AGR (%), CAGR(%)) (V-Shaped Recovery Scenario)
Table 90 Europe Nanotechnology in Drug Delivery Market by Nanoparticles, 2022-2032 (USD Bn, AGR (%), CAGR(%)) (W-Shaped Recovery Scenario)
Table 91 Europe Nanotechnology in Drug Delivery Market by Nanoparticles, 2022-2032 (USD Bn, AGR (%), CAGR(%)) (U-Shaped Recovery Scenario)
Table 92 Europe Nanotechnology in Drug Delivery Market by Nanoparticles, 2022-2032 (USD Bn, AGR (%), CAGR(%)) (L-Shaped Recovery Scenario)
Table 93 Germany Nanotechnology in Drug Delivery Market by Value, 2022-2032 (USD Bn, AGR (%), CAGR(%))
Table 94 Germany Nanotechnology in Drug Delivery Market by Value, 2022-2032 (USD Bn, AGR (%), CAGR(%)) (V-Shaped Recovery Scenario)
Table 95 Germany Nanotechnology in Drug Delivery Market by Value, 2022-2032 (USD Bn, AGR (%), CAGR(%)) (W-Shaped Recovery Scenario)
Table 96 Germany Nanotechnology in Drug Delivery Market by Value, 2022-2032 (USD Bn, AGR (%), CAGR(%)) (U-Shaped Recovery Scenario)
Table 97 Germany Nanotechnology in Drug Delivery Market by Value, 2022-2032 (USD Bn, AGR (%), CAGR(%)) (L-Shaped Recovery Scenario)
Table 98 UK Nanotechnology in Drug Delivery Market by Value, 2022-2032 (USD Bn, AGR (%), CAGR(%))
Table 99 UK Nanotechnology in Drug Delivery Market by Value, 2022-2032 (USD Bn, AGR (%), CAGR(%)) (V-Shaped Recovery Scenario)
Table 100 UK Nanotechnology in Drug Delivery Market by Value, 2022-2032 (USD Bn, AGR (%), CAGR(%)) (W-Shaped Recovery Scenario)
Table 101 UK Nanotechnology in Drug Delivery Market by Value, 2022-2032 (USD Bn, AGR (%), CAGR(%)) (U-Shaped Recovery Scenario)
Table 102 UK Nanotechnology in Drug Delivery Market by Value, 2022-2032 (USD Bn, AGR (%), CAGR(%)) (L-Shaped Recovery Scenario)
Table 103 France Nanotechnology in Drug Delivery Market by Value, 2022-2032 (USD Bn, AGR (%), CAGR(%))
Table 104 France Nanotechnology in Drug Delivery Market by Value, 2022-2032 (USD Bn, AGR (%), CAGR(%)) (V-Shaped Recovery Scenario)
Table 105 France Nanotechnology in Drug Delivery Market by Value, 2022-2032 (USD Bn, AGR (%), CAGR(%)) (W-Shaped Recovery Scenario)
Table 106 France Nanotechnology in Drug Delivery Market by Value, 2022-2032 (USD Bn, AGR (%), CAGR(%)) (U-Shaped Recovery Scenario)
Table 107 France Nanotechnology in Drug Delivery Market by Value, 2022-2032 (USD Bn, AGR (%), CAGR(%)) (L-Shaped Recovery Scenario)
Table 108 Italy Nanotechnology in Drug Delivery Market by Value, 2022-2032 (USD Bn, AGR (%), CAGR(%))
Table 109 Italy Nanotechnology in Drug Delivery Market by Value, 2022-2032 (USD Bn, AGR (%), CAGR(%)) (V-Shaped Recovery Scenario)
Table 110 Italy Nanotechnology in Drug Delivery Market by Value, 2022-2032 (USD Bn, AGR (%), CAGR(%)) (W-Shaped Recovery Scenario)
Table 111 Italy Nanotechnology in Drug Delivery Market by Value, 2022-2032 (USD Bn, AGR (%), CAGR(%)) (U-Shaped Recovery Scenario)
Table 112 Italy Nanotechnology in Drug Delivery Market by Value, 2022-2032 (USD Bn, AGR (%), CAGR(%)) (L-Shaped Recovery Scenario)
Table 113 Spain Nanotechnology in Drug Delivery Market by Value, 2022-2032 (USD Bn, AGR (%), CAGR(%))
Table 114 Spain Nanotechnology in Drug Delivery Market by Value, 2022-2032 (USD Bn, AGR (%), CAGR(%)) (V-Shaped Recovery Scenario)
Table 115 Spain Nanotechnology in Drug Delivery Market by Value, 2022-2032 (USD Bn, AGR (%), CAGR(%)) (W-Shaped Recovery Scenario)
Table 116 Spain Nanotechnology in Drug Delivery Market by Value, 2022-2032 (USD Bn, AGR (%), CAGR(%)) (U-Shaped Recovery Scenario)
Table 117 Spain Nanotechnology in Drug Delivery Market by Value, 2022-2032 (USD Bn, AGR (%), CAGR(%)) (L-Shaped Recovery Scenario)
Table 118 Rest of Europe Nanotechnology in Drug Delivery Market by Value, 2022-2032 (USD Bn, AGR (%), CAGR(%))
Table 119 Rest of Europe Nanotechnology in Drug Delivery Market by Value, 2022-2032 (USD Bn, AGR (%), CAGR(%)) (V-Shaped Recovery Scenario)
Table 120 Rest of Europe Nanotechnology in Drug Delivery Market by Value, 2022-2032 (USD Bn, AGR (%), CAGR(%)) (W-Shaped Recovery Scenario)
Table 121 Rest of Europe Nanotechnology in Drug Delivery Market by Value, 2022-2032 (USD Bn, AGR (%), CAGR(%)) (U-Shaped Recovery Scenario)
Table 122 Rest of Europe Nanotechnology in Drug Delivery Market by Value, 2022-2032 (USD Bn, AGR (%), CAGR(%)) (L-Shaped Recovery Scenario)
Table 123 Asia-Pacific Nanotechnology in Drug Delivery Market by Value, 2022-2032 (USD Bn, AGR (%), CAGR(%))
Table 124 Asia-Pacific Nanotechnology in Drug Delivery Market by Value, 2022-2032 (USD Bn, AGR (%), CAGR(%)) (V-Shaped Recovery Scenario)
Table 125 Asia-Pacific Nanotechnology in Drug Delivery Market by Value, 2022-2032 (USD Bn, AGR (%), CAGR(%)) (W-Shape recovery)
Table 126 Asia-Pacific Nanotechnology in Drug Delivery Market by Value, 2022-2032 (USD Bn, AGR (%), CAGR(%)) (U-Shaped Recovery Scenario)
Table 127 Asia-Pacific Nanotechnology in Drug Delivery Market by Value, 2022-2032 (USD Bn, AGR (%), CAGR(%)) (L-Shaped Recovery Scenario)
Table 128 Asia-Pacific Nanotechnology in Drug Delivery Market by Country, 2022-2032 (USD Bn, AGR (%), CAGR(%))
Table 129 Asia-Pacific Nanotechnology in Drug Delivery Market by Country, 2022-2032 (USD Bn, AGR (%), CAGR(%)) (V-Shaped Recovery Scenario)
Table 130 Asia-Pacific Nanotechnology in Drug Delivery Market by Country, 2022-2032 (USD Bn, AGR (%), CAGR(%)) (W-Shape recovery)
Table 131 Asia-Pacific Nanotechnology in Drug Delivery Market by Country, 2022-2032 (USD Bn, AGR (%), CAGR(%)) (U-Shaped Recovery Scenario)
Table 132 Asia-Pacific Nanotechnology in Drug Delivery Market by Country, 2022-2032 (USD Bn, AGR (%), CAGR(%)) (L-Shaped Recovery Scenario)
Table 133 Asia-Pacific Nanotechnology in Drug Delivery Market by Technology, 2022-2032 (USD Bn, AGR (%), CAGR(%))
Table 134 Asia-Pacific Nanotechnology in Drug Delivery Market by Technology, 2022-2032 (USD Bn, AGR (%), CAGR(%)) (V-Shaped Recovery Scenario)
Table 135 Asia-Pacific Nanotechnology in Drug Delivery Market by Technology, 2022-2032 (USD Bn, AGR (%), CAGR(%)) (W-Shape recovery)
Table 136 Asia-Pacific Nanotechnology in Drug Delivery Market by Technology, 2022-2032 (USD Bn, AGR (%), CAGR(%)) (U-Shaped Recovery Scenario)
Table 137 Asia-Pacific Nanotechnology in Drug Delivery Market by Technology, 2022-2032 (USD Bn, AGR (%), CAGR(%)) (L-Shaped Recovery Scenario)
Table 138 Asia-Pacific Nanotechnology in Drug Delivery Market by Application, 2022-2032 (USD Bn, AGR (%), CAGR(%))
Table 139 Asia-Pacific Nanotechnology in Drug Delivery Market by Application, 2022-2032 (USD Bn, AGR (%), CAGR(%)) (V-Shaped Recovery Scenario)
Table 140 Asia-Pacific Nanotechnology in Drug Delivery Market by Application, 2022-2032 (USD Bn, AGR (%), CAGR(%)) (W-Shape recovery)
Table 141 Asia-Pacific Nanotechnology in Drug Delivery Market by Application, 2022-2032 (USD Bn, AGR (%), CAGR(%)) (U-Shaped Recovery Scenario)
Table 142 Asia-Pacific Nanotechnology in Drug Delivery Market by Application, 2022-2032 (USD Bn, AGR (%), CAGR(%)) (L-Shaped Recovery Scenario)
Table 143 Asia-Pacific Nanotechnology in Drug Delivery Market by Nanoparticles, 2022-2032 (USD Bn, AGR (%), CAGR(%))
Table 144 Asia-Pacific Nanotechnology in Drug Delivery Market by Nanoparticles, 2022-2032 (USD Bn, AGR (%), CAGR(%)) (V-Shaped Recovery Scenario)
Table 145 Asia-Pacific Nanotechnology in Drug Delivery Market by Nanoparticles, 2022-2032 (USD Bn, AGR (%), CAGR(%)) (W-Shape recovery)
Table 146 Asia-Pacific Nanotechnology in Drug Delivery Market by Nanoparticles, 2022-2032 (USD Bn, AGR (%), CAGR(%)) (U-Shaped Recovery Scenario)
Table 147 Asia-Pacific Nanotechnology in Drug Delivery Market by Nanoparticles, 2022-2032 (USD Bn, AGR (%), CAGR(%)) (L-Shaped Recovery Scenario)
Table 148 China Nanotechnology in Drug Delivery Market by Value, 2022-2032 (USD Bn, AGR (%), CAGR(%))
Table 149 China Nanotechnology in Drug Delivery Market by Value, 2022-2032 (USD Bn, AGR (%), CAGR(%)) (V-Shaped Recovery Scenario)
Table 150 China Nanotechnology in Drug Delivery Market by Value, 2022-2032 (USD Bn, AGR (%), CAGR(%)) (W-Shaped Recovery Scenario)
Table 151 China Nanotechnology in Drug Delivery Market by Value, 2022-2032 (USD Bn, AGR (%), CAGR(%)) (U-Shaped Recovery Scenario)
Table 152 China Nanotechnology in Drug Delivery Market by Value, 2022-2032 (USD Bn, AGR (%), CAGR(%)) (L-Shaped Recovery Scenario)
Table 153 India Nanotechnology in Drug Delivery Market by Value, 2022-2032 (USD Bn, AGR (%), CAGR(%))
Table 154 India Nanotechnology in Drug Delivery Market by Value, 2022-2032 (USD Bn, AGR (%), CAGR(%)) (V-Shaped Recovery Scenario)
Table 155 India Nanotechnology in Drug Delivery Market by Value, 2022-2032 (USD Bn, AGR (%), CAGR(%)) (W-Shaped Recovery Scenario)
Table 156 India Nanotechnology in Drug Delivery Market by Value, 2022-2032 (USD Bn, AGR (%), CAGR(%)) (U-Shaped Recovery Scenario)
Table 157 India Nanotechnology in Drug Delivery Market by Value, 2022-2032 (USD Bn, AGR (%), CAGR(%)) (L-Shaped Recovery Scenario)
Table 158 Japan Nanotechnology in Drug Delivery Market by Value, 2022-2032 (USD Bn, AGR (%), CAGR(%))
Table 159 Japan Nanotechnology in Drug Delivery Market by Value, 2022-2032 (USD Bn, AGR (%), CAGR(%)) (V-Shaped Recovery Scenario)
Table 160 Japan Nanotechnology in Drug Delivery Market by Value, 2022-2032 (USD Bn, AGR (%), CAGR(%)) (W-Shaped Recovery Scenario)
Table 161 Japan Nanotechnology in Drug Delivery Market by Value, 2022-2032 (USD Bn, AGR (%), CAGR(%)) (U-Shaped Recovery Scenario)
Table 162 Japan Nanotechnology in Drug Delivery Market by Value, 2022-2032 (USD Bn, AGR (%), CAGR(%)) (L-Shaped Recovery Scenario)
Table 163 South Korea Nanotechnology in Drug Delivery Market by Value, 2022-2032 (USD Bn, AGR (%), CAGR(%))
Table 164 South Korea Nanotechnology in Drug Delivery Market by Value, 2022-2032 (USD Bn, AGR (%), CAGR(%)) (V-Shaped Recovery Scenario)
Table 165 South Korea Nanotechnology in Drug Delivery Market by Value, 2022-2032 (USD Bn, AGR (%), CAGR(%)) (W-Shaped Recovery Scenario)
Table 166 South Korea Nanotechnology in Drug Delivery Market by Value, 2022-2032 (USD Bn, AGR (%), CAGR(%)) (U-Shaped Recovery Scenario)
Table 167 South Korea Nanotechnology in Drug Delivery Market by Value, 2022-2032 (USD Bn, AGR (%), CAGR(%)) (L-Shaped Recovery Scenario)
Table 168 Australia Nanotechnology in Drug Delivery Market by Value, 2022-2032 (USD Bn, AGR (%), CAGR(%))
Table 169 Australia Nanotechnology in Drug Delivery Market by Value, 2022-2032 (USD Bn, AGR (%), CAGR(%)) (V-Shaped Recovery Scenario)
Table 170 Australia Nanotechnology in Drug Delivery Market by Value, 2022-2032 (USD Bn, AGR (%), CAGR(%)) (W-Shaped Recovery Scenario)
Table 171 Australia Nanotechnology in Drug Delivery Market by Value, 2022-2032 (USD Bn, AGR (%), CAGR(%)) (U-Shaped Recovery Scenario)
Table 172 Australia Nanotechnology in Drug Delivery Market by Value, 2022-2032 (USD Bn, AGR (%), CAGR(%)) (L-Shaped Recovery Scenario)
Table 173 Rest of Asia-Pacific Nanotechnology in Drug Delivery Market by Value, 2022-2032 (USD Bn, AGR (%), CAGR(%))
Table 174 Rest of Asia-Pacific Nanotechnology in Drug Delivery Market by Value, 2022-2032 (USD Bn, AGR (%), CAGR(%)) (V-Shaped Recovery Scenario)
Table 175 Rest of Asia-Pacific Nanotechnology in Drug Delivery Market by Value, 2022-2032 (USD Bn, AGR (%), CAGR(%)) (W-Shaped Recovery Scenario)
Table 176 Rest of Asia-Pacific Nanotechnology in Drug Delivery Market by Value, 2022-2032 (USD Bn, AGR (%), CAGR(%)) (U-Shaped Recovery Scenario)
Table 177 Rest of Asia-Pacific Nanotechnology in Drug Delivery Market by Value, 2022-2032 (USD Bn, AGR (%), CAGR(%)) (L-Shaped Recovery Scenario)
Table 178 LAMEA Nanotechnology in Drug Delivery Market by Value, 2022-2032 (USD Bn, AGR (%), CAGR(%))
Table 179 LAMEA Nanotechnology in Drug Delivery Market by Value, 2022-2032 (USD Bn, AGR (%), CAGR(%)) (V-Shaped Recovery Scenario)
Table 180 LAMEA Nanotechnology in Drug Delivery Market by Value, 2022-2032 (USD Bn, AGR (%), CAGR(%)) (W-Shaped Recovery Scenario)
Table 181 LAMEA Nanotechnology in Drug Delivery Market by Value, 2022-2032 (USD Bn, AGR (%), CAGR(%)) (U-Shaped Recovery Scenario)
Table 182 LAMEA Nanotechnology in Drug Delivery Market by Value, 2022-2032 (USD Bn, AGR (%), CAGR(%)) (L-Shaped Recovery Scenario)
Table 183 LAMEA Nanotechnology in Drug Delivery Market by Country, 2022-2032 (USD Bn, AGR (%), CAGR(%))
Table 184 LAMEA Nanotechnology in Drug Delivery Market by Country, 2022-2032 (USD Bn, AGR (%), CAGR(%)) (V-Shaped Recovery Scenario)
Table 185 LAMEA Nanotechnology in Drug Delivery Market by Country, 2022-2032 (USD Bn, AGR (%), CAGR(%)) (W-Shaped Recovery Scenario)
Table 186 LAMEA Nanotechnology in Drug Delivery Market by Country, 2022-2032 (USD Bn, AGR (%), CAGR(%)) (U-Shaped Recovery Scenario)
Table 187 LAMEA Nanotechnology in Drug Delivery Market by Country, 2022-2032 (USD Bn, AGR (%), CAGR(%)) (L-Shaped Recovery Scenario)
Table 188 LAMEA Nanotechnology in Drug Delivery Market by Technology, 2022-2032 (USD Bn, AGR (%), CAGR(%))
Table 189 LAMEA Nanotechnology in Drug Delivery Market by Technology, 2022-2032 (USD Bn, AGR (%), CAGR(%)) (V-Shaped Recovery Scenario)
Table 190 LAMEA Nanotechnology in Drug Delivery Market by Technology, 2022-2032 (USD Bn, AGR (%), CAGR(%)) (W-Shaped Recovery Scenario)
Table 191 LAMEA Nanotechnology in Drug Delivery Market by Technology, 2022-2032 (USD Bn, AGR (%), CAGR(%)) (U-Shaped Recovery Scenario)
Table 192 LAMEA Nanotechnology in Drug Delivery Market by Technology, 2022-2032 (USD Bn, AGR (%), CAGR(%)) (L-Shaped Recovery Scenario)
Table 193 LAMEA Nanotechnology in Drug Delivery Market by Application, 2022-2032 (USD Bn, AGR (%), CAGR(%))
Table 194 LAMEA Nanotechnology in Drug Delivery Market by Application, 2022-2032 (USD Bn, AGR (%), CAGR(%)) (V-Shaped Recovery Scenario)
Table 195 LAMEA Nanotechnology in Drug Delivery Market by Application, 2022-2032 (USD Bn, AGR (%), CAGR(%)) (W-Shaped Recovery Scenario)
Table 196 LAMEA Nanotechnology in Drug Delivery Market by Application, 2022-2032 (USD Bn, AGR (%), CAGR(%)) (U-Shaped Recovery Scenario)
Table 197 LAMEA Nanotechnology in Drug Delivery Market by Application, 2022-2032 (USD Bn, AGR (%), CAGR(%)) (L-Shaped Recovery Scenario)
Table 198 LAMEA Nanotechnology in Drug Delivery Market by Nanoparticles, 2022-2032 (USD Bn, AGR (%), CAGR(%))
Table 199 LAMEA Nanotechnology in Drug Delivery Market by Nanoparticles, 2022-2032 (USD Bn, AGR (%), CAGR(%)) (V-Shaped Recovery Scenario)
Table 200 LAMEA Nanotechnology in Drug Delivery Market by Nanoparticles, 2022-2032 (USD Bn, AGR (%), CAGR(%)) (W-Shaped Recovery Scenario)
Table 201 LAMEA Nanotechnology in Drug Delivery Market by Nanoparticles, 2022-2032 (USD Bn, AGR (%), CAGR(%)) (U-Shaped Recovery Scenario)
Table 202 LAMEA Nanotechnology in Drug Delivery Market by Nanoparticles, 2022-2032 (USD Bn, AGR (%), CAGR(%)) (L-Shaped Recovery Scenario)
Table 203 Brazil Nanotechnology in Drug Delivery Market by Value, 2022-2032 (USD Bn, AGR (%), CAGR(%))
Table 204 Brazil Nanotechnology in Drug Delivery Market by Value, 2022-2032 (USD Bn, AGR (%), CAGR(%)) (V-Shaped Recovery Scenario)
Table 205 Brazil Nanotechnology in Drug Delivery Market by Value, 2022-2032 (USD Bn, AGR (%), CAGR(%)) (W-Shaped Recovery Scenario)
Table 206 Brazil Nanotechnology in Drug Delivery Market by Value, 2022-2032 (USD Bn, AGR (%), CAGR(%)) (U-Shaped Recovery Scenario)
Table 207 Brazil Nanotechnology in Drug Delivery Market by Value, 2022-2032 (USD Bn, AGR (%), CAGR(%)) (L-Shaped Recovery Scenario)
Table 208 South Africa Nanotechnology in Drug Delivery Market by Value, 2022-2032 (USD Bn, AGR (%), CAGR(%))
Table 209 South Africa Nanotechnology in Drug Delivery Market by Value, 2022-2032 (USD Bn, AGR (%), CAGR(%)) (V-Shaped Recovery Scenario)
Table 210 South Africa Nanotechnology in Drug Delivery Market by Value, 2022-2032 (USD Bn, AGR (%), CAGR(%)) (W-Shaped Recovery Scenario)
Table 211 South Africa Nanotechnology in Drug Delivery Market by Value, 2022-2032 (USD Bn, AGR (%), CAGR(%)) (U-Shaped Recovery Scenario)
Table 212 South Africa Nanotechnology in Drug Delivery Market by Value, 2022-2032 (USD Bn, AGR (%), CAGR(%)) (L-Shaped Recovery Scenario)
Table 213 Saudi Arabia Nanotechnology in Drug Delivery Market by Value, 2022-2032 (USD Bn, AGR (%), CAGR(%))
Table 214 Saudi Arabia Nanotechnology in Drug Delivery Market by Value, 2022-2032 (USD Bn, AGR (%), CAGR(%)) (V-Shaped Recovery Scenario)
Table 215 Saudi Arabia Nanotechnology in Drug Delivery Market by Value, 2022-2032 (USD Bn, AGR (%), CAGR(%)) (W-Shaped Recovery Scenario)
Table 216 Saudi Arabia Nanotechnology in Drug Delivery Market by Value, 2022-2032 (USD Bn, AGR (%), CAGR(%)) (U-Shaped Recovery Scenario)
Table 217 Saudi Arabia Nanotechnology in Drug Delivery Market by Value, 2022-2032 (USD Bn, AGR (%), CAGR(%)) (L-Shaped Recovery Scenario)
Table 218 Turkey Nanotechnology in Drug Delivery Market by Value, 2022-2032 (USD Bn, AGR (%), CAGR(%))
Table 219 Turkey Nanotechnology in Drug Delivery Market by Value, 2022-2032 (USD Bn, AGR (%), CAGR(%)) (V-Shaped Recovery Scenario)
Table 220 Turkey Nanotechnology in Drug Delivery Market by Value, 2022-2032 (USD Bn, AGR (%), CAGR(%)) (W-Shaped Recovery Scenario)
Table 221 Turkey Nanotechnology in Drug Delivery Market by Value, 2022-2032 (USD Bn, AGR (%), CAGR(%)) (U-Shaped Recovery Scenario)
Table 222 Turkey Nanotechnology in Drug Delivery Market by Value, 2022-2032 (USD Bn, AGR (%), CAGR(%)) (L-Shaped Recovery Scenario)
Table 223 UAE Nanotechnology in Drug Delivery Market by Value, 2022-2032 (USD Bn, AGR (%), CAGR(%))
Table 224 UAE Nanotechnology in Drug Delivery Market by Value, 2022-2032 (USD Bn, AGR (%), CAGR(%)) (V-Shaped Recovery Scenario)
Table 225 UAE Nanotechnology in Drug Delivery Market by Value, 2022-2032 (USD Bn, AGR (%), CAGR(%)) (W-Shaped Recovery Scenario)
Table 226 UAE Nanotechnology in Drug Delivery Market by Value, 2022-2032 (USD Bn, AGR (%), CAGR(%)) (U-Shaped Recovery Scenario)
Table 227 UAE Nanotechnology in Drug Delivery Market by Value, 2022-2032 (USD Bn, AGR (%), CAGR(%)) (L-Shaped Recovery Scenario)
Table 228 Rest of LAMEA Nanotechnology in Drug Delivery Market by Value, 2022-2032 (USD Bn, AGR (%), CAGR(%))
Table 229 Rest of LAMEA Nanotechnology in Drug Delivery Market by Value, 2022-2032 (USD Bn, AGR (%), CAGR(%)) (V-Shaped Recovery Scenario)
Table 230 Rest of LAMEA Nanotechnology in Drug Delivery Market by Value, 2022-2032 (USD Bn, AGR (%), CAGR(%)) (W-Shaped Recovery Scenario)
Table 231 Rest of LAMEA Nanotechnology in Drug Delivery Market by Value, 2022-2032 (USD Bn, AGR (%), CAGR(%)) (U-Shaped Recovery Scenario)
Table 232 Rest of LAMEA Nanotechnology in Drug Delivery Market by Value, 2022-2032 (USD Bn, AGR (%), CAGR(%)) (L-Shaped Recovery Scenario)
Table 233 Merck & Co Inc: Company Information
Table 234 Merck & Co Inc: Company Revenue 2017-2021 (US$Mn, AGR %)
Table 235 Merck & Co Inc.: Company Product and Service Benchmarking
Table 236 Merck & Co Inc: Company Recent Developments
Table 237 Bayer AG: Company Information
Table 238 Bayer AG: Company Revenue 2017-2021 (US$Mn, AGR %)
Table 239 Bayer AG: Company Product and Service Benchmarking
Table 240 Bayer AG: Company Recent Developments
Table 241 Amgen Inc: Company Information
Table 242 Amgen Inc: Company Revenue 2017-2021 (US$Mn, AGR %)
Table 243 Amgen Inc.: Company Product and Service Benchmarking
Table 244 Amgen Inc: Company Recent Developments
Table 245 Pfizer Inc: Company Information
Table 246 Pfizer Inc: Company Revenue 2017-2021 (US$Mn, AGR %)
Table 247 Pfizer Inc.: Company Product and Service Benchmarking
Table 248 Pfizer Inc: Company Recent Developments
Table 249 Novartis AG: Company Information
Table 250 Novartis AG: Company Revenue 2017-2021 (US$Mn, AGR %)
Table 251 Novartis AG.Company Product and Service Benchmarking
Table 252 Novartis AG: Company Recent Developments
Table 253 AbbVie Inc: Company Information
Table 254 AbbVie Inc: Company Revenue 2017-2021 (US$Mn, AGR %)
Table 255 AbbVie Inc.: Company Product and Service Benchmarking
Table 256 AbbVie Inc: Company Recent Developments
Table 257 Roche Holding AG: Company Information
Table 258 Roche Holding AG: Company Revenue 2017-2021 (US$Mn, AGR %)
Table 259 Roche Holding AG.: Company Product and Service Benchmarking
Table 260 Roche Holding AG: Company Recent Developments
Table 261 Johnson & Johnson: Company Information
Table 262 Johnson & Johnson: Company Revenue 2017-2021 (US$Mn, AGR %)
Table 263 Johnson & Johnson: Company Product and Service Benchmarking
Table 264 Johnson & Johnson: Company Recent Developments
Table 265 Glaxo SmithKline plc: Company Information
Table 266 Glaxo SmithKline plc: Company Revenue 2017-2021 (US$Mn, AGR %)
Table 267 Glaxo SmithKline plc: Company Product and Service Benchmarking
Table 268 Glaxo SmithKline plc: Company Recent Developments
Table 269 Sanofi SA: Company Information
Table 270 Sanofi SA: Company Revenue 2017-2021 (US$Mn, AGR %)
Table 271 Sanofi SA: Company Product and Service Benchmarking
Table 272 Sanofi SA: Company Recent Developments
Table 273 Celgene Inc: Key Details, (CEO, HQ, Revenue, Founded, No. of Employees, Company Type, Website, Business Segment)
Table 274 Celgene Inc: Product Benchmarking
Table 275 Celgene Inc: Strategic Outlook
Table 276 Aquanova AG: Key Details, (CEO, HQ, Revenue, Founded, No. of Employees, Company Type, Website, Business Segment)
Table 277 Aquanova AG: Product Benchmarking
Table 278 Cytimmune Sciences Inc: Key Details, (CEO, HQ, Revenue, Founded, No. of Employees, Company Type, Website, Business Segment)
Table 279 Cytimmune Sciences Inc: Product Benchmarking
Table 280 Cytimmune Sciences Inc: Strategic Outlook
Table 281 Nanpbiotix: Key Details, (CEO, HQ, Revenue, Founded, No. of Employees, Company Type, Website, Business Segment)
Table 282 Nanobiotix: Product Benchmarking
Table 283 Nanobiotix: Strategic Outlook
Table 284 Nanocarrier Co Ltd: Key Details, (CEO, HQ, Revenue, Founded, No. of Employees, Company Type, Website, Business Segment)
Table 285 Nanocarrier Co Ltd: Product Benchmarking
Table 286 Nanocarrier Co Ltd: Strategic Outlook
Table 287 NanOlogy LLC: Key Details, (CEO, HQ, Revenue, Founded, No. of Employees, Company Type, Website, Business Segment)
Table 288 NanOlogy LLC: Product Benchmarking
Table 289 NanOlogy LLC: Strategic Outlook
Table 290 Taiwan Liposome Co.: Key Details, (CEO, HQ, Revenue, Founded, No. of Employees, Company Type, Website, Business Segment)
Table 291 Taiwan Liposome Co.: Product Benchmarking
Table 292 Taiwan Liposome Co.: Strategic Outlook
Table 293 Tarveda Therapeutics: Key Details, (CEO, HQ, Revenue, Founded, No. of Employees, Company Type, Website, Business Segment)
Table 294 Tarveda Therapeutics: Product Benchmarking
Table 295 Tarveda Therapeutics: Strategic Outlook
Table 296 Camarus AB: Key Details, (CEO, HQ, Revenue, Founded, No. of Employees, Company Type, Website, Business Segment)
Table 297 Camarus AB: Product Benchmarking
Table 298 Camarus AB: Strategic Outlook
Table 299 Selecta Biosciences: Key Details, (CEO, HQ, Revenue, Founded, No. of Employees, Company Type, Website, Business Segment)
Table 300 Selecta Biosciences: Product Benchmarking
Table 301 Selecta Biosciences: Strategic Outlook
Table 302 Starpharma Holdings Limited: Key Details, (CEO, HQ, Revenue, Founded, No. of Employees, Company Type, Website, Business Segment)
Table 303 Starpharma Holdings Limited: Product Benchmarking
Table 304 Starpharma Holdings Limited: Strategic Outlook
AbbVie Inc. (AbbVie)
Amgen Inc.
Aquanova AG
Bayer AG
Camarus AB
Celgene Corporation
Cytimmune Sciences
GlaxoSmithKline PLC
Johnson & Johnson
Merck & Co., Inc.
Nanobiotix
NanoCarrier Co, Ltd
NanOlogy LLC
Novartis AG
Pfizer Inc.
Roche Holding AG (Roche)
Sanofi SA
Selecta Biosciences Inc.
Starpharma Holdings Limited
Taiwan Liposome Co.
Tarveda Therapeutics
List of Other Companies Mentioned in the report
AbbVie Inc.
Alexion Pharmaceuticals Inc
AstraZeneca PLC
Biomarin Pharmaceutical Inc.
Bristol-Myers Squibb Co
Chugai Pharmaceutical Co Ltd
Codexis, Inc.
Cyrus Biotechnology, Inc.
Creative Enzymes
CSL Ltd
Eisai Co Ltd
Eurofins Scientific
Grifols SA
Kyowa Hakko Kirin Co Ltd
Merck & Co Inc.
Mitsubishi Tanabe Pharma Corp
Novo Nordisk A/S
Perrigo Company PLC
Shire PLC
Takeda Pharmaceutical Co Ltd
Taisho Pharmaceutical Holdings Co Ltd
Sumitomo Dainippon Pharma Co Ltd
List of Associations Mentioned in the Report
Centre for Pharmaceutical Administration Health Sciences Authority
Central Drug Standard Control Organization (CDSCO)
European Medicines Agency (EMA)
Food and Drug Administration (FDA)
Indian Council of Medical Research (ICMR)
Ministry of Health, Labour & Welfare(MHLW)
Medicines and Healthcare Products Regulatory Agency (MHRA)
National Institutes of Health (NIH)
Organisation for Economic Co-operation and Development (OECD)
Pharmaceuticals and Medical Devices Agency (PMDA)
Statistical Office of the European Union (EUROSTAT)
The Therapeutic Goods Administration
The Federal Institute for Drugs and Medical Devices (BfArM)
The National Medical Products Administration (NMPA)
United Nations (UN)
United Nations Office on Drugs and Crime (UNODC)
United Nations Statistics Division (UNSD)
University of Connecticut
World Health Organization (WHO)
Download sample pages
Complete the form below to download your free sample pages for Nanotechnology in Drug Delivery Market Report 2022-2032Related reports
-
Topical Drug Delivery Market Report 2022-2032
Some of the factors driving the market growth are the increasing prevalence of skin and eye diseases, high incidences of...Full DetailsPublished: 26 January 2022 -

Contract Manufacturing Outsourcing (CMO) of Sterile Injectable Drugs Market Report 2021-2031
Contract manufacturing outsourcing is gaining attraction owing to growing trend of outsourcing among pharmaceutical businesses. ...Full DetailsPublished: 16 November 2021 -
Drug Discovery Informatics Market Report 2021-2031
High performance HPC and supercomputing technology have evolved substantially in China in the last decades, leading to extraordinary accomplishments. HPC-based...Full DetailsPublished: 07 October 2021 -
Nasal Drug Delivery Technology Market Report 2022-2032
The nasal drug delivery market will expand rapidly due to rising patient preference for nasal medication delivery due to ease...Full DetailsPublished: 18 January 2022
Download sample pages
Complete the form below to download your free sample pages for Nanotechnology in Drug Delivery Market Report 2022-2032Do you have any custom requirements we can help you with?
Any specific country, geo region, market segment or specific company information?
Email us today, we can discuss your needs and see how we can help: jamie.roberts@visiongain.com
Would you like a free report overview of the report of your choice?
If so, please drop an email to Jamie Roberts stating your chosen report title to jamie.roberts@visiongain.com
Visiongain’s reports are based on comprehensive primary and secondary research. Those studies provide global market forecasts (sales by drug and class, with sub-markets and leading nations covered) and analyses of market drivers and restraints (including SWOT analysis) and current pipeline developments. To find out more about our reports methodology, please email jamie.roberts@visiongain.com
“Thank you for this Gene Therapy R&D Market report and for how easy the process was. Your colleague was very helpful and the report is just right for my purpose. This is the 2nd good report from Visiongain and a good price.”
Dr Luz Chapa Azuella, Mexico
American Association of Colleges of Pharmacy
American College of Clinical Pharmacy
American Pharmacists Association
American Society for Pharmacy Law
American Society of Consultant Pharmacists
American Society of Health-System Pharmacists
Association of Special Pharmaceutical Manufacturers
Australian College of Pharmacy
Biotechnology Industry Organization
Canadian Pharmacists Association
Canadian Society of Hospital Pharmacists
Chinese Pharmaceutical Association
College of Psychiatric and Neurologic Pharmacists
Danish Association of Pharmaconomists
European Association of Employed Community Pharmacists in Europe
European Medicines Agency
Federal Drugs Agency
General Medical Council
Head of Medicines Agency
International Federation of Pharmaceutical Manufacturers & Associations
International Pharmaceutical Federation
International Pharmaceutical Students’ Federation
Medicines and Healthcare Products Regulatory Agency
National Pharmacy Association
Norwegian Pharmacy Association
Ontario Pharmacists Association
Pakistan Pharmacists Association
Pharmaceutical Association of Mauritius
Pharmaceutical Group of the European Union
Pharmaceutical Society of Australia
Pharmaceutical Society of Ireland
Pharmaceutical Society Of New Zealand
Pharmaceutical Society of Northern Ireland
Professional Compounding Centers of America
Royal Pharmaceutical Society
The American Association of Pharmaceutical Scientists
The BioIndustry Association
The Controlled Release Society
The European Federation of Pharmaceutical Industries and Associations
The European Personalised Medicine Association
The Institute of Clinical Research
The International Society for Pharmaceutical Engineering
The Pharmaceutical Association of Israel
The Pharmaceutical Research and Manufacturers of America
The Pharmacy Guild of Australia
The Society of Hospital Pharmacists of Australia
Latest Pharma news
Visiongain Publishes Automation in Biopharma Industry Market Report 2024-2034
The global Automation in Biopharma Industry market is estimated at US$1,954.3 million in 2024 and is projected to grow at a CAGR of 7% during the forecast period 2024-2034.
17 April 2024
Visiongain Publishes Anti-obesity Drugs Market Report 2024-2034
The global Anti-obesity Drugs market is estimated at US$11,540.2 million in 2024 and is expected to register a CAGR of 21.2% from 2024 to 2034.
12 April 2024
Visiongain Publishes Inflammatory Bowel Diseases (IBD) Drugs Market Report 2024-2034
The global Inflammatory Bowel Diseases (IBD) Drugs market was valued at US$27.53 billion in 2023 and is projected to grow at a CAGR of 6.2% during the forecast period 2024-2034.
11 April 2024
Visiongain Publishes Female Health Tech Market Report 2024-2034
The global Female Health Tech market was estimated to be valued at US$ 140.9 billion in 2034 and is expected to register a CAGR of 9.6% from 2024 to 2034.
05 April 2024


