The Monoclonal Antibody Discovery and Analysis Market Report 2022-2032: This report will prove invaluable to leading firms striving for new revenue pockets if they wish to better understand the industry and its underlying dynamics. It will be useful for companies that would like to expand into different industries or to expand their existing operations in a new region.
Growing Demand for Monoclonal Antibodies for Cancer Treatments
Monoclonal antibodies have demonstrated anticancer efficacy in a variety of cancers, thus they are not necessary for cancer therapy. Most toxicities, including fever, nausea, fatigue, changes in blood pressure, and bronchospasm, are self-limiting. The efficacy and timeliness of antibody-based diagnostic tests for a variety of disorders have both been enhanced by monoclonal antibodies. Clinical studies for more than 250 therapeutic monoclonal antibodies are now being conducted. These antibodies are used to treat cancer, autoimmune disorders, infectious diseases, and transplant patients. Inadequate effector functions, immunogenicity, and problems with pharmacokinetics have all been addressed through chimerization and humanization. As of November 1, 2021, 11 antibody treatments had been given first clearance for usage in either the European Union or the United States: Therapeutic antibodies will unavoidably continue to be a key component of drug research for many years to come. Regardless of the particular path used to produce the next generation of monoclonal antibody therapies, this is true.
What Questions Should You Ask before Buying a Market Research Report?
• How is the monoclonal antibody discovery and analysis market evolving?
• What is driving and restraining the monoclonal antibody discovery and analysis market?
• How will each monoclonal antibody discovery and analysis submarket segment grow over the forecast period and how much revenue will these submarkets account for in 2032?
• How will the market shares for each monoclonal antibody discovery and analysis submarket develop from 2022 to 2032?
• What will be the main driver for the overall market from 2022 to 2032?
• Will leading monoclonal antibody discovery and analysis markets broadly follow the macroeconomic dynamics, or will individual national markets outperform others?
• How will the market shares of the national markets change by 2032 and which geographical region will lead the market in 2032?
• Who are the leading players and what are their prospects over the forecast period?
• What are the monoclonal antibody discovery and analysis projects for these leading companies?
• How will the industry evolve during the period between 2020 and 2032? What are the implications of monoclonal antibody discovery and analysis projects taking place now and over the next 10 years?
• Is there a greater need for product commercialisation to further scale the monoclonal antibody discovery and analysis market?
• Where is the monoclonal antibody discovery and analysis market heading and how can you ensure you are at the forefront of the market?
• What are the best investment options for new product and service lines?
• What are the key prospects for moving companies into a new growth path and C-suite?
You need to discover how this will impact the monoclonal antibody discovery and analysis market today, and over the next 10 years:
• Our 437-page report provides 168 tables and 183 charts/graphs exclusively to you.
• The report highlights key lucrative areas in the industry so you can target them – NOW.
• It contains in-depth analysis of global, regional and national sales and growth.
• It highlights for you the key successful trends, changes and revenue projections made by your competitors.
This report tells you TODAY how the monoclonal antibody discovery and analysis market will develop in the next 10 years, and in line with the variations in COVID-19 economic recession and bounce. This market is more critical now than at any point over the last 10 years.
Forecasts to 2032 and other analyses reveal commercial prospects
• In addition to revenue forecasting to 2032, our new study provides you with recent results, growth rates, and market shares.
• You will find original analyses, with business outlooks and developments.
• Discover qualitative analyses (including market dynamics, drivers, opportunities, restraints and challenges), cost structure, impact of rising monoclonal antibody discovery and analysis prices and recent developments.
This report includes data analysis and invaluable insight into how COVID-19 will affect the industry and your company. Four COVID-19 recovery patterns and their impact, namely, “V”, “L”, “W” and “U” are discussed in this report.
Segments Covered in the Report
Business Type
• Instruments Manufacturing
• Services & Solutions
• Ancillary Kits
Application
• Therapeutic Antibody Discovery
• Critical Reagent Antibody Discovery
• Biomarker and Diagnostic Antibody Discovery
• Research Antibody Discovery
Platform
• Hybridoma
• Humanization
• Phage Display
• Yeast Display
• Transgenic Rodents
Type
• Antigen Development
• Monoclonal Antibody Discovery
• Monoclonal Antibody Manufacturing
• Polyclonal Antibodies
• Label-free Kinetics Analysis
• Cell Banking

In addition to the revenue predictions for the overall world market and segments, you will also find revenue forecasts for four regional and 20 leading national markets:
North America
• U.S.
• Canada
Europe
• Germany
• Spain
• United Kingdom
• France
• Italy
• Rest of Europe
Asia Pacific
• China
• Japan
• India
• Australia
• South Korea
• Rest of Asia Pacific
Middle East & Africa
• Turkey
• Saudi Arabia
• South Africa
• Rest of Middle East & Africa
Latin America
• Brazil
• Mexico
• Rest of Latin America
Need industry data? Please contact us today.
The report also includes profiles and for some of the leading companies in the Monoclonal Antibody Discovery and Analysis Market, 2022 to 2032, with a focus on this segment of these companies’ operations.
Leading companies and the potential for market growth
• AbbVie Inc.
• Amgen Inc.
• Amneal Pharmaceutical LLC
• AstraZeneca
• Bayer AG
• BIOGEN
• Bristol- Myers Squibb company
• Eisai Co. Ltd
• Eli Lilly and Company
• F. Hoffman-La Roche Ltd.
• GlaxoSmithKline plc
• Johnson & Johnson Ltd.
• Lupin Limited
• Viatris Inc.
• Novartis AG
• Pfizer Inc.
• Regeneron Pharmaceuticals Inc.
• Sanofi S.A.
• Teva Pharmaceutical Industries Ltd.
• Zydus Lifesciences Limited
Overall world revenue for Monoclonal Antibody Discovery and Analysis Market, 2022 to 2032 in terms of value the market will surpass US$5,610 million in 2022, our work calculates. We predict strong revenue growth through to 2032. Our work identifies which organizations hold the greatest potential. Discover their capabilities, progress, and commercial prospects, helping you stay ahead.
How will the Monoclonal Antibody Discovery and Analysis Market, 2022 to 2032 report help you?
In summary, our 430+ page report provides you with the following knowledge:
• Revenue forecasts to 2032 for Monoclonal Antibody Discovery and Analysis Market, 2022 to 2032 Market, with forecasts for business type, platform, type, application and company size, each forecast at a global and regional level – discover the industry’s prospects, finding the most lucrative places for investments and revenues.
• Revenue forecasts to 2032 for four regional and 20 key national markets – See forecasts for the Monoclonal Antibody Discovery and Analysis Market, 2022 to 2032 market in North America, Europe, Asia-Pacific, Middle East & Africa and Latin America. Also forecasted is the market in the US, Canada, Mexico, Brazil, Germany, France, UK, Italy, China, India, Japan, and Australia among other prominent economies.
• Prospects for established firms and those seeking to enter the market – including company profiles for 20 of the major companies involved in the Monoclonal Antibody Discovery and Analysis Market, 2022 to 2032.
Find quantitative and qualitative analyses with independent predictions. Receive information that only our report contains, staying informed with invaluable business intelligence.
Information found nowhere else
With our new report, you are less likely to fall behind in knowledge or miss out on opportunities. See how our work could benefit your research, analyses, and decisions. Visiongain’s study is for everybody needing commercial analyses for the Monoclonal Antibody Discovery and Analysis Market, 2022 to 2032, market-leading companies. You will find data, trends and predictions.
To access the data contained in this document please email contactus@visiongain.com
Buy our report today Monoclonal Antibody Discovery and Analysis Market Report 2022-2032: Forecasts by Business Type (Instruments Manufacturing, Services & Solutions, Ancillary Kits), by Application (Therapeutic Antibody Discovery, Critical Reagent Antibody Discovery, Biomarker and Diagnostic Antibody Discovery, Research Antibody Discovery), by Platform (Hybridoma, Humanization, Phage Display, Yeast Display, Transgenic Rodents), by Type (Antigen Development, Monoclonal Antibody Discovery, Monoclonal Antibody Manufacturing, Polyclonal Antibodies, Label-free Kinetics Analysis, Cell Banking) AND Regional and Leading National Market Analysis PLUS Analysis of Leading Companies AND COVID-19 Impact and Recovery Pattern Analysis. Avoid missing out by staying informed – order our report now.
Visiongain is a trading partner with the US Federal Government
CCR Ref number: KD4R6
Do you have any custom requirements we can help you with? Any need for a specific country, geo region, market segment or specific company information? Contact us today, we can discuss your needs and see how we can help: contactus@visiongain.com
1. Report Overview
1.1 Objectives of the Study
1.2 Introduction to Monoclonal Antibody Discovery & Analysis Market
1.3 What This Report Delivers
1.4 Why You Should Read This Report
1.5 Key Questions Answered by This Analytical Report
1.6 Who is This Report for?
1.7 Methodology
1.7.1 Market Definitions
1.7.2 Market Evaluation & Forecasting Methodology
1.7.3 Data Validation
1.7.3.1 Primary Research
1.7.3.2 Secondary Research
1.8 Frequently Asked Questions (FAQs)
1.9 Associated Visiongain Reports
1.10 About Visiongain
2 Executive Summary
3 Market Overview
3.1 Key Findings
3.2 Market Dynamics
3.2.1 Market Driving Factors
3.2.1.1 Launches of New Products
3.2.1.2 Growing Funding and Healthcare Costs
3.2.2 Market Restraining Factors
3.2.2.1 Price Limits
3.2.2.2 Pressures for Regulatory Approval
3.2.2.3 Induction of Biosimilars
3.2.3 Market Opportunities
3.2.3.1 Pandemic Offered Opportunities
3.2.3.2 Patent Exclusive Rights
3.3 Supply Chain
3.3.1 Immunotherapy Drug Supply Chain and Logistics Challenges
3.3.2 Immunotherapies' Vulnerability
3.3.3 A One-of-a-Kind Starting Point for T-Cell Treatments
3.3.4 The Supply Chain's Missing Manufacturing Link
3.3.5 Limited Availability
3.3.6 Keeping Command of the Immunotherapy Supply Chain
3.4 Cold chain
3.4.1 Agencies Favor Transport Simulation
3.4.2 Packaging Qualification for Thermal
3.4.3 Requests for Information Regarding the Schedule of Verification Studies
3.5 Recent Trends/ Developments
3.5.1 The FDA Received an Investigational New Drug (IND) Application for VRDN-002
3.5.2 Verseau Therapeutics, Inc. Reported on January 4, 2022, FDA Approval
3.5.3 A Veterinary mAb Receives FDA Approval for the First Time
3.5.4 Two Antibody Therapies Are in Seagen's Clinical Study Queue.
3.5.5 Spirea Raises £2.4 Million to Create Cancer-Specific Antibody Drug Conjugates
3.5.6 Exelixis, Inc. of California and BioInvent International AB of Swedenpartner to Create New Antibodies for Immuno-oncology Treatments
3.6 COVID-19 Impact Analysis
3.7 Porter’s Five Forces Analysis
3.7.1 Supplier Power
3.7.2 Buyer Power
3.7.3 Competitive Rivalry
3.7.4 Threat from Substitutes
3.7.5 Threat of New Entrants
4 Monoclonal Antibody Discovery & Analysis Market Analysis by Business Type
4.1 Key Findings
4.2 Business Type Segment: Market Attractiveness Index
4.3 Monoclonal Antibody Discovery & Analysis Market by Business Type, 2022-2032 (US$ mn)
4.4 Monoclonal Antibody Discovery & Analysis Market by Region, 2022-2032 (US$ mn)
4.5 Instruments Manufacturing
4.6 Services & Solutions
4.6.1 Services
4.6.2 Solutions
4.7 Ancillary kits
5 Monoclonal Antibody Discovery & Analysis Market Analysis by Application
5.1 Key Findings
5.2 Application Segment: Market Attractiveness Index
5.3 Monoclonal Antibody Discovery & Analysis Market by Application, 2022-2032 (US$ mn)
5.4 Monoclonal Antibody Discovery & Analysis Market by Region, 2022-2032 (US$ mn)
5.5 Therapeutic Antibody Discovery
5.5.1 Transgenic Animal Leveraging Transgenic Animal Platforms for Antibody Discovery
5.5.2 Surrogate Antibodies
5.5.3 Drug Development
5.5.4 CAR-T Antibody Development
5.6 Critical Reagent Antibody Discovery
5.6.1 Anti-Idiotype Antibodies
5.6.2 Reagents and Tests for Immunogenicity and ADA
5.6.3 Antibodies and Assays for PK/PD/ADA
5.6.4 Studies for Potency
5.7 Biomarker and Diagnostic Antibody Discovery
5.8 Research Antibody Discovery
6 Monoclonal Antibody Discovery & Analysis Market Analysis by Platform
6.1 Key Findings
6.2 Platform Segment: Market Attractiveness Index
6.3 Monoclonal Antibody Discovery & Analysis Market by Platform, 2022-2032 (US$ mn)
6.4 Monoclonal Antibody Discovery & Analysis Market by Region, 2022-2032 (US$ mn)
6.5 Hybridoma
6.6 Humanization
6.7 Phage Display
6.8 Yeast display
6.9 Transgenic Rodents
7 Monoclonal Antibody Discovery & Analysis Market Analysis by Type
7.1 Key Findings
7.2 Type Segment: Market Attractiveness Index
7.3 Type Segment Market Attractiveness Index
7.4 Monoclonal Antibody Discovery & Analysis Market by Type, 2022-2032 (US$ mn)
7.5 Monoclonal Antibody Discovery & Analysis Market by Region, 2022-2032 (US$ mn)
7.6 Antigen Development
7.7 Monoclonal Antibody Discovery
7.8 Monoclonal Antibody Manufacturing
7.9 Polyclonal Antibodies
7.10 Label-Free Kinetics Analysis
7.11 Cell Banking
8 Monoclonal Antibody Discovery & Analysis Market Analysis by Region
8.1 Key Findings
8.2 Monoclonal Antibody Discovery & Analysis Market Attractiveness Index
8.3 Monoclonal Antibody Discovery & Analysis Market Forecast, 2022-2032 (US$ mn)
8.4 Monoclonal Antibody Discovery & Analysis Market by Region
8.5 Monoclonal Antibody Discovery & Analysis Market by Business Type
8.6 Monoclonal Antibody Discovery & Analysis Market by Application
8.7 Monoclonal Antibody Discovery & Analysis Market by Platform
8.8 Monoclonal Antibody Discovery & Analysis Market by Type
9 North America Monoclonal Antibody Discovery & Analysis Market Analysis
9.1 Key Findings
9.2 North America Monoclonal Antibody Discovery & Analysis Market Attractiveness Index
9.3 North America Monoclonal Antibodies Market by Value, 2022-2032 (US$ Mn)
9.4 Market Size Estimation and Forecast by Country
9.5 Market Size Estimation and Forecast by Business Type
9.6 Market Size Estimation and Forecast by Application
9.7 Market Size Estimation and Forecast by Platform
9.8 Market Size Estimation and Forecast by Type
9.9 U.S. Market Analysis
9.10 Canada Market Analysis
10 Europe Monoclonal Antibody Discovery & Analysis Market Analysis
10.1 Key Findings
10.2 Europe Monoclonal Antibody Discovery & Analysis Market Attractiveness Index
10.3 Europe Monoclonal Antibodies Market by Value, 2022-2032 (US$ mn)
10.4 Market Size Estimation and Forecast by Country
10.5 Market Size Estimation and Forecast by Business Type
10.6 Market Size Estimation and Forecast by Application
10.7 Market Size Estimation and Forecast by Platform
10.8 Market Size Estimation and Forecast by Type
10.9 Germany Market Analysis
10.10 UK Market Analysis
10.11 France Market Analysis
10.12 Italy Market Analysis
10.13 Spain Market Analysis
10.14 Rest of Europe Market Analysis
11 Asia-Pacific Monoclonal Antibody Discovery & Analysis Market Analysis
11.1 Key Findings
11.2 Asia-Pacific Monoclonal Antibody Discovery & Analysis Market Attractiveness Index
11.3 Asia-Pacific Monoclonal Antibodies Market by Value, 2022-2032 (US$ mn)
11.4 Market Size Estimation and Forecast by Country
11.5 Market Size Estimation and Forecast by Business Type
11.6 Market Size Estimation and Forecast by Application
11.7 Market Size Estimation and Forecast by Platform
11.8 Market Size Estimation and Forecast by Type
11.9 China Market Analysis
11.10 India Market Analysis
11.11 Japan Market Analysis
11.12 South Korea Market Analysis
11.13 Australia Market Analysis
11.14 Rest of Asia-Pacific Market Analysis
12 Middle East and Africa Monoclonal Antibody Discovery & Analysis Market Analysis
12.1 Key Findings
12.2 Middle East and Africa Monoclonal Antibody Discovery & Analysis Market Attractiveness Index
12.3 Middle East and Africa Monoclonal Antibodies Market by Value, 2022-2032 (US$ Mn)
12.4 Market Size Estimation and Forecast by Country
12.5 Market Size Estimation and Forecast by Business Type
12.6 Market Size Estimation and Forecast by Application
12.7 Market Size Estimation and Forecast by Platform
12.8 Market Size Estimation and Forecast by Type
12.9 South Africa Market Analysis
12.10 Saudi Arabia Market Analysis
12.11 Turkey Market Analysis
12.12 Rest of Middle East and Africa Market Analysis
13 Latin America Monoclonal Antibody Discovery & Analysis Market Analysis
13.1 Key Findings
13.2 Latin America Monoclonal Antibody Discovery & Analysis Market Attractiveness Index
13.3 Latin America Monoclonal Antibodies Market by Value, 2022-2032 (US$ mn)
13.4 Market Size Estimation and Forecast by Country
13.5 Market Size Estimation and Forecast by Business Type
13.6 Market Size Estimation and Forecast by Application
13.7 Market Size Estimation and Forecast by Platform
13.8 Market Size Estimation and Forecast by Type
13.9 Brazil Market Analysis
13.10 Mexico Market Analysis
13.11 Rest of Latin America Market Analysis
14 Competitive Landscape
14.1 Company Share Analysis
14.2 Key Business Strategy Analysis- Acquisition
14.3 Key Business Strategy Analysis- Agreement
14.4 Key Business Strategy Analysis- Alliance
14.5 Key Business Strategy Analysis- Collaboration
14.6 Key Business Strategy Analysis- Expansion
14.7 Key Business Strategy Analysis- Joint Venture
14.8 Key Business Strategy Analysis- New Product Launch
14.9 Key Business Strategy Analysis- Partnership
15 Company Profiles
15.1 AbbVie Inc.
15.1.1 Company Snapshot
15.1.2 Company Overview
15.1.3 Financial Analysis
15.1.3.1 Net Revenue, 2017-2021
15.1.3.2 Gross Profit, 2017-2021
15.1.3.3 R&D Expenses, 2017-2021
15.1.3.4 Regional Revenue Share
15.1.4 Product Benchmarking
15.1.5 Strategic Outlook
15.2 Amgen Inc.
15.2.1 Company Snapshot
15.2.2 Company Overview
15.2.3 Financial Analysis
15.2.3.1 Net Revenue, 2017-2021
15.2.3.2 Gross Profit, 2017-2021
15.2.3.3 R&D Expenses, 2017-2021
15.2.4 Product Benchmarking
15.2.5 Strategic Outlook
15.3 Amneal Pharmaceutical LLC
15.3.1 Company Snapshot
15.3.2 Company Overview
15.3.3 Financial Analysis
15.3.3.1 Net Revenue, 2017-2021
15.3.3.2 R&D Expenses, 2017-2021
15.3.4 Strategic Outlook
15.4 AstraZeneca
15.4.1 Company Snapshot
15.4.2 Company Overview
15.4.3 Financial Analysis
15.4.3.1 Net Revenue, 2017-2021
15.4.3.2 R&D Expenses, 2017-2021
15.4.3.3 Regional Revenue Share, 2021 (%)
15.4.4 Product Benchmarking
15.4.5 Strategic Outlook
15.5 Bayer AG
15.5.1 Company Snapshot
15.5.2 Company Overview
15.5.3 Financial Analysis
15.5.3.1 Net Revenue, 2017-2021
15.5.3.2 R&D Expenses, 2017-2021
15.5.3.3 Regional Revenue Share, 2021 (%)
15.5.4 Strategic Outlook
15.6 BIOGEN
15.6.1 Company Snapshot
15.6.2 Company Overview
15.6.3 Financial Analysis
15.6.3.1 Net Revenue, 2017-2021
15.6.3.2 R&D Expenses, 2017-2021
15.6.3.3 Regional Revenue Share, 2021 (%)
15.6.4 Product Benchmarking
15.6.5 Strategic Outlook
15.7 Bristol- Myers Squibb company
15.7.1 Company Snapshot
15.7.2 Company Overview
15.7.3 Financial Analysis
15.7.3.1 Net Revenue, 2017-2021
15.7.3.2 R&D Expenses, 2017-2021
15.7.3.3 Regional Revenue Share, 2021 (%)
15.7.4 Product Benchmarking
15.7.5 Strategic Outlook
15.8 Eisai Co.Ltd
15.8.1 Company Snapshot
15.8.2 Company Overview
15.8.3 Financial Analysis
15.8.3.1 Net Revenue, 2017-2021
15.8.3.2 R&D Expenses, 2017-2021
15.8.4 Product Benchmarking
15.8.5 Strategic Outlook
15.9 Eli Lilly and Company
15.9.1 Company Snapshot
15.9.2 Company Overview
15.9.3 Financial Analysis
15.9.3.1 Net Revenue, 2017-2021
15.9.3.2 R&D Expenses, 2017-2021
15.9.3.3 Regional Revenue Share, 2021 (%)
15.9.4 Product Benchmarking
15.9.5 Strategic Outlook
15.10 F. Hoffman-La Roche Ltd.
15.10.1 Company Snapshot
15.10.2 Company Overview
15.10.3 Financial Analysis
15.10.3.1 Net Revenue, 2017-2021
15.10.3.2 R&D Expenses, 2017-2021
15.10.3.3 Regional Revenue Share, 2021 (%)
15.10.4 Product Benchmarking
15.10.5 Strategic Outlook
15.11 GlaxoSmithKline plc
15.11.1 Company Snapshot
15.11.2 Company Overview
15.11.3 Financial Analysis
15.11.3.1 Net Revenue, 2018-2021
15.11.3.2 R&D Expenses, 2017-2021
15.11.3.3 Regional Revenue Share
15.11.4 Product Benchmarking
15.11.5 Strategic Outlook
15.12 Johnson & Johnson Ltd
15.12.1 Company Snapshot
15.12.2 Company Overview
15.12.3 Financial Analysis
15.12.3.1 Net Revenue, 2017-2021
15.12.3.2 R&D Expenses, 2017-2021
15.12.3.3 Regional Revenue Share, 2021 (%)
15.12.4 Strategic Outlook
15.13 Lupin Limited
15.13.1 Company Snapshot
15.13.2 Company Overview
15.13.3 Product Benchmarking
15.13.4 Strategic Outlook
15.14 Viatris Inc.
15.14.1 Company Snapshot
15.14.2 Company Overview
15.14.3 Financial Analysis
15.14.3.1 Net Revenue, 2017-2021
15.14.3.2 R&D Expenses, 2017-2021
15.14.4 Product Benchmarking
15.14.5 Strategic Outlook
15.15 Novartis AG
15.15.1 Company Snapshot
15.15.2 Company Overview
15.15.3 Financial Analysis
15.15.3.1 Net Revenue, 2017-2021
15.15.3.2 R&D Expenses, 2017-2021
15.15.3.3 Regional Revenue Share, 2021 (%)
15.15.4 Product Benchmarking
15.15.5 Strategic Outlook
15.16 Pfizer Inc.
15.16.1 Company Snapshot
15.16.2 Company Overview
15.16.3 Financial Analysis
15.16.3.1 Net Revenue, 2017-2021
15.16.3.2 Regional Revenue Share, 2021 (%)
15.16.4 Strategic Outlook
15.17 Regeneron Pharmaceuticals Inc
15.17.1 Company Snapshot
15.17.2 Company Overview
15.17.3 Financial Analysis
15.17.3.1 Net Revenue, 2017-2021
15.17.3.2 R&D Expenses, 2017-2021
15.17.4 Product Benchmarking
15.17.5 Strategic Outlook
15.18 Sanofi S.A.
15.18.1 Company Snapshot
15.18.2 Company Overview
15.18.3 Financial Analysis
15.18.3.1 Net Revenue, 2017-2021
15.18.3.2 R&D Expenses, 2017-2021
15.18.3.3 Regional Revenue Share, 2021 (%)
15.18.4 Product Benchmarking
15.18.5 Strategic Outlook
15.19 Teva Pharmaceutical Industries Ltd.
15.19.1 Company Snapshot
15.19.2 Company Overview
15.19.3 Financial Analysis
15.19.3.1 Net Revenue, 2017-2021
15.19.3.2 R&D Expenses, 2017-2021
15.19.3.3 Regional Revenue Share, 2021 (%)
15.19.4 Strategic Outlook
15.20 Zydus Lifesciences Limited
15.20.1 Company Snapshot
15.20.2 Company Overview
15.20.3 Product Benchmarking
15.20.4 Strategic Outlook
16 Conclusion and Recommendations
16.1 Concluding Remarks from Visiongain
16.2 Recommendations for Market Players
List of Tables
Table 1 Monoclonal Antibody Discovery & Analysis Market Snapshot, 2022 & 2032 (US$ billion, CAGR %)
Table 2 Monoclonal Antibody Discovery & Analysis Market Forecast, 2022-2032 (US$ mn, AGR (%), CAGR (%)) (V-Shaped Recovery Scenario)
Table 3 Monoclonal Antibody Discovery & Analysis Market by Region, 2022-2032 (US$ mn, AGR (%), CAGR (%)) (V-Shaped Recovery Scenario)
Table 4 Monoclonal Antibody Discovery & Analysis Market Forecast, 2022-2032 (US$ mn, AGR (%), CAGR (%)) (W-Shaped Recovery Scenario)
Table 5 Monoclonal Antibody Discovery & Analysis Market by Region, 2022-2032 (US$ mn, AGR (%), CAGR (%)) (W-Shaped Recovery Scenario)
Table 6 Monoclonal Antibody Discovery & Analysis Market Forecast, 2022-2032 (US$ mn, AGR (%), CAGR (%)) (U-Shaped Recovery Scenario)
Table 7 Monoclonal Antibody Discovery & Analysis Market by Region, 2022-2032 (US$ mn, AGR (%), CAGR (%)) (U-Shaped Recovery Scenario)
Table 8 Monoclonal Antibody Discovery & Analysis Market Forecast, 2022-2032 (US$ mn, AGR (%), CAGR (%)) (L-Shaped Recovery Scenario)
Table 9 Monoclonal Antibody Discovery & Analysis Market by Region, 2022-2032 (US$ mn, AGR (%), CAGR (%)) (L-Shaped Recovery Scenario)
Table 10 Monoclonal Antibody Discovery & Analysis Market by Business Type, 2022-2032 (US$ mn, AGR (%), CAGR (%))
Table 11 Global Instruments Manufacturing Market by Region, 2022-2032 (US$ mn, AGR (%), CAGR (%))
Table 12 Global Instruments Manufacturing Market Forecast, 2022-2032 (US$ mn, AGR (%), CAGR (%))
Table 13 Global Services & Solutions Market Forecast, 2022-2032 (US$ mn, AGR (%), CAGR (%))
Table 14 Global Services & Solutions Market by Region, 2022-2032 (US$ mn, AGR (%), CAGR (%))
Table 15 Global Ancillary Kits Market Forecast, 2022-2032 (US$ mn, AGR (%), CAGR (%))
Table 16 Global Ancillary Kits Market by Region, 2022-2032 (US$ mn, AGR (%), CAGR (%))
Table 17 Monoclonal Antibody Discovery & Analysis Market by Application, 2022-2032 (US$ mn, AGR (%), CAGR (%))
Table 18 Global Therapeutic Antibody Discovery Market by Region, 2022-2032 (US$ mn, AGR (%), CAGR (%))
Table 19 Global Therapeutic Antibody Discovery Market Forecast, 2022-2032 (US$ mn, AGR (%), CAGR (%))
Table 20 Global Critical Reagent Antibody Discovery Market Forecast, 2022-2032 (US$ mn, AGR (%), CAGR (%))
Table 21 Global Critical Reagent Antibody Discovery Market by Region, 2022-2032 (US$ mn, AGR (%), CAGR (%))
Table 22 Global Biomarker and Diagnostic Antibody Discovery Market Forecast, 2022-2032 (US$ mn, AGR (%), CAGR (%))
Table 23 Global Biomarker and Diagnostic Antibody Discovery Market by Region, 2022-2032 (US$ mn, AGR (%), CAGR (%))
Table 24 Global Research Antibody Discovery Market Forecast, 2022-2032 (US$ mn, AGR (%), CAGR (%))
Table 25 Global Research Antibody Discovery Market by Region, 2022-2032 (US$ mn, AGR (%), CAGR (%))
Table 26 Monoclonal Antibody Discovery & Analysis Market by Platform, 2022-2032 (US$ mn, AGR (%), CAGR (%))
Table 27 Global Hybridoma Market by Region, 2022-2032 (US$ mn, AGR (%), CAGR (%))
Table 28 Global Hybridoma Market Forecast, 2022-2032 (US$ mn, AGR (%), CAGR (%))
Table 29 Global Humanization Market Forecast, 2022-2032 (US$ mn, AGR (%), CAGR (%))
Table 30 Global Humanization Market by Region, 2022-2032 (US$ mn, AGR (%), CAGR (%))
Table 31 Global Phage Display Market Forecast, 2022-2032 (US$ mn, AGR (%), CAGR (%))
Table 32 Global Phage Display Market by Region, 2022-2032 (US$ mn, AGR (%), CAGR (%))
Table 33 Global Yeast Display Market Forecast, 2022-2032 (US$ mn, AGR (%), CAGR (%))
Table 34 Global Yeast Display Market by Region, 2022-2032 (US$ mn, AGR (%), CAGR (%))
Table 35 Global Transgenic Rodents Market Forecast, 2022-2032 (US$ mn, AGR (%), CAGR (%))
Table 36 Global Transgenic Rodents Market by Region, 2022-2032 (US$ mn, AGR (%), CAGR (%))
Table 37 Monoclonal Antibody Discovery & Analysis Market by Type, 2022-2032 (US$ mn, AGR (%), CAGR (%))
Table 38 Global Antigen Development Market by Region, 2022-2032 (US$ mn, AGR (%), CAGR (%))
Table 39 Global Antigen Development Market Forecast, 2022-2032 (US$ mn, AGR (%), CAGR (%))
Table 40 Global Monoclonal Antibody Discovery Market Forecast, 2022-2032 (US$ mn, AGR (%), CAGR (%))
Table 41 Global Monoclonal Antibody Discovery Market by Region, 2022-2032 (US$ mn, AGR (%), CAGR (%))
Table 42 Global Monoclonal Antibody Manufacturing Market Forecast, 2022-2032 (US$ mn, AGR (%), CAGR (%))
Table 43 Global Monoclonal Antibody Manufacturing Market by Region, 2022-2032 (US$ mn, AGR (%), CAGR (%))
Table 44 Global Polyclonal Antibodies Market Forecast, 2022-2032 (US$ mn, AGR (%), CAGR (%))
Table 45 Global Polyclonal Antibodies Market by Region, 2022-2032 (US$ mn, AGR (%), CAGR (%))
Table 46 Global Label-free Kinetics Analysis Market Forecast, 2022-2032 (US$ mn, AGR (%), CAGR (%))
Table 47 Global Label-free Kinetics Analysis Market by Region, 2022-2032 (US$ mn, AGR (%), CAGR (%))
Table 48 Global Cell Banking Market Forecast, 2022-2032 (US$ mn, AGR (%), CAGR (%))
Table 49 Global Cell Banking Market by Region, 2022-2032 (US$ mn, AGR (%), CAGR (%))
Table 50 Monoclonal Antibody Discovery & Analysis Market Forecast, 2022-2032 (US$ mn, AGR (%), CAGR (%))
Table 51 Monoclonal Antibody Discovery & Analysis Market by Region, 2022-2032 (US$ mn, AGR (%), CAGR (%))
Table 52 Monoclonal Antibody Discovery & Analysis Market by Business Type, 2022-2032 (US$ mn, AGR (%), CAGR (%))
Table 53 Monoclonal Antibody Discovery & Analysis Market by Application, 2022-2032 (US$ mn, AGR (%), CAGR (%))
Table 54 Monoclonal Antibody Discovery & Analysis Market by Platform, 2022-2032 (US$ mn, AGR (%), CAGR (%))
Table 55 Monoclonal Antibody Discovery & Analysis Market by Type, 2022-2032 (US$ mn, AGR (%), CAGR (%))
Table 56 North America Monoclonal Antibody Discovery & Analysis Market by Value, 2022-2032 (US$ mn, AGR (%), CAGR (%))
Table 57 North America Monoclonal Antibody Discovery & Analysis Market by Country, 2022-2032 (US$ mn, AGR (%), CAGR (%))
Table 58 North America Monoclonal Antibody Discovery & Analysis Market by Business Type, 2022-2032 (US$ mn, AGR (%), CAGR (%))
Table 59 North America Monoclonal Antibody Discovery & Analysis Market by Application, 2022-2032 (US$ mn, AGR (%), CAGR (%))
Table 60 North America Monoclonal Antibody Discovery & Analysis Market by Platform, 2022-2032 (US$ mn, AGR (%), CAGR (%))
Table 61 North America Monoclonal Antibody Discovery & Analysis Market by Type, 2022-2032 (US$ mn, AGR (%), CAGR (%))
Table 62 U.S. Monoclonal Antibody Discovery & Analysis Market by Value, 2022-2032 (US$ mn, AGR (%), CAGR (%))
Table 63 Canada Monoclonal Antibody Discovery & Analysis Market by Value, 2022-2032 (US$ mn, AGR (%), CAGR (%))
Table 64 Europe Monoclonal Antibody Discovery & Analysis Market by Value, 2022-2032 (US$ mn, AGR (%), CAGR (%))
Table 65 Europe Monoclonal Antibody Discovery & Analysis Market by Country, 2022-2032 (US$ mn, AGR (%), CAGR (%))
Table 66 Europe Monoclonal Antibody Discovery & Analysis Market by Business Type, 2022-2032 (US$ mn, AGR (%), CAGR (%))
Table 67 Europe Monoclonal Antibody Discovery & Analysis Market by Application, 2022-2032 (US$ mn, AGR (%), CAGR (%))
Table 68 Europe Monoclonal Antibody Discovery & Analysis Market by Platform, 2022-2032 (US$ mn, AGR (%), CAGR (%))
Table 69 Europe Monoclonal Antibody Discovery & Analysis Market by Type, 2022-2032 (US$ mn, AGR (%), CAGR (%))
Table 70 Germany Monoclonal Antibody Discovery & Analysis Market by Value, 2022-2032 (US$ mn, AGR (%), CAGR (%))
Table 71 UK Monoclonal Antibody Discovery & Analysis Market by Value, 2022-2032 (US$ mn, AGR (%), CAGR (%))
Table 72 France Monoclonal Antibody Discovery & Analysis Market by Value, 2022-2032 (US$ mn, AGR (%), CAGR (%))
Table 73 Italy Monoclonal Antibody Discovery & Analysis Market by Value, 2022-2032 (US$ mn, AGR (%), CAGR (%))
Table 74 Spain Monoclonal Antibody Discovery & Analysis Market by Value, 2022-2032 (US$ mn, AGR (%), CAGR (%))
Table 75 Rest of Europe Monoclonal Antibody Discovery & Analysis Market by Value, 2022-2032 (US$ mn, AGR (%), CAGR (%))
Table 76 Asia-Pacific Monoclonal Antibody Discovery & Analysis Market by Value, 2022-2032 (US$ mn, AGR (%), CAGR (%))
Table 77 Asia-Pacific Monoclonal Antibody Discovery & Analysis Market by Country, 2022-2032 (US$ mn, AGR (%), CAGR (%))
Table 78 Asia-Pacific Monoclonal Antibody Discovery & Analysis Market by Business Type, 2022-2032 (US$ mn, AGR (%), CAGR (%))
Table 79 Asia-Pacific Monoclonal Antibody Discovery & Analysis Market by Application, 2022-2032 (US$ mn, AGR (%), CAGR (%))
Table 80 Asia-Pacific Monoclonal Antibody Discovery & Analysis Market by Platform, 2022-2032 (US$ mn, AGR (%), CAGR (%))
Table 81 Asia-Pacific Monoclonal Antibody Discovery & Analysis Market by Type, 2022-2032 (US$ mn, AGR (%), CAGR (%))
Table 82 China Monoclonal Antibody Discovery & Analysis Market by Value, 2022-2032 (US$ mn, AGR (%), CAGR (%))
Table 83 India Monoclonal Antibody Discovery & Analysis Market by Value, 2022-2032 (US$ mn, AGR (%), CAGR (%))
Table 84 Japan Monoclonal Antibody Discovery & Analysis Market by Value, 2022-2032 (US$ mn, AGR (%), CAGR (%))
Table 85 South Korea Monoclonal Antibody Discovery & Analysis Market by Value, 2022-2032 (US$ mn, AGR (%), CAGR (%))
Table 86 Australia Monoclonal Antibody Discovery & Analysis Market by Value, 2022-2032 (US$ mn, AGR (%), CAGR (%))
Table 87 Rest of Asia-Pacific Monoclonal Antibody Discovery & Analysis Market by Value, 2022-2032 (US$ mn, AGR (%), CAGR (%))
Table 88 Middle East & Africa Monoclonal Antibody Discovery & Analysis Market by Value, 2022-2032 (US$ mn, AGR (%), CAGR (%))
Table 89 Middle East & Africa Monoclonal Antibody Discovery & Analysis Market by Country, 2022-2032 (US$ mn, AGR (%), CAGR (%))
Table 90 Middle East & Africa Monoclonal Antibody Discovery & Analysis Market by Business Type, 2022-2032 (US$ mn, AGR (%), CAGR (%))
Table 91 Middle East & Africa Monoclonal Antibody Discovery & Analysis Market by Application, 2022-2032 (US$ mn, AGR (%), CAGR (%))
Table 92 Middle East & Africa Monoclonal Antibody Discovery & Analysis Market by Platform, 2022-2032 (US$ mn, AGR (%), CAGR (%))
Table 93 Middle East & Africa Monoclonal Antibody Discovery & Analysis Market by Type, 2022-2032 (US$ mn, AGR (%), CAGR (%))
Table 94 South Africa Monoclonal Antibody Discovery & Analysis Market by Value, 2022-2032 (US$ mn, AGR (%), CAGR (%))
Table 95 Saudi Arabia Monoclonal Antibody Discovery & Analysis Market by Value, 2022-2032 (US$ mn, AGR (%), CAGR (%))
Table 96 Turkey Monoclonal Antibody Discovery & Analysis Market by Value, 2022-2032 (US$ mn, AGR (%), CAGR (%))
Table 97 Rest of Middle East & Africa Monoclonal Antibody Discovery & Analysis Market by Value, 2022-2032 (US$ mn, AGR (%), CAGR (%))
Table 98 Latin America Monoclonal Antibody Discovery & Analysis Market by Value, 2022-2032 (US$ mn, AGR (%), CAGR (%))
Table 99 Latin America Monoclonal Antibody Discovery & Analysis Market by Country, 2022-2032 (US$ mn, AGR (%), CAGR (%))
Table 100 Latin America Monoclonal Antibody Discovery & Analysis Market by Business Type, 2022-2032 (US$ mn, AGR (%), CAGR (%))
Table 101 Latin America Monoclonal Antibody Discovery & Analysis Market by Application, 2022-2032 (US$ mn, AGR (%), CAGR (%))
Table 102 Latin America Monoclonal Antibody Discovery & Analysis Market by Platform, 2022-2032 (US$ mn, AGR (%), CAGR (%))
Table 103 Latin America Monoclonal Antibody Discovery & Analysis Market by Type, 2022-2032 (US$ mn, AGR (%), CAGR (%))
Table 104 Brazil Monoclonal Antibody Discovery & Analysis Market by Value, 2022-2032 (US$ mn, AGR (%), CAGR (%))
Table 105 Mexico Monoclonal Antibody Discovery & Analysis Market by Value, 2022-2032 (US$ mn, AGR (%), CAGR (%))
Table 106 Rest of Latin America Monoclonal Antibody Discovery & Analysis Market by Value, 2022-2032 (US$ mn, AGR (%), CAGR (%))
Table 107 Key Business Strategies Adopted by Key Players in Monoclonal Antibody Discovery & Analysis Market
Table 108 Key Business Strategies Adopted by Key Players in Monoclonal Antibody Discovery & Analysis Market
Table 109 Key Business Strategies Adopted by Key Players in Monoclonal Antibody Discovery & Analysis Market
Table 110 Key Business Strategies Adopted by Key Players in Monoclonal Antibody Discovery & Analysis Market
Table 111 Key Business Strategies Adopted by Key Players in Monoclonal Antibody Discovery & Analysis Market
Table 112 Key Business Strategies Adopted by Key Players in Monoclonal Antibody Discovery & Analysis Market
Table 113 Key Business Strategies Adopted by Key Players in Monoclonal Antibody Discovery & Analysis Market
Table 114 Key Business Strategies Adopted by Key Players in Monoclonal Antibody Discovery & Analysis Market
Table 115 AbbVie Inc.: Key Details, (CEO, HQ, Revenue, Founded, No. of Employees, Company Type, Website, Business Segment)
Table 116 AbbVie Inc.: Product Benchmarking
Table 117 AbbVie Inc.: Strategic Outlook
Table 118 Amgen Inc: Key Details (CEO, HQ, Revenue, Founded, No. of Employees, Company Type, Website, Business Segment)
Table 119 Amgen Inc.: Product Benchmarking
Table 120 Amgen Inc.: Strategic Outlook
Table 121 Amneal Pharmaceutical LLC: Key Details, (CEO, HQ, Revenue, Founded, No. of Employees, Company Type, Website, Business Segment)
Table 122 Amneal Pharmaceutical LLC: Strategic Outlook
Table 123 Astrazeneca: Key Details (CEO, HQ, Revenue, Founded, No. of Employees, Company Type, Website, Business Segment)
Table 124 Astrazeneca.: Product Benchmarking
Table 125 Astrazeneca: Strategic Outlook
Table 126 Bayer AG: Key Details (CEO, HQ, Revenue, Founded, No. of Employees, Company Type, Website, Business Segment)
Table 127 Bayer AG: Strategic Outlook
Table 128 BIOGEN: Key Details (CEO, HQ, Revenue, Founded, No. of Employees, Company Type, Website, Business Segment)
Table 129 BIOGEN: Product Benchmarking
Table 130 BIOGEN: Strategic Outlook
Table 131 Bristol-Myers Squibb Company: Key Details (CEO, HQ, Revenue, Founded, No. of Employees, Company Type, Website, Business Segment)
Table 132 Bristol-Myers Squibb company.: Product Benchmarking
Table 133 Bristol-Myers Squibb Company: Strategic Outlook
Table 134 Eisai Co. Ltd: Key Details (CEO, HQ, Revenue, Founded, No. of Employees, Company Type, Website, Business Segment)
Table 135 Eisai Co.Ltd: Product Benchmarking
Table 136 Eisai Co.Ltd: Strategic Outlook
Table 137 Eli Lilly and Company: Key Details (CEO, HQ, Revenue, Founded, No. of Employees, Company Type, Website, Business Segment)
Table 138 Eli-Lily & Company: Product Benchmarking
Table 139 Eli-Lily & Company: Strategic Outlook
Table 140 F. Hoffman-La Roche Ltd.: Key Details, (CEO, HQ, Revenue, Founded, No. of Employees, Company Type, Website, Business Segment)
Table 141 F. Hoffman-La Roche Ltd.: Product Benchmarking
Table 142 F. Hoffman-La Roche Ltd: Strategic Outlook
Table 143 GlaxoSmithKline plc .: Key Details, (CEO, HQ, Revenue, Founded, No. of Employees, Company Type, Website, Business Segment)
Table 144 GlaxoSmithKline plc: Product Benchmarking
Table 145 GlaxoSmithKline plc: Strategic Outlook
Table 146 Johnson & Johnson Ltd: Key Details (CEO, HQ, Revenue, Founded, No. of Employees, Company Type, Website, Business Segment)
Table 147 Johnson & Johnson Ltd: Strategic Outlook
Table 148 Lupin Limited.: Key Details, (CEO, HQ, Revenue, Founded, No. of Employees, Company Type, Website, Business Segment)
Table 149 Lupin.: Product Benchmarking
Table 150 Lupin: Strategic Outlook
Table 151 Viatris Inc.: Key Details, (CEO, HQ, Revenue, Founded, No. of Employees, Company Type, Website, Business Segment)
Table 152 Viatris Inc.: Product Benchmarking
Table 153 Viatris Inc..: Strategic Outlook
Table 154 Novartis AG.: Key Details, (CEO, HQ, Revenue, Founded, No. of Employees, Company Type, Website, Business Segment)
Table 155 Novartis AG.: Product Benchmarking
Table 156 Novartis AG.: Strategic Outlook
Table 157 Pfizer Inc.: Key Details, (CEO, HQ, Revenue, Founded, No. of Employees, Company Type, Website, Business Segment)
Table 158 Pfizer Inc.: Strategic Outlook
Table 159 Regeneron Pharmaceuticals Inc: Key Details (CEO, HQ, Revenue, Founded, No. of Employees, Company Type, Website, Business Segment)
Table 160 Regeneron Pharmaceutical Inc: Product Benchmarking
Table 161 Regeneron Pharmaceutical Inc: Strategic Outlook
Table 162 Sanofi S.A.: Key Details, (CEO, HQ, Revenue, Founded, No. of Employees, Company Type, Website, Business Segment)
Table 163 Sanofi S.A.: Product Benchmarking
Table 164 Sanofi S.A.: Strategic Outlook
Table 165 Teva Pharmaceutical Industries Ltd.: Key Details, (CEO, HQ, Revenue, Founded, No. of Employees, Company Type, Website, Business Segment)
Table 166 Teva Pharmaceutical Industries Ltd.: Strategic Outlook
Table 167 Zydus Lifesciences Limited: Key Details (CEO, HQ, Revenue, Founded, No. of Employees, Company Type, Website, Business Segment)
Table 168 Zydus Lifesciences Limited: Product Benchmarking
List of Figures
Figure 1 Monoclonal Antibody Discovery & Analysis Market Segmentation
Figure 2 Monoclonal Antibody Discovery & Analysis Market Forecast by Region: Market Attractiveness Index
Figure 3 Monoclonal Antibody Discovery & Analysis Market by Application Method: Market Attractiveness Index
Figure 4 Monoclonal Antibody Discovery & Analysis Market by Business type: Market Attractiveness Index
Figure 5 Monoclonal Antibody Discovery & Analysis Market by Platform: Market Attractiveness Index
Figure 6 Monoclonal Antibody Discovery & Analysis Market by Type: Market Attractiveness Index
Figure 7 Monoclonal Antibody Discovery & Analysis Market: Market Dynamics
Figure 8 Primary indications for antibody therapeutics approved or in regulatory review in the United States or European Union
Figure 9 Targets for antibody therapeutics approved or in regulatory review in the United States or European Union for cancer.
Figure 10 Targets for antibody therapeutics approved or in regulatory review in the United States or European Union for noncancer indications.
Figure 11 Global COVID Impact Analysis: Monoclonal Antibody Discovery & Analysis Market Recovery Scenarios
Figure 12 Monoclonal Antibody Discovery & Analysis Market Forecast, 2022-2032 (US$ mn, AGR (%)) (V-Shaped Recovery Scenario)
Figure 13 Monoclonal Antibody Discovery & Analysis Market by Region, 2022-2032 (US$ mn, AGR (%)) (V-Shaped Recovery Scenario)
Figure 14 Monoclonal Antibody Discovery & Analysis Market Forecast, 2022-2032 (US$ mn, AGR (%))(W-Shaped Recovery Scenario)
Figure 15 Monoclonal Antibody Discovery & Analysis Market by Region, 2022-2032 (US$ mn, AGR (%)) (W-Shaped Recovery Scenario)
Figure 16 Monoclonal Antibody Discovery & Analysis Market Forecast, 2022-2032 (US$ mn, AGR (%)) (U-Shaped Recovery Scenario)
Figure 17 Monoclonal Antibody Discovery & Analysis Market by Region, 2022-2032 (US$ mn, AGR (%)) (U-Shaped Recovery Scenario)
Figure 18 Monoclonal Antibody Discovery & Analysis Market Forecast, 2022-2032 (US$ mn, AGR (%)) (L-Shaped Recovery Scenario)
Figure 19 Monoclonal Antibody Discovery & Analysis Market by Region, 2022-2032 (US$ mn, AGR (%)) (L-Shaped Recovery Scenario)
Figure 20 Monoclonal Antibody Discovery & Analysis Market: Porter’s Five Forces Analysis
Figure 21 Business Type Method Monoclonal Antibodies Market Attractiveness Index
Figure 22 Monoclonal Antibody Discovery & Analysis Market by Business Type, 2022-2032 (US$ mn, AGR (%))
Figure 23 Global Instruments Manufacturing Market by Region, 2022-2032 (US$ mn, AGR (%))
Figure 24 Global Instruments Manufacturing Market Forecast, 2022-2032 (US$ mn, AGR (%))
Figure 25 Global Services & Solutions Market Forecast, 2022-2032 (US$ mn, AGR (%))
Figure 26 Global Services & Solutions Market by Region, 2022-2032 (US$ mn, AGR (%))
Figure 27 Global Ancillary Kits Market Forecast, 2022-2032 (US$ mn, AGR (%))
Figure 28 Global Ancillary Kits Market by Region, 2022-2032 (US$ mn, AGR (%))
Figure 29 Application Segment Market Attractiveness Index
Figure 30 Monoclonal Antibody Discovery & Analysis Market by Application, 2022-2032 (US$ mn, AGR (%))
Figure 31 Global Therapeutic Antibody Discovery Market by Region, 2022-2032 (US$ mn, AGR (%))
Figure 32 Antibodies
Figure 33 CAR-Ts are produced using antibodies
Figure 34 Global Therapeutic Antibody Discovery Market Forecast, 2022-2032 (US$ mn, AGR (%))
Figure 35 Ab Structure
Figure 36 Immunogenicity Risk of Therapeutic Antibodies
Figure 37 Global Critical Reagent Antibody Discovery Market Forecast, 2022-2032 (US$ mn, AGR (%))
Figure 38 Global Critical Reagent Antibody Discovery Market by Region, 2022-2032 (US$ mn, AGR (%))
Figure 39 Global Biomarker and Diagnostic Antibody Discovery Market Forecast, 2022-2032 (US$ mn, AGR (%))
Figure 40 Global Biomarker and Diagnostic Antibody Discovery Market by Region, 2022-2032 (US$ mn, AGR (%))
Figure 41 Global Research Antibody Discovery Market Forecast, 2022-2032 (US$ mn, AGR (%))
Figure 42 Global Research Antibody Discovery Market by Region, 2022-2032 (US$ mn, AGR (%))
Figure 43 Platform Segment Market Attractiveness Index
Figure 44 Monoclonal Antibody Discovery & Analysis Market by Platform, 2022-2032 (US$ mn, AGR (%))
Figure 45 Global Hybridoma Market by Region, 2022-2032 (US$ mn, AGR (%))
Figure 46 Global Hybridoma Market Forecast, 2022-2032 (US$ mn, AGR (%))
Figure 47 Global Humanization Market Forecast, 2022-2032 (US$ mn, AGR (%))
Figure 48 Global Humanization Market by Region, 2022-2032 (US$ mn, AGR (%))
Figure 49 Global Phage Display Market Forecast, 2022-2032 (US$ mn, AGR (%))
Figure 50 Global Phage Display Market by Region, 2022-2032 (US$ mn, AGR (%))
Figure 51 Global Yeast Display Market Forecast, 2022-2032 (US$ mn, AGR (%))
Figure 52 Global Yeast Display Market by Region, 2022-2032 (US$ mn, AGR (%))
Figure 53 Global Transgenic Rodents Market Forecast, 2022-2032 (US$ mn, AGR (%))
Figure 54 Global Transgenic Rodents Market by Region, 2022-2032 (US$ mn, AGR (%))
Figure 55 Monoclonal Antibody Discovery & Analysis Market Forecast by Type 2022, 2032 (Revenue, CAGR (%))
Figure 56 Type Segment Market Attractiveness Index
Figure 57 Monoclonal Antibody Discovery & Analysis Market by Type, 2022-2032 (US$ mn, AGR (%))
Figure 58 Global Antigen Development Market by Region, 2022-2032 (US$ mn, AGR (%))
Figure 59 Global Antigen Development Market Forecast, 2022-2032 (US$ mn, AGR (%))
Figure 60 Global Monoclonal Antibody Discovery Market Forecast, 2022-2032 (US$ mn, AGR (%))
Figure 61 Global Monoclonal Antibody Discovery Market by Region, 2022-2032 (US$ mn, AGR (%))
Figure 62 Global Monoclonal Antibody Manufacturing Market Forecast, 2022-2032 (US$ mn, AGR (%))
Figure 63 Global Monoclonal Antibody Manufacturing Market by Region, 2022-2032 (US$ mn, AGR (%))
Figure 64 Global Polyclonal Antibodies Market Forecast, 2022-2032 (US$ mn, AGR (%))
Figure 65 Global Polyclonal Antibodies Market by Region, 2022-2032 (US$ mn, AGR (%))
Figure 66 Global Label-free Kinetics Analysis Market Forecast, 2022-2032 (US$ mn, AGR (%))
Figure 67 Global Label-free Kinetics Analysis Market by Region, 2022-2032 (US$ mn, AGR (%))
Figure 68 Global Cell Banking Market Forecast, 2022-2032 (US$ mn, AGR (%))
Figure 69 Global Cell Banking Market by Region, 2022-2032 (US$ mn, AGR (%))
Figure 70 Monoclonal Antibody Discovery & Analysis Market Attractiveness Index
Figure 71 Monoclonal Antibody Discovery & Analysis Market Forecast, 2022-2032 (US$ mn, AGR (%))
Figure 72 Monoclonal Antibody Discovery & Analysis Market by Region, 2022-2032 (US$ mn, AGR (%))
Figure 73 Monoclonal Antibody Discovery & Analysis Market by Business Type, 2022-2032 (US$ mn, AGR (%))
Figure 74 Monoclonal Antibody Discovery & Analysis Market by Application, 2022-2032 (US$ mn, AGR (%))
Figure 75 Monoclonal Antibody Discovery & Analysis Market by Platform, 2022-2032 (US$ mn, AGR (%))
Figure 76 Monoclonal Antibody Discovery & Analysis Market by Type, 2022-2032 (US$ mn, AGR (%))
Figure 77 North America Monoclonal Antibody Discovery & Analysis Market Attractiveness Index
Figure 78 North America Monoclonal Antibody Discovery & Analysis Market by Value, 2022-2032 (US$ mn, AGR (%))
Figure 79 North America Monoclonal Antibody Discovery & Analysis Market by Country, 2022-2032 (US$ mn, AGR (%))
Figure 80 North America Monoclonal Antibody Discovery & Analysis Market by Business Type, 2022-2032 (US$ mn, AGR (%))
Figure 81 North America Monoclonal Antibody Discovery & Analysis Market by Application, 2022-2032 (US$ mn, AGR (%))
Figure 82 North America Monoclonal Antibody Discovery & Analysis Market by Platform, 2022-2032 (US$ mn, AGR (%))
Figure 83 North America Monoclonal Antibody Discovery & Analysis Market by Type, 2022-2032 (US$ mn, AGR (%))
Figure 84 U.S. Monoclonal Antibody Discovery & Analysis Market by Value, 2022-2032 (US$ mn, AGR (%))
Figure 85 Canada Monoclonal Antibody Discovery & Analysis Market by Value, 2022-2032 (US$ mn, AGR (%))
Figure 86 South America Monoclonal Antibody Discovery & Analysis Market Attractiveness Index
Figure 87 Europe Monoclonal Antibody Discovery & Analysis Market by Value, 2022-2032 (US$ mn, AGR (%))
Figure 88 Europe Monoclonal Antibody Discovery & Analysis Market by Country, 2022-2032 (US$ mn, AGR (%))
Figure 89 Europe Monoclonal Antibody Discovery & Analysis Market by Business Type, 2022-2032 (US$ mn, AGR (%))
Figure 90 Europe Monoclonal Antibody Discovery & Analysis Market by Application, 2022-2032 (US$ mn, AGR (%))
Figure 91 Europe Monoclonal Antibody Discovery & Analysis Market by Platform, 2022-2032 (US$ mn, AGR (%))
Figure 92 Europe Monoclonal Antibody Discovery & Analysis Market by Type, 2022-2032 (US$ mn, AGR (%))
Figure 93 Germany Monoclonal Antibody Discovery & Analysis Market by Value, 2022-2032 (US$ mn, AGR (%))
Figure 94 UK Monoclonal Antibody Discovery & Analysis Market by Value, 2022-2032 (US$ mn, AGR (%))
Figure 95 France Monoclonal Antibody Discovery & Analysis Market by Value, 2022-2032 (US$ mn, AGR (%))
Figure 96 Italy Monoclonal Antibody Discovery & Analysis Market by Value, 2022-2032 (US$ mn, AGR (%))
Figure 97 Spain Monoclonal Antibody Discovery & Analysis Market by Value, 2022-2032 (US$ mn, AGR (%))
Figure 98 Rest of Europe Monoclonal Antibody Discovery & Analysis Market by Value, 2022-2032 (US$ mn, AGR (%))
Figure 99 Asia-Pacific Monoclonal Antibody Discovery & Analysis Market Attractiveness Index
Figure 100 Asia-Pacific Monoclonal Antibody Discovery & Analysis Market by Value, 2022-2032 (US$ mn, AGR (%))
Figure 101 Asia-Pacific Monoclonal Antibody Discovery & Analysis Market by Country, 2022-2032 (US$ mn, AGR (%))
Figure 102 Asia-Pacific Monoclonal Antibody Discovery & Analysis Market by Business Type, 2022-2032 (US$ mn, AGR (%))
Figure 103 Asia-Pacific Monoclonal Antibody Discovery & Analysis Market by Application, 2022-2032 (US$ mn, AGR (%))
Figure 104 Asia-Pacific Monoclonal Antibody Discovery & Analysis Market by Platform, 2022-2032 (US$ mn, AGR (%))
Figure 105 Asia-Pacific Monoclonal Antibody Discovery & Analysis Market by Type, 2022-2032 (US$ mn, AGR (%))
Figure 106 China Monoclonal Antibody Discovery & Analysis Market by Value, 2022-2032 (US$ mn, AGR (%))
Figure 107 India Monoclonal Antibody Discovery & Analysis Market by Value, 2022-2032 (US$ mn, AGR (%))
Figure 108 Japan Monoclonal Antibody Discovery & Analysis Market by Value, 2022-2032 (US$ mn, AGR (%))
Figure 109 South Korea Monoclonal Antibody Discovery & Analysis Market by Value, 2022-2032 (US$ mn, AGR (%))
Figure 110 Australia Monoclonal Antibody Discovery & Analysis Market by Value, 2022-2032 (US$ mn, AGR (%))
Figure 111 Rest of Asia-Pacific Monoclonal Antibody Discovery & Analysis Market by Value, 2022-2032 (US$ mn, AGR (%))
Figure 112 Middle East and Africa Monoclonal Antibody Discovery & Analysis Market Attractiveness Index
Figure 113 Middle East & Africa Monoclonal Antibody Discovery & Analysis Market by Value, 2022-2032 (US$ mn, AGR (%))
Figure 114 Middle East & Africa Monoclonal Antibody Discovery & Analysis Market by Country, 2022-2032 (US$ mn, AGR (%))
Figure 115 Middle East & Africa Monoclonal Antibody Discovery & Analysis Market by Business Type, 2022-2032 (US$ mn, AGR (%))
Figure 116 Middle East & Africa Monoclonal Antibody Discovery & Analysis Market by Application, 2022-2032 (US$ mn, AGR (%))
Figure 117 Middle East & Africa Monoclonal Antibody Discovery & Analysis Market by Platform, 2022-2032 (US$ mn, AGR (%))
Figure 118 Middle East & Africa Monoclonal Antibody Discovery & Analysis Market by Type, 2022-2032 (US$ mn, AGR (%))
Figure 119 South Africa Monoclonal Antibody Discovery & Analysis Market by Value, 2022-2032 (US$ mn, AGR (%))
Figure 120 Saudi Arabia Monoclonal Antibody Discovery & Analysis Market by Value, 2022-2032 (US$ mn, AGR (%))
Figure 121 Turkey Monoclonal Antibody Discovery & Analysis Market by Value, 2022-2032 (US$ mn, AGR (%))
Figure 122 Rest of Middle East & Africa Monoclonal Antibody Discovery & Analysis Market by Value, 2022-2032 (US$ mn, AGR (%))
Figure 123 Latin America Monoclonal Antibody Discovery & Analysis Market Attractiveness Index
Figure 124 Latin America Monoclonal Antibody Discovery & Analysis Market by Value, 2022-2032 (US$ mn, AGR (%))
Figure 125 Latin America Monoclonal Antibody Discovery & Analysis Market by Country, 2022-2032 (US$ mn, AGR (%))
Figure 126 Latin America Monoclonal Antibody Discovery & Analysis Market by Business Type, 2022-2032 (US$ mn, AGR (%))
Figure 127 Latin America Monoclonal Antibody Discovery & Analysis Market by Application, 2022-2032 (US$ mn, AGR (%))
Figure 128 Latin America Monoclonal Antibody Discovery & Analysis Market by Platform, 2022-2032 (US$ mn, AGR (%))
Figure 129 Latin America Monoclonal Antibody Discovery & Analysis Market by Type, 2022-2032 (US$ mn, AGR (%))
Figure 130 Brazil Monoclonal Antibody Discovery & Analysis Market by Value, 2022-2032 (US$ mn, AGR (%))
Figure 131 Mexico Monoclonal Antibody Discovery & Analysis Market by Value, 2022-2032 (US$ mn, AGR (%))
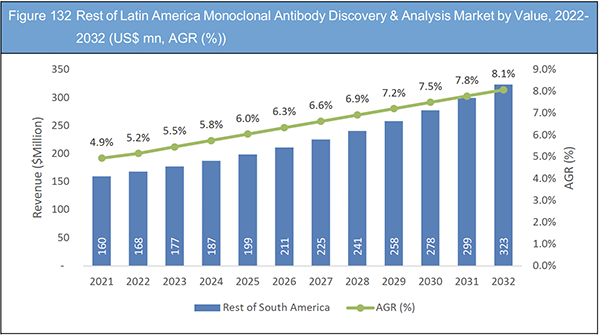
Figure 132 Rest of Latin America Monoclonal Antibody Discovery & Analysis Market by Value, 2022-2032 (US$ mn, AGR (%))
Figure 133 Monoclonal Antibody Discovery & Analysis Market: Company Share Analysis, 2021
Figure 134 AbbVie Inc.: Net Revenue, 2017-2021 (US$ million, AGR (%))
Figure 135 AbbVie Inc.: Gross Profit, 2017-2021 (US$ million, AGR (%))
Figure 136 AbbVie Inc.: R&D Expenses, 2017-2021 (US$ million, AGR (%))
Figure 138 Amgen Inc.: Net Revenue, 2017-2021 (US$ million, AGR (%))
Figure 139 Amgen Inc: Gross Profit, 2017-2021 (US$ million, AGR (%))
Figure 140 Amgen Inc. R&D Expenses, 2017-2021 (US$ million, AGR (%))
Figure 141 Amneal Pharmaceutical LLC: Net Revenue, 2017-2021 (US$ million, AGR (%))
Figure 142 Amneal Pharmaceutical LLC: R&D Expenses, 2017-2021 (US$ million, AGR (%))
Figure 143 Astrazeneca: Net Revenue, 2017-2021 (US$ million, AGR (%))
Figure 144 Astrazeneca: R&D Expenses, 2017-2021 (US$ million, AGR (%))
Figure 145 Astrazeneca: Regional Revenue Share, 2021 (%)
Figure 146 Bayer AG: Net Revenue, 2017-2021 (US$ million, AGR (%))
Figure 147 Bayer AG: R&D Expenses, 2017-2021 (US$ million, AGR (%))
Figure 148 Bayer AG Company: Regional Revenue Share, 2021 (%)
Figure 149 BIOGEN: Net Revenue, 2017-2021 (US$ million, AGR (%))
Figure 150 BIOGEN R&D Expenses, 2017-2021 (US$ million, AGR (%))
Figure 151 BIOGEN: Regional Revenue Share, 2021 (%)
Figure 152 Bristol-Myers Squibb Company: Net Revenue, 2017-2021 (US$ million, AGR (%))
Figure 153 Bristol-Myers Squibb Company: R&D Expenses, 2017-2021 (US$ million, AGR (%)
Figure 154 Bristol-Myers Squibb company: Regional Revenue Share, 2021 (%)
Figure 155 Eisai Co. Ltd: Net Revenue, 2017-2021 (US$ million, AGR (%))
Figure 156 Eisai Co.Ltd R&D Expenses, 2017-2021 (US$ million, AGR (%))
Figure 157 Eli-Lily & Company: Net Revenue, 2017-2021 (US$ million, AGR (%))
Figure 158 Eli-Lily & Company: R&D Expenses, 2017-2021 (US$ million, AGR (%))
Figure 159 Eli-Lily & Company Regional Revenue Share, 2021 (%)
Figure 160 F. Hoffman-La Roche Ltd.: Net Revenue, 2017-2021 (US$ million, AGR (%))
Figure 161 F. Hoffman-La Roche Ltd.: R&D Expenses, 2017-2021 (US$ million, AGR (%))
Figure 162 F. Hoffman-La Roche Ltd.: Regional Revenue Share, 2021 (%)
Figure 163 GlaxoSmithKline plc: Net Revenue, 2018-2021 (US$ million, AGR (%))
Figure 164 GlaxoSmithKline plc: R&D Expenses, 2017-2021 (US$ million, AGR (%))
Figure 165 GlaxoSmithKline plc: Regional Revenue Share, 2021 (%)
Figure 166 Johnson & Johnson Ltd: Net Revenue, 2017-2021 (US$ million, AGR (%))
Figure 167 Johnson & Johnson Ltd: R&D Expenses, 2017-2021 (US$ million, AGR (%))
Figure 168 Johnson & Johnson Ltd: Regional Revenue Share, 2021 (%)
Figure 169 Viatris Inc.: Net Revenue, 2017-2021 (US$ million, AGR (%))
Figure 170 Viatris Inc.: R&D Expenses, 2017-2021 (US$ million, AGR (%))
Figure 171 Novartis AG.: Net Revenue, 2017-2021 (US$ million, AGR (%))
Figure 172 Novartis AG.: R&D Expenses, 2017-2021 (US$ million, AGR (%))
Figure 173 Novartis AG.: Regional Revenue Share, 2021 (%)
Figure 174 Pfizer Inc.: Net Revenue, 2017-2021 (US$ million, AGR (%))
Figure 175 Pfizer Inc.: Regional Revenue Share, 2021 (%)
Figure 176 Regeneron Pharmaceutical Inc: Net Revenue, 2017-2021 (US$ million, AGR (%))
Figure 177 Regeneron Pharmaceutical Inc: R&D Expenses, 2017-2021 (US$ million, AGR (%))
Figure 178 Sanofi S.A.: Net Revenue, 2017-2021 (US$ million, AGR (%))
Figure 179 Sanofi S.A.: R&D Expenses, 2017-2021 (US$ million, AGR (%))
Figure 180 Sanofi S.A.: Regional Revenue Share, 2021 (%)
Figure 181 Teva Pharmaceutical Industries Ltd.: Net Revenue, 2017-2021 (US$ million, AGR (%))
Figure 182 Teva Pharmaceutical Industries Ltd.: R&D Expenses, 2017-2021 (US$ million, AGR (%))
Figure 183 Teva Pharmaceutical Industries Ltd.: Regional Revenue Share, 2021 (%)
List of Companies Profiled in the report
AbbVie Inc.
Amgen Inc.
Amneal Pharmaceutical LLC
AstraZeneca
Bayer AG
BIOGEN
Bristol- Myers Squibb company
Eisai Co. Ltd.
Eli Lilly and Company
F. Hoffman-La Roche Ltd.
GlaxoSmithKline plc
Johnson & Johnson Ltd.
Lupin Limited
Viatris Inc.
Novartis AG
Pfizer Inc.
Regeneron Pharmaceuticals Inc.
Sanofi S.A.
Teva Pharmaceutical Industries Ltd.
Zydus Lifesciences Limited
List of Other Companies Mentioned in the report
Abeona Therapeutics
Acucela
Adaptimmune Therapeutics
Autolus
AveXis
BioCancell
Biomay
Biomiga
BioReliance
Biotec Services International
Celladon
Cellectis
Cellular Biomedicine Group
Delphi Genetics
Department of Neuroscience, University of Minnesota
Desktop Genetics
DNAtrix
Elixirgen Scientific
Epeius Biotechnologies
EUFETS
Eurofins Genomics
South American Society of Gene and Cell Therapy
GEG Tech
Genable Technologies
Immune Design
Immune Technology
ImmunoGenes
Immunomic Therapeutics
Inbiomed
VIVEbiotech
Voyager Therapeutics
Waisman Biomanufacturing
Xpress Biologics
List of Associations Mentioned in the Report
Association of British Pharmaceutical Industry (ABPI)
Central Drugs Standard Control Organization (CDSCO)
Department of Health and Family Welfare
Development and Reform Commission (NDRC)
South American Commission
South American Medicines Agency (EMA)
Food and Drug Administration (US FDA)
Indian Drug Manufacturer's Association (IDMA)
International Society of Pharmaceutical Engineering (IPSE)
Korea Food and Drug Administration (KFDA)
Korea Pharmaceutical Manufacturer's Association (KPMA)
Medicines and Healthcare Products Regulatory Agency (MHRA)
Medicines Manufacturing Industry Partnership (MMIP)
Ministry of Health (MOH)
Ministry of Health, Labor and Welfare (MHLW)
Ministry of Industry and Information Technology (MIIT)
Pharmaceutical and Medical Devices Agency (PMDA)
World Health Organization (WHO)