The global military smart weapons market was valued at US$xx million in 2020 and is projected to grow at a CAGR of xx% during the forecast period 2021-2031. Availability of upgrade kits for modernizing existing weapons and military vehicles, investment in advanced missile defence systems and interceptor missiles, increasing demand for miniaturised precision guided weapons, and increasing demand for greater precision to alleviate collateral damage, are some of the major factors that boosting the growth of the global military smart weapons market.
How has COVID-19 had a significant negative impact on the Military Smart Weapons Market?
The COVID-19 pandemic has a negative impact on the military smart weapons market globally. As a result of the COVID-19 outbreak, which has resulted in tight border controls, instability on the stock market, and country-wide lockdowns, this pandemic has hampered the production and distribution of smart weapons.
Companies are concerned about supply and demand gaps caused by the COVID-19 epidemic. Military smart weapons are highly sophisticated and technologically advanced military platforms and are consequentially incredibly costly to procure. Once procured, the constant need to maintain them can also be financially burdensome. Consequentially, the most advanced military smart weapons are the preserve of economically developed countries and inaccessible for less-economically developed countries. This means that the military smart weapons market lacks the universality of other defence markets.
This report includes data analysis and invaluable insight into how COVID-19 will affect your industry. Access this report today.
To access the data contained in this document please email contactus@visiongain.com
How this Report Will Benefit you?
Visiongain’s 380+ page report provides 236 tables and 262+ charts/graphs. Our new study is suitable for anyone requiring commercial, in-depth analyses for the global military smart weapons market, along with detailed segment analysis in the market. Our new study will help you evaluate the overall global and regional market for military smart weapons. Get the financial analysis of the overall market and different segments including platform and type and capture higher market share. We believe that high opportunity remains in this fast-growing military smart weapons market. See how to use the existing and upcoming opportunities in this market to gain revenue benefits in the near future. Moreover, the report would help you to improve your strategic decision-making, allowing you to frame growth strategies, reinforce the analysis of other market players, and maximise the productivity of the company.

What are the current market drivers?
Easy access to upgrade kits for modernizing existing weapons and systems, emergence of security dilemma politics, increasing adoption of advanced missile defence systems and interceptor missiles, rising penetration of miniaturised precision guided weapons, and growth in the need for greater precision to alleviate collateral damage, are some of the major factors that boosting the growth of the global military smart weapons market.
The demand for advanced weaponry technology has been increased at a significant rate owing to need for modern defense solutions and conflict resolution. In addition, pressure across the globe to reduce human causalities during conflicts are catalysing the growth of the military smart weapon market. Apart from human causalities, these weapons help in minimizing the risk to the assets.
Need industry data? Please contact us today.
Where are the market opportunities?
Rising investment on development of advanced weapons and increasing research and development activities undertaken by universities and organization to innovate and introduce next generation warfare equipment is presenting opportunities to key players operating in the military smart weapon industry. Further, prominent players in collaboration with defense departments across major and emerging countries are conducting testing of various smart weapon prototypes as a part of first stage of the overall development process.
With the advent of advanced weapon technologies, the dynamics of global security has been changed drastically among the super power countries. In addition, technological evolution has opened a gateway to intelligent and precise wars without much escalation and resources to attain military objectives. Comparatively, smart weapons are more precise and accurate than conventional weapons and require a smaller number of soldiers to achieve military targets. Aforementioned reasons smart weapons are anticipated to replace weapons among militaries across the globe.
Competitive Landscape
The major players operating in the military smart weapons market are BAE Systems, Boeing, General Dynamics Corporation, Kongsberg Gruppen, L-3 Communications Holdings, Inc., Lockheed Martin Corporation, MBDA, Northrop Grumman Corporation, Orbital ATK, Rafael Advanced Defense Systems Ltd., Raytheon, Rheinmetall Ag, Textron Inc, and Thales Group.
Prominent companies operating in the military smart weapons market have adopted various strategies comprising substantial investment in R&D, partnerships, collaborations, geographical and portfolio expansion, and new product launch. For instance, in March 2021, General Dynamics Ordnance and Tactical Systems (OTS) signed a partnership agreement with Dynamit Nobel Defence GmbH (DND) to develop and provide advanced weapons for warfighters to enhance their capabilities during war.
Companies Profiled in the Report:
• BAE Systems
• Boeing
• General Dynamics Corporation
• Kongsberg Gruppen
• L-3 Communications Holdings, Inc.
• Lockheed Martin Corporation
• MBDA
• Northrop Grumman Corporation
• Orbital ATK
• Rafael Advanced Defense Systems Ltd.
• Raytheon
• Rheinmetall Ag
• Textron Inc,
• Thales Group
To access the data contained in this document please email contactus@visiongain.com
Buy our report today Military Smart Weapons Market Report 2021-2031: Forecasts by Platform (Land-Based, Airborne, Naval), by Type (Radar-Guided, GPS/INSGuided, Infrared-Guided, Laser-Guided, Other) AND Regional and Leading National Market Analysis PLUS Analysis of Leading Military Smart Weapons Companies AND COVID-19 Recovery Scenarios. Avoid missing out by staying informed – order our report now.
Visiongain is a trading partner with the US Federal Government
CCR Ref number: KD4R6
Do you have any custom requirements we can help you with? Any need for a specific country, geo region, market segment or specific company information? Contact us today, we can discuss your needs and see how we can help: sara.peerun@visiongain.com
1. Report Overview
1.1. Introduction to Military Smart Weapons Market
1.2. Military Smart Weapons Market Definition
1.3. Why You Should Read This Report
1.4. What This Report Delivers
1.5. Key Questions Answered by This Analytical Report Include:
1.6. Who is This Report For?
1.7. Methodology
1.7.1. Primary Research
1.7.2. Secondary Research
1.7.3. Market Evaluation & Forecasting Methodology
1.8. Frequently Asked Questions (FAQs)
1.9. Associated Visiongain Reports
1.10. About Visiongain
2. Executive Summary
2.1. Market Outlook
2.2. Key Trends
2.3. Competitive Landscape
2.4. Covid-19 Impact
2.4.1. “V” Shaped Recovery
2.4.2. “U” Shaped Recovery
2.4.3. “W” Shaped Recovery
2.4.4. “L” Shaped Recovery
3. Market Dynamics
3.1. Drivers
3.1.1. Availability of Upgrade Kits for Modernizing Existing Weapons and Military Vehicles
3.1.2. The Military Smart Weapons Market is Driven by Security Dilemma Politics
3.1.3. Investment in Advanced Missile Defence Systems and Interceptor Missiles will be a Major Source of Growth
3.1.4. Increasing Demand for Miniaturised Precision Guided Weapons
3.1.5. Increasing Demand for Greater Precision to Alleviate Collateral Damage
3.2. Restraints
3.2.1. The Most Advanced Smart Weapons are Costly to Procure, Integrate and Operate
3.2.2. Selling Military Smart Weapons to Nations with Poor Human Rights Records Remains Controversial
3.3. Opportunities
3.3.1. Increasing Research and Development Activities
3.3.2. Growing Demand for Smart Weapons Across Emerging Countries
3.3.3. Replacement of Ageing Weapons
3.4. SWOT Analysis
3.4.1. Strengths
3.4.1.1. Developed Nations Continuously Investing in Military Smart Weapon Development
3.4.1.2. Intensifying Security Threats
3.4.1.3. Adequate Manufacturing Infrastructure Especially in Developed Countries
3.4.1.4. Sufficient R&D Facilities
3.4.1.5. Large Pool of Skilled Workforce
3.4.2. Weakness
3.4.2.1. Production Related Issues
3.4.2.2. Weapon Procurement and Defence Policies Conflicts
3.4.2.3. Huge Import by Developing Countries
3.4.2.4. Minimal Adoption of Advanced Technologies Especially in Developing Countries
3.4.2.5. Decline in R&D Investments Due to Pandemic
3.4.3. Opportunities
3.4.3.1. Adoption of Digital Technologies
3.4.3.2. Smart Weapons Can Replace Aging Weapons and Missiles Systems
3.4.4. Threats
3.4.4.1. Emergence of COVID-19 and Trade War between Leading Nations
3.4.4.2. New smart weapons orders are anticipated to remain weak during the pandemic
3.5. PEST Analysis
3.5.1. Political Factors Impacting Military Smart Weapons Market
3.5.1.1. United States Continuous to be the Primary Growth Driver for the Military Smart Weapon Industry
3.5.1.2. Disruption in Supply Chains Especially European Region Due to Brexit
3.5.1.3. Regulatory Compliances, Policies, and Restrictions in Weapon Industry
3.5.2. Economical
3.5.2.1. Fall in Oil Trade to Decline the Rate of Defence Spending
3.5.2.2. Continuous Fluctuations in Foreign Currency Exchange Rates
3.5.3. Social
3.5.3.1. Environmental Impact of Manufacturing Operations
3.5.3.2. Competition for Skilled Workforce in the Weapon Manufacturing Industry
3.5.4. Technological
3.5.4.1. Digitization of Weapon Manufacturing Process
3.5.4.2. Rising Momentum of Additive Manufacturing for Weapon Manufacturing
3.5.4.3. Increasing Adoption of Laser Equipped Defence Systems and Weapons
4. Global Military Smart Weapons Market Analysis and Forecast to 2031, by Platform (Pre COVID and V, U, W and L COVID Recovery Scenarios)
4.1. Market Overview
4.2. Land-Based
4.2.1. Increasing in Adoption of Smart Weapons to Enhance Efficiency in Hazardous Environment
4.3. Airborne
4.3.1. Increasing Investment on Smart Weapons to Counter UAVs
4.4. Naval
4.4.1. Growing Focus of Navy Segment to Strengthen their Naval Strike Missile, Standard Missile, and Cruise Missile Capabilities
5. Global Military Smart Weapons Market Analysis and Forecast to 2031, by Type (Pre COVID and V, U, W and L COVID Recovery Scenarios)
5.1. Market Overview
5.2. Radar-Guided
5.2.1. High Spending on Radar-Guided Military Smart Weapons Will Drive the Market Growth at a Significant Rate
5.3. GPS/INS-Guided
5.3.1. The Technological Complexities and the Cost Involved in GPS Guided Weapon Technology Limit its Adoption to a Certain Extent Especially in Emerging Countries
5.4. Infrared-Guided
5.4.1. Infrared-Guided Military Smart Weapons Segment is Anticipated to Grow at a Healthy CAGR over the Forecast Period
5.5. Laser-Guided
5.5.1. Advancements in Laser Technology is Anticipated to Boost the Adoption of Laser-Guided Military Smart Weapons During the Forecast Period
5.6. Other-Guided
6. Global Military Smart Weapons Market Forecast, 2021-2031
6.1. Global Military Smart Weapons Market Analysis and Forecast, to 2031 by Region (Pre COVID and V, U, W and L COVID Recovery Scenarios)
7. North America Military Smart Weapons Market Analysis and Forecast, to 2031 Pre COVID and V, U, W and L COVID Recovery Scenarios)
7.1. Modernization of Military Forces is Increasing Spending on Smart Weapons
7.2. North America Military Smart Weapons Market Size and Forecast by Country
7.3. North America Military Smart Weapons Market Size and Forecast by Platform
7.4. North America Military Smart Weapons Market Size and Forecast by Type
7.5. U.S. Military Smart Weapons Market
7.5.1. Increasing Weapon Deals is Driving the Market Growth
7.5.2. Increasing Investment on Advanced Missiles
7.6. Canada Military Smart Weapons Market
7.6.1. Advancements in Weaponry for Military
7.6.2. Investing on Smart Weaponry
8. Europe Military Smart Weapons Market Analysis and Forecast, to 2031 Pre COVID and V, U, W and L COVID Recovery Scenarios)
8.1. Increasing Number of Defense Projects
8.2. Europe Military Smart Weapons Market Size and Forecast by Country
8.3. Europe Military Smart Weapons Market Size and Forecast by Platform
8.4. Europe Military Smart Weapons Market Size and Forecast by Type
8.5. UK Military Smart Weapons Market
8.5.1. Increasing Investment on Cruise Missiles
8.5.2. Rising Interest on Aftermarket Services for Smart Weapons
8.6. France Military Smart Weapons Market
8.6.1. Collaboration with Other Major Countries
8.6.2. Deployment of Laser Weapon
8.7. Germany Military Smart Weapons Market
8.7.1. Presence of Major Player
8.7.2. Procurement of Advanced Air Defense System
8.8. Italy Military Smart Weapons Market
8.8.1. Deployment of Advanced Systems
8.8.2. Joining Hands with Other Major Countries
8.9. Spain Military Smart Weapons Market
8.9.1. Technological Advancements in Defence Sector
8.10. Russia Military Smart Weapons Market
8.10.1. Development of Smart Weapons Included Directed Energy Weapons
8.11. Rest of Europe Military Smart Weapons Market
9. Asia-Pacific Military Smart Weapons Market Analysis and Forecast, to 2031 Pre COVID and V, U, W and L COVID Recovery Scenarios)
9.1. Rising Disputes Among Major Asian Countries
9.2. Asia-Pacific Military Smart Weapons Market Size and Forecast by Country
9.3. Asia-Pacific Military Smart Weapons Market Size and Forecast by Platform
9.4. Asia-Pacific Military Smart Weapons Market Size and Forecast by Type
9.5. China Military Smart Weapons Market
9.5.1. Focused Towards Advanced Combat Systems and Solutions
9.5.2. Development and Testing of Advanced Systems
9.6. India Military Smart Weapons Market
9.6.1. Increasing Threat from Neighbouring Countries and Enhancement of Surveillance Systems
9.6.2. Procurement of Advanced Defence Systems
9.7. South Korea Military Smart Weapons Market
9.7.1. Focused Towards Enhancing Military Capabilities
9.7.2. Procurement of Advanced Weapons from Major Countries
9.8. Japan Military Smart Weapons Market
9.8.1. Increasing Application of Smart Weapons
9.8.2. Investment on warship weapons
9.9. Rest of Asia-Pacific Military Smart Weapons Market
10. Middle East Military Smart Weapons Market Analysis and Forecast, to 2031 Pre COVID and V, U, W and L COVID Recovery Scenarios)
10.1. UAE Dominated the Overall Middle East Military Smart Weapon Market in 2021
10.2. Middle East Military Smart Weapons Market Size and Forecast by Country
10.3. Middle East Military Smart Weapons Market Size and Forecast by Platform
10.4. Middle East Military Smart Weapons Market Size and Forecast by Type
10.5. UAE Military Smart Weapons Market
10.5.1. Weapon Manufacturers in the UAE are Inclined Towards Innovating Weapon Technologies to Establish Trade Relationship with Foreign Countries
10.6. Saudi Arabia Military Smart Weapons Market
10.6.1. Defence Organization in the Country is Focused Towards Enhancing its Domestic Weapon Technologies to Ensure Safety and Outperform Opponents
10.7. Qatar Military Smart Weapons Market
10.7.1. Increasing Border Conflicts from Neighbour Countries is Encouraging Qatar to Expand Their Smart Weapon Portfolio
10.8. Rest of Middle East Military Smart Weapons Market
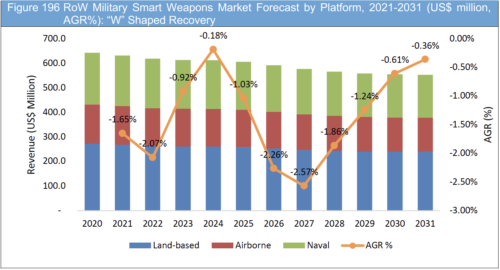
11. RoW Military Smart Weapons Market Analysis and Forecast, to 2031 Pre COVID and V, U, W and L COVID Recovery Scenarios)
11.1. Africa Military Smart Weapons Market
11.1.1. Poor Economic Conditions and Cuts in Defence Budget Can Limit the Market Growth
11.2. Latin America Military Smart Weapons Market
11.2.1. Increasing Uptake of Modern Warfare Technologies
11.3. RoW Military Smart Weapons Market Size and Forecast by Platform
11.4. RoW Military Smart Weapons Market Size and Forecast by Type
12. Company Profiles
12.1. Company Share Analysis
12.2. Military Smart Weapons Market Recent Developments, 2017-2021
12.3. Boeing
12.3.1. Company Snapshot
12.3.2. Company Overview
12.3.3. Financial Analysis
12.3.3.1. Net Revenue, (2016-2020)
12.3.3.2. Regional Revenue/Market Share, (2018-2020)
12.3.3.3. Segmental Revenue/Market Share, (2018-2020)
12.3.3.4. Gross Profit, (2016-2020)
12.3.3.5. R&D, (2016-2020)
12.3.3.6. EBITDA, (2016-2020)
12.3.4. Product Benchmarking
12.3.5. Recent Developments (2017-2021)
12.4. General Dynamic Corporation
12.4.1. Company Snapshot
12.4.2. Company Overview
12.4.3. Financial Analysis
12.4.3.1. Net Revenue, (2016-2020)
12.4.3.2. Regional Revenue/Market Share, (2018-2020)
12.4.3.3. Segmental Revenue/Market Share, (2018-2020)
12.4.3.4. Gross Profit, (2016-2020)
12.4.3.5. EBITDA, (2016-2020)
12.4.4. Product Benchmarking
12.4.5. Recent Developments (2017-2021)
12.5. Kongsberg Gruppen
12.5.1. Company Snapshot
12.5.2. Company Overview
12.5.3. Financial Analysis
12.5.3.1. Net Revenue, (2016-2020)
12.5.3.2. Regional Revenue/Market Share, (2018-2020)
12.5.3.3. Segmental Revenue/Market Share, (2018-2020)
12.5.3.4. Gross Profit, (2016-2020)
12.5.3.5. EBITDA, (2016-2020)
12.5.4. Product Benchmarking
12.5.5. Recent Developments (2017-2021)
12.6. Lockheed Martin Corporation
12.6.1. Company Snapshot
12.6.2. Company Overview
12.6.3. Financial Analysis
12.6.3.1. Net Revenue, (2016-2020)
12.6.3.2. Regional Revenue/Market Share, (2018-2020)
12.6.3.3. Segmental Revenue/Market Share, (2018-2020)
12.6.3.4. Gross Profit, (2016-2020)
12.6.3.5. EBITDA, (2016-2020)
12.6.4. Product Benchmarking
12.6.5. Recent Developments (2017-2021)
12.7. MBDA
12.7.1. Company Snapshot
12.7.2. Company Overview
12.7.3. Product Benchmarking
12.7.4. Recent Developments (2017-2021)
12.8. Northrop Grumman Corporation
12.8.1. Company Snapshot
12.8.2. Company Overview
12.8.3. Financial Analysis
12.8.3.1. Net Revenue, (2016-2020)
12.8.3.2. Regional Revenue/Market Share, (2018-2020)
12.8.3.3. Segmental Revenue/Market Share, (2018-2020)
12.8.3.4. Gross Profit, (2016-2020)
12.8.3.5. EBITDA, (2016-2020)
12.8.4. Product Benchmarking
12.8.5. Recent Developments (2017-2021)
12.9. BAE Systems
12.9.1. Company Snapshot
12.9.2. Company Overview
12.9.3. Financial Analysis
12.9.3.1. Net Revenue, (2016-2020)
12.9.3.2. Regional Revenue/Market Share, (2018-2020)
12.9.3.3. Segmental Revenue/Market Share, (2018-2020)
12.9.3.4. Gross Profit, (2016-2020)
12.9.3.5. EBITDA, (2016-2020)
12.9.4. Product Benchmarking
12.9.5. Recent Developments (2017-2021)
12.10. Raytheon
12.10.1. Company Snapshot
12.10.2. Company Overview
12.10.3. Financial Analysis
12.10.3.1. Net Revenue, (2016-2020)
12.10.3.2. Regional Revenue/Market Share, (2018-2020)
12.10.3.3. Segmental Revenue/Market Share, (2018-2020)
12.10.3.4. Gross Profit, (2016-2020)
12.10.3.5. R&D, (2016-2020)
12.10.3.6. EBITDA, (2016-2020)
12.10.4. Product Benchmarking
12.10.5. Recent Developments (2017-2021)
12.11. Textron Inc,
12.11.1. Company Snapshot
12.11.2. Company Overview
12.11.3. Financial Analysis
12.11.3.1. Net Revenue, (2016-2020)
12.11.3.2. Regional Revenue/Market Share, (2018-2020)
12.11.3.3. Segmental Revenue/Market Share, (2018-2020)
12.11.3.4. Gross Profit, (2016-2020)
12.11.3.5. EBITDA, (2016-2020)
12.11.4. Product Benchmarking
12.11.5. Recent Developments (2017-2021)
12.12. Orbital ATK
12.12.1. Company Snapshot
12.12.2. Company Overview
12.12.3. Product Benchmarking
12.12.4. Recent Developments (2017-2021)
12.13. L-3 Communications Holdings, Inc
12.13.1. Company Snapshot
12.13.2. Company Overview
12.13.3. Financial Analysis
12.13.3.1. Net Revenue, (2016-2020)
12.13.3.2. Regional Revenue/Market Share, (2018-2020)
12.13.3.3. Segmental Revenue/Market Share, (2018-2020)
12.13.3.4. Gross Profit, (2016-2020)
12.13.3.5. EBITDA, (2016-2020)
12.13.4. Product Benchmarking
12.13.5. Recent Developments (2017-2021)
12.14. Thales Group
12.14.1. Company Snapshot
12.14.2. Company Overview
12.14.3. Financial Analysis
12.14.3.1. Net Revenue, (2016-2020)
12.14.3.2. Regional Revenue/Market Share, (2018-2020)
12.14.3.3. Segmental Revenue/Market Share, (2018-2020)
12.14.3.4. Gross Profit, (2016-2020)
12.14.3.5. R&D, (2016-2020)
12.14.3.6. EBITDA, (2016-2020)
12.14.4. Product Benchmarking
12.14.5. Recent Developments (2017-2021)
12.15. Rheinmetall Ag
12.15.1. Company Snapshot
12.15.2. Company Overview
12.15.3. Financial Analysis
12.15.3.1. Net Revenue, (2016-2020)
12.15.3.2. Regional Revenue/Market Share, (2018-2020)
12.15.3.3. Segmental Revenue/Market Share, (2018-2020)
12.15.3.4. Gross Profit, (2016-2020)
12.15.3.5. EBITDA, (2016-2020)
12.15.4. Product Benchmarking
12.15.5. Recent Developments (2017-2021)
12.16. Rafael Advanced Defense Systems Ltd.
12.16.1. Company Snapshot
12.16.2. Company Overview
12.16.3. Product Benchmarking
12.16.4. Recent Developments (2017-2021)
13. Conclusion and Recommendations
14. Glossary
List of Tables
Global Military Smart Weapons Market Snapshot, 2021 & 2031 (US$ million, CAGR %)
Global Military Smart Weapons Market Forecast by Platform, 2021-2031 (US$ million, AGR %, CAGR %)
Global Military Smart Weapons Market for Land-Based Segment Forecast, 2021-2031 (US$ mn, AGR%, CAGR%)
Global Military Smart Weapons Market for Land-Based Segment Forecast, 2021-2031 (US$ mn, AGR%, CAGR%): "V" Shaped Recovery
Global Military Smart Weapons Market for Land-Based Segment Forecast, 2021-2031 (US$ mn, AGR%, CAGR%): "U" Shaped Recovery
Global Military Smart Weapons Market for Land-Based Segment Forecast, 2021-2031 (US$ mn, AGR%, CAGR%): "W" Shaped Recovery
Global Military Smart Weapons Market for Land-Based Segment Forecast, 2021-2031 (US$ mn, AGR%, CAGR%): "L" Shaped Recovery
Global Military Smart Weapons Market for Airborne Segment Forecast, 2021-2031 (US$ mn, AGR%, CAGR%)
Global Military Smart Weapons Market for Airborne Segment Forecast, 2021-2031 (US$ mn, AGR%, CAGR%): "V" Shaped Recovery
Global Military Smart Weapons Market for Airborne Segment Forecast, 2021-2031 (US$ mn, AGR%, CAGR%): "U" Shaped Recovery
Global Military Smart Weapons Market for Airborne Segment Forecast, 2021-2031 (US$ mn, AGR%, CAGR%): "W" Shaped Recovery
Global Military Smart Weapons Market for Airborne Segment Forecast, 2021-2031 (US$ mn, AGR%, CAGR%): "L" Shaped Recovery
Global Military Smart Weapons Market for Naval Segment Forecast, 2021-2031 (US$ mn, AGR%, CAGR%)
Global Military Smart Weapons Market for Naval Segment Forecast, 2021-2031 (US$ mn, AGR%, CAGR%): "V" Shaped Recovery
Global Military Smart Weapons Market for Naval Segment Forecast, 2021-2031 (US$ mn, AGR%, CAGR%): "U" Shaped Recovery
Global Military Smart Weapons Market for Naval Segment Forecast, 2021-2031 (US$ mn, AGR%, CAGR%): "W" Shaped Recovery
Global Military Smart Weapons Market for Naval Segment Forecast, 2021-2031 (US$ mn, AGR%, CAGR%): "L" Shaped Recovery
Global Military Smart Weapons Market Forecast by Type, 2021-2031 (US$ mn, AGR%, CAGR%)
Global Military Smart Weapons Market for Radar-Guided Segment Forecast, 2021-2031 (US$ mn, AGR%, CAGR%)
Global Military Smart Weapons Market for Radar-Guided Segment Forecast, 2021-2031 (US$ mn, AGR%, CAGR%): "V" Shaped Recovery
Global Military Smart Weapons Market for Radar-Guided Segment Forecast, 2021-2031 (US$ mn, AGR%, CAGR%): "U" Shaped Recovery
Global Military Smart Weapons Market for Radar-Guided Segment Forecast, 2021-2031 (US$ mn, AGR%, CAGR%): "W" Shaped Recovery
Global Military Smart Weapons Market for Radar-Guided Segment Forecast, 2021-2031 (US$ mn, AGR%, CAGR%): "L" Shaped Recovery
Global Military Smart Weapons Market for GPS/INS-Guided Segment Forecast, 2021-2031 (US$ mn, AGR%, CAGR%)
Global Military Smart Weapons Market for GPS/INS-Guided Segment Forecast, 2021-2031 (US$ mn, AGR%, CAGR%): "V" Shaped Recovery
Global Military Smart Weapons Market for GPS/INS-Guided Segment Forecast, 2021-2031 (US$ mn, AGR%, CAGR%): "U" Shaped Recovery
Global Military Smart Weapons Market for GPS/INS-Guided Segment Forecast, 2021-2031 (US$ mn, AGR%, CAGR%): "W" Shaped Recovery
Global Military Smart Weapons Market for GPS/INS-Guided Segment Forecast, 2021-2031 (US$ mn, AGR%, CAGR%): "L" Shaped Recovery
Global Military Smart Weapons Market for Infrared-Guided Segment Forecast, 2021-2031 (US$ mn, AGR%, CAGR%)
Global Military Smart Weapons Market for Infrared-Guided Segment Forecast, 2021-2031 (US$ mn, AGR%, CAGR%): "V" Shaped Recovery
Global Military Smart Weapons Market for Infrared-Guided Segment Forecast, 2021-2031 (US$ mn, AGR%, CAGR%): "U" Shaped Recovery
Global Military Smart Weapons Market for Infrared-Guided Segment Forecast, 2021-2031 (US$ mn, AGR%, CAGR%): "W" Shaped Recovery
Global Military Smart Weapons Market for Infrared-Guided Segment Forecast, 2021-2031 (US$ mn, AGR%, CAGR%): "L" Shaped Recovery
Global Military Smart Weapons Market for Laser-Guided Segment Forecast, 2021-2031 (US$ mn, AGR%, CAGR%)
Global Military Smart Weapons Market for Laser-Guided Segment Forecast, 2021-2031 (US$ mn, AGR%, CAGR%): "V" Shaped Recovery
Global Military Smart Weapons Market for Laser-Guided Segment Forecast, 2021-2031 (US$ mn, AGR%, CAGR%): "U" Shaped Recovery
Global Military Smart Weapons Market for Laser-Guided Segment Forecast, 2021-2031 (US$ mn, AGR%, CAGR%): "W" Shaped Recovery
Global Military Smart Weapons Market for Laser-Guided Segment Forecast, 2021-2031 (US$ mn, AGR%, CAGR%): "L" Shaped Recovery
Global Military Smart Weapons Market for Other-Guided Segment Forecast, 2021-2031 (US$ mn, AGR%, CAGR%)
Global Military Smart Weapons Market for Other-Guided Segment Forecast, 2021-2031 (US$ mn, AGR%, CAGR%): "V" Shaped Recovery
Global Military Smart Weapons Market for Other-Guided Segment Forecast, 2021-2031 (US$ mn, AGR%, CAGR%): "U" Shaped Recovery
Global Military Smart Weapons Market for Other-Guided Segment Forecast, 2021-2031 (US$ mn, AGR%, CAGR%): "W" Shaped Recovery
Global Military Smart Weapons Market for Other-Guided Segment Forecast, 2021-2031 (US$ mn, AGR%, CAGR%): "L" Shaped Recovery
Global Military Smart Weapons Market Forecast by Region, 2021-2031 (US$ mn, AGR%, CAGR%)
Global Military Smart Weapons Market Forecast by Region, 2021-2031 (US$ mn, AGR%, CAGR%): "V" Shaped Recovery
Global Military Smart Weapons Market Forecast by Region, 2021-2031 (US$ mn, AGR%, CAGR%): "U" Shaped Recovery
Global Military Smart Weapons Market Forecast by Region, 2021-2031 (US$ mn, AGR%, CAGR%): "W" Shaped Recovery
Global Military Smart Weapons Market Forecast by Region, 2021-2031 (US$ mn, AGR%, CAGR%): "L" Shaped Recovery
North America Military Smart Weapons Market Forecast by Country, 2021-2031 (US$ mn, AGR%, CAGR%)
North America Military Smart Weapons Market Forecast by Platform, 2021-2031 (US$ mn, AGR%, CAGR%)
North America Military Smart Weapons Market Forecast by Platform, 2021-2031 (US$ mn, AGR%, CAGR%): "V" Shaped Recovery
North America Military Smart Weapons Market Forecast by Platform, 2021-2031 (US$ mn, AGR%, CAGR%): "U" Shaped Recovery
North America Military Smart Weapons Market Forecast by Platform, 2021-2031 (US$ mn, AGR%, CAGR%): "W" Shaped Recovery
North America Military Smart Weapons Market Forecast by Platform, 2021-2031 (US$ mn, AGR%, CAGR%): "L" Shaped Recovery
North America Military Smart Weapons Market Forecast by Type, 2021-2031 (US$ mn, AGR%, CAGR%)
North America Military Smart Weapons Market Forecast by Type, 2021-2031 (US$ mn, AGR%, CAGR%): "V" Shaped Recovery
North America Military Smart Weapons Market Forecast by Type, 2021-2031 (US$ mn, AGR%, CAGR%): "U" Shaped Recovery
North America Military Smart Weapons Market Forecast by Type, 2021-2031 (US$ mn, AGR%, CAGR%): "W" Shaped Recovery
North America Military Smart Weapons Market Forecast by Type, 2021-2031 (US$ mn, AGR%, CAGR%): "L" Shaped Recovery
U.S. Military Smart Weapons Market Forecast, 2021-2031 (US$ mn, AGR%, CAGR%)
U.S. Military Smart Weapons Market Forecast, 2021-2031 (US$ mn, AGR%, CAGR%): "V" Shaped Recovery
U.S. Military Smart Weapons Market Forecast, 2021-2031 (US$ mn, AGR%, CAGR%): "U" Shaped Recovery
U.S. Military Smart Weapons Market Forecast, 2021-2031 (US$ mn, AGR%, CAGR%): "W" Shaped Recovery
U.S. Military Smart Weapons Market Forecast, 2021-2031 (US$ mn, AGR%, CAGR%): "L" Shaped Recovery
Canada Military Smart Weapons Market Forecast, 2021-2031 (US$ mn, AGR%, CAGR%)
Canada Military Smart Weapons Market Forecast, 2021-2031 (US$ mn, AGR%, CAGR%): "V" Shaped Recovery
Canada Military Smart Weapons Market Forecast, 2021-2031 (US$ mn, AGR%, CAGR%): "U" Shaped Recovery
Canada Military Smart Weapons Market Forecast, 2021-2031 (US$ mn, AGR%, CAGR%): "W" Shaped Recovery
Canada Military Smart Weapons Market Forecast, 2021-2031 (US$ mn, AGR%, CAGR%): "L" Shaped Recovery
Europe Military Smart Weapons Market Forecast by Country, 2021-2031 (US$ mn, AGR%, CAGR%)
Europe Military Smart Weapons Market Forecast by Platform, 2021-2031 (US$ mn, AGR%, CAGR%)
Europe Military Smart Weapons Market Forecast by Platform, 2021-2031 (US$ mn, AGR%, CAGR%): "V" Shaped Recovery
Europe Military Smart Weapons Market Forecast by Platform, 2021-2031 (US$ mn, AGR%, CAGR%): "U" Shaped Recovery
Europe Military Smart Weapons Market Forecast by Platform, 2021-2031 (US$ mn, AGR%, CAGR%): "W" Shaped Recovery
Europe Military Smart Weapons Market Forecast by Platform, 2021-2031 (US$ mn, AGR%, CAGR%): "L" Shaped Recovery
Europe Military Smart Weapons Market Forecast by Type, 2021-2031 (US$ mn, AGR%, CAGR%)
Europe Military Smart Weapons Market Forecast by Type, 2021-2031 (US$ mn, AGR%, CAGR%): "V" Shaped Recovery
Europe Military Smart Weapons Market Forecast by Type, 2021-2031 (US$ mn, AGR%, CAGR%): "U" Shaped Recovery
Europe Military Smart Weapons Market Forecast by Type, 2021-2031 (US$ mn, AGR%, CAGR%): "W" Shaped Recovery
Europe Military Smart Weapons Market Forecast by Type, 2021-2031 (US$ mn, AGR%, CAGR%): "L" Shaped Recovery
UK Military Smart Weapons Market Forecast, 2021-2031 (US$ mn, AGR%, CAGR%)
UK Military Smart Weapons Market Forecast, 2021-2031 (US$ mn, AGR%, CAGR%): "V" Shaped Recovery
UK Military Smart Weapons Market Forecast, 2021-2031 (US$ mn, AGR%, CAGR%): "U" Shaped Recovery
UK Military Smart Weapons Market Forecast, 2021-2031 (US$ mn, AGR%, CAGR%): "W" Shaped Recovery
UK Military Smart Weapons Market Forecast, 2021-2031 (US$ mn, AGR%, CAGR%): "L" Shaped Recovery
France Military Smart Weapons Market Forecast, 2021-2031 (US$ mn, AGR%, CAGR%)
France Military Smart Weapons Market Forecast, 2021-2031 (US$ mn, AGR%, CAGR%): "V" Shaped Recovery
France Military Smart Weapons Market Forecast, 2021-2031 (US$ mn, AGR%, CAGR%): "U" Shaped Recovery
France Military Smart Weapons Market Forecast, 2021-2031 (US$ mn, AGR%, CAGR%): "W" Shaped Recovery
France Military Smart Weapons Market Forecast, 2021-2031 (US$ mn, AGR%, CAGR%): "L" Shaped Recovery
Germany Military Smart Weapons Market Forecast, 2021-2031 (US$ mn, AGR%, CAGR%)
Germany Military Smart Weapons Market Forecast, 2021-2031 (US$ mn, AGR%, CAGR%): "V" Shaped Recovery
Germany Military Smart Weapons Market Forecast, 2021-2031 (US$ mn, AGR%, CAGR%): "U" Shaped Recovery
Germany Military Smart Weapons Market Forecast, 2021-2031 (US$ mn, AGR%, CAGR%): "W" Shaped Recovery
Germany Military Smart Weapons Market Forecast, 2021-2031 (US$ mn, AGR%, CAGR%): "L" Shaped Recovery
Italy Military Smart Weapons Market Forecast, 2021-2031 (US$ mn, AGR%, CAGR%)
Italy Military Smart Weapons Market Forecast, 2021-2031 (US$ mn, AGR%, CAGR%): "V" Shaped Recovery
Italy Military Smart Weapons Market Forecast, 2021-2031 (US$ mn, AGR%, CAGR%): "U" Shaped Recovery
Italy Military Smart Weapons Market Forecast, 2021-2031 (US$ mn, AGR%, CAGR%): "W" Shaped Recovery
Italy Military Smart Weapons Market Forecast, 2021-2031 (US$ mn, AGR%, CAGR%): "L" Shaped Recovery
Spain Military Smart Weapons Market Forecast, 2021-2031 (US$ mn, AGR%, CAGR%)
Spain Military Smart Weapons Market Forecast, 2021-2031 (US$ mn, AGR%, CAGR%): "V" Shaped Recovery
Spain Military Smart Weapons Market Forecast, 2021-2031 (US$ mn, AGR%, CAGR%): "U" Shaped Recovery
Spain Military Smart Weapons Market Forecast, 2021-2031 (US$ mn, AGR%, CAGR%): "W" Shaped Recovery
Spain Military Smart Weapons Market Forecast, 2021-2031 (US$ mn, AGR%, CAGR%): "L" Shaped Recovery
Russia Military Smart Weapons Market Forecast, 2021-2031 (US$ mn, AGR%, CAGR%)
Russia Military Smart Weapons Market Forecast, 2021-2031 (US$ mn, AGR%, CAGR%): "V" Shaped Recovery
Russia Military Smart Weapons Market Forecast, 2021-2031 (US$ mn, AGR%, CAGR%): "U" Shaped Recovery
Russia Military Smart Weapons Market Forecast, 2021-2031 (US$ mn, AGR%, CAGR%): "W" Shaped Recovery
Russia Military Smart Weapons Market Forecast, 2021-2031 (US$ mn, AGR%, CAGR%): "L" Shaped Recovery
Rest of Europe Military Smart Weapons Market Forecast, 2021-2031 (US$ mn, AGR%, CAGR%)
Rest of Europe Military Smart Weapons Market Forecast, 2021-2031 (US$ mn, AGR%, CAGR%): "V" Shaped Recovery
Rest of Europe Military Smart Weapons Market Forecast, 2021-2031 (US$ mn, AGR%, CAGR%): "U" Shaped Recovery
Rest of Europe Military Smart Weapons Market Forecast, 2021-2031 (US$ mn, AGR%, CAGR%): "W" Shaped Recovery
Rest of Europe Military Smart Weapons Market Forecast, 2021-2031 (US$ mn, AGR%, CAGR%): "L" Shaped Recovery
Asia-Pacific Military Smart Weapons Market Forecast by Country, 2021-2031 (US$ mn, AGR%, CAGR%)
Asia-Pacific Military Smart Weapons Market Forecast by Platform, 2021-2031 (US$ mn, AGR%, CAGR%)
Asia-Pacific Military Smart Weapons Market Forecast by Platform, 2021-2031 (US$ mn, AGR%, CAGR%): "V" Shaped Recovery
Asia-Pacific Military Smart Weapons Market Forecast by Platform, 2021-2031 (US$ mn, AGR%, CAGR%): "U" Shaped Recovery
Asia-Pacific Military Smart Weapons Market Forecast by Platform, 2021-2031 (US$ mn, AGR%, CAGR%): "W" Shaped Recovery
Asia-Pacific Military Smart Weapons Market Forecast by Platform, 2021-2031 (US$ mn, AGR%, CAGR%): "L" Shaped Recovery
Asia-Pacific Military Smart Weapons Market Forecast by Type, 2021-2031 (US$ mn, AGR%, CAGR%)
Asia-Pacific Military Smart Weapons Market Forecast by Type, 2021-2031 (US$ mn, AGR%, CAGR%): "V" Shaped Recovery
Asia-Pacific Military Smart Weapons Market Forecast by Type, 2021-2031 (US$ mn, AGR%, CAGR%): "U" Shaped Recovery
Asia-Pacific Military Smart Weapons Market Forecast by Type, 2021-2031 (US$ mn, AGR%, CAGR%): "W" Shaped Recovery
Asia-Pacific Military Smart Weapons Market Forecast by Type, 2021-2031 (US$ mn, AGR%, CAGR%): "L" Shaped Recovery
China Military Smart Weapons Market Forecast, 2021-2031 (US$ mn, AGR%, CAGR%)
China Military Smart Weapons Market Forecast, 2021-2031 (US$ mn, AGR%, CAGR%): "V" Shaped Recovery
China Military Smart Weapons Market Forecast, 2021-2031 (US$ mn, AGR%, CAGR%): "U" Shaped Recovery
China Military Smart Weapons Market Forecast, 2021-2031 (US$ mn, AGR%, CAGR%): "W" Shaped Recovery
China Military Smart Weapons Market Forecast, 2021-2031 (US$ mn, AGR%, CAGR%): "L" Shaped Recovery
India Military Smart Weapons Market Forecast, 2021-2031 (US$ mn, AGR%, CAGR%)
India Military Smart Weapons Market Forecast, 2021-2031 (US$ mn, AGR%, CAGR%): "V" Shaped Recovery
India Military Smart Weapons Market Forecast, 2021-2031 (US$ mn, AGR%, CAGR%): "U" Shaped Recovery
India Military Smart Weapons Market Forecast, 2021-2031 (US$ mn, AGR%, CAGR%): "W" Shaped Recovery
India Military Smart Weapons Market Forecast, 2021-2031 (US$ mn, AGR%, CAGR%): "L" Shaped Recovery
South Korea Military Smart Weapons Market Forecast, 2021-2031 (US$ mn, AGR%, CAGR%)
South Korea Military Smart Weapons Market Forecast, 2021-2031 (US$ mn, AGR%, CAGR%): "V" Shaped Recovery
South Korea Military Smart Weapons Market Forecast, 2021-2031 (US$ mn, AGR%, CAGR%): "U" Shaped Recovery
South Korea Military Smart Weapons Market Forecast, 2021-2031 (US$ mn, AGR%, CAGR%): "W" Shaped Recovery
South Korea Military Smart Weapons Market Forecast, 2021-2031 (US$ mn, AGR%, CAGR%): "L" Shaped Recovery
Japan Military Smart Weapons Market Forecast, 2021-2031 (US$ mn, AGR%, CAGR%)
Japan Military Smart Weapons Market Forecast, 2021-2031 (US$ mn, AGR%, CAGR%): "V" Shaped Recovery
Japan Military Smart Weapons Market Forecast, 2021-2031 (US$ mn, AGR%, CAGR%): "U" Shaped Recovery
Japan Military Smart Weapons Market Forecast, 2021-2031 (US$ mn, AGR%, CAGR%): "W" Shaped Recovery
Japan Military Smart Weapons Market Forecast, 2021-2031 (US$ mn, AGR%, CAGR%): "L" Shaped Recovery
Rest of APAC Military Smart Weapons Market Forecast, 2021-2031 (US$ mn, AGR%, CAGR%)
Rest of APAC Military Smart Weapons Market Forecast, 2021-2031 (US$ mn, AGR%, CAGR%): "V" Shaped Recovery
Rest of APAC Military Smart Weapons Market Forecast, 2021-2031 (US$ mn, AGR%, CAGR%): "U" Shaped Recovery
Rest of APAC Military Smart Weapons Market Forecast, 2021-2031 (US$ mn, AGR%, CAGR%): "W" Shaped Recovery
Rest of APAC Military Smart Weapons Market Forecast, 2021-2031 (US$ mn, AGR%, CAGR%): "L" Shaped Recovery
Middle East Military Smart Weapons Market Forecast by Country, 2021-2031 (US$ mn, AGR%, CAGR%)
Middle East Military Smart Weapons Market Forecast by Platform, 2021-2031 (US$ mn, AGR%, CAGR%)
Middle East Military Smart Weapons Market Forecast by Platform, 2021-2031 (US$ mn, AGR%, CAGR%): "V" Shaped Recovery
Middle East Military Smart Weapons Market Forecast by Platform, 2021-2031 (US$ mn, AGR%, CAGR%): "U" Shaped Recovery
Middle East Military Smart Weapons Market Forecast by Platform, 2021-2031 (US$ mn, AGR%, CAGR%): "W" Shaped Recovery
Middle East Military Smart Weapons Market Forecast by Platform, 2021-2031 (US$ mn, AGR%, CAGR%): "L" Shaped Recovery
Middle East Military Smart Weapons Market Forecast by Type, 2021-2031 (US$ mn, AGR%, CAGR%)
Middle East Military Smart Weapons Market Forecast by Type, 2021-2031 (US$ mn, AGR%, CAGR%): "V" Shaped Recovery
Middle East Military Smart Weapons Market Forecast by Type, 2021-2031 (US$ mn, AGR%, CAGR%): "U" Shaped Recovery
Middle East Military Smart Weapons Market Forecast by Type, 2021-2031 (US$ mn, AGR%, CAGR%): "W" Shaped Recovery
Middle East Military Smart Weapons Market Forecast by Type, 2021-2031 (US$ mn, AGR%, CAGR%): "L" Shaped Recovery
UAE Military Smart Weapons Market Forecast, 2021-2031 (US$ mn, AGR%, CAGR%)
UAE Military Smart Weapons Market Forecast, 2021-2031 (US$ mn, AGR%, CAGR%): "V" Shaped Recovery
UAE Military Smart Weapons Market Forecast, 2021-2031 (US$ mn, AGR%, CAGR%): "U" Shaped Recovery
UAE Military Smart Weapons Market Forecast, 2021-2031 (US$ mn, AGR%, CAGR%): "W" Shaped Recovery
UAE Military Smart Weapons Market Forecast, 2021-2031 (US$ mn, AGR%, CAGR%): "L" Shaped Recovery
Saudi Arabia Military Smart Weapons Market Forecast, 2021-2031 (US$ mn, AGR%, CAGR%)
Saudi Arabia Military Smart Weapons Market Forecast, 2021-2031 (US$ mn, AGR%, CAGR%): "V" Shaped Recovery
Saudi Arabia Military Smart Weapons Market Forecast, 2021-2031 (US$ mn, AGR%, CAGR%): "U" Shaped Recovery
Saudi Arabia Military Smart Weapons Market Forecast, 2021-2031 (US$ mn, AGR%, CAGR%): "W" Shaped Recovery
Saudi Arabia Military Smart Weapons Market Forecast, 2021-2031 (US$ mn, AGR%, CAGR%): "L" Shaped Recovery
atar Military Smart Weapons Market Forecast, 2021-2031 (US$ mn, AGR%, CAGR%)
Qatar Military Smart Weapons Market Forecast, 2021-2031 (US$ mn, AGR%, CAGR%): "V" Shaped Recovery
Qatar Military Smart Weapons Market Forecast, 2021-2031 (US$ mn, AGR%, CAGR%): "U" Shaped Recovery
Qatar Military Smart Weapons Market Forecast, 2021-2031 (US$ mn, AGR%, CAGR%): "W" Shaped Recovery
Qatar Military Smart Weapons Market Forecast, 2021-2031 (US$ mn, AGR%, CAGR%): "L" Shaped Recovery
Rest of Middle East Military Smart Weapons Market Forecast, 2021-2031 (US$ mn, AGR%, CAGR%)
Rest of Middle East Military Smart Weapons Market Forecast, 2021-2031 (US$ mn, AGR%, CAGR%): "V" Shaped Recovery
Rest of Middle East Military Smart Weapons Market Forecast, 2021-2031 (US$ mn, AGR%, CAGR%): "U" Shaped Recovery
Rest of Middle East Military Smart Weapons Market Forecast, 2021-2031 (US$ mn, AGR%, CAGR%): "W" Shaped Recovery
Rest of Middle East Military Smart Weapons Market Forecast, 2021-2031 (US$ mn, AGR%, CAGR%): "L" Shaped Recovery
RoW Military Smart Weapons Market Forecast by Platform, 2021-2031 (US$ mn, AGR%, CAGR%)
RoW Military Smart Weapons Market Forecast by Platform, 2021-2031 (US$ mn, AGR%, CAGR%): "V" Shaped Recovery
RoW Military Smart Weapons Market Forecast by Platform, 2021-2031 (US$ mn, AGR%, CAGR%): "U" Shaped Recovery
RoW Military Smart Weapons Market Forecast by Platform, 2021-2031 (US$ mn, AGR%, CAGR%): "W" Shaped Recovery
RoW Military Smart Weapons Market Forecast by Platform, 2021-2031 (US$ mn, AGR%, CAGR%): "L" Shaped Recovery
RoW Military Smart Weapons Market Forecast by Type, 2021-2031 (US$ mn, AGR%, CAGR%)
RoW Military Smart Weapons Market Forecast by Type, 2021-2031 (US$ mn, AGR%, CAGR%): "V" Shaped Recovery
RoW Military Smart Weapons Market Forecast by Type, 2021-2031 (US$ mn, AGR%, CAGR%): "U" Shaped Recovery
RoW Military Smart Weapons Market Forecast by Type, 2021-2031 (US$ mn, AGR%, CAGR%): "W" Shaped Recovery
RoW Military Smart Weapons Market Forecast by Type, 2021-2031 (US$ mn, AGR%, CAGR%): "L" Shaped Recovery
Military Smart Weapons Market Recent Developments, 2017-2021
Boeing: Key Details, (CEO, HQ, Revenue, Founded, No. of Employees, Company Type, Website, Business Segment)
Boeing: Product Benchmarking
Boeing: Recent Developments, 2017-2021
General Dynamics Corporation: Key Details, (CEO, HQ, Revenue, Founded, No. of Employees, Company Type, Website, Business Segment)
General Dynamics Corporation: Product Benchmarking
General Dynamics Corporation: Recent Developments, 2017-2021
Kongsberg Gruppen: Key Details, (CEO, HQ, Revenue, Founded, No. of Employees, Company Type, Website, Business Segment)
Kongsberg Gruppen: Product Benchmarking
Kongsberg Gruppen: Recent Developments, 2017-2021
Lockheed Martin Corporation: Key Details, (CEO, HQ, Revenue, Founded, No. of Employees, Company Type, Website, Business Segment)
Lockheed Martin Corporation: Product Benchmarking
Lockheed Martin Corporation: Recent Developments, 2017-2021
MBDA: Key Details, (CEO, HQ, Revenue, Founded, No. of Employees, Company Type, Website, Business Segment)
MBDA: Product Benchmarking
MBDA: Recent Developments, 2017-2021
Northrop Grumman Corporation: Key Details, (CEO, HQ, Revenue, Founded, No. of Employees, Company Type, Website, Business Segment)
Northrop Grumman Corporation: Product Benchmarking
Northrop Grumman Corporation: Recent Developments, 2017-2021
BAE Systems: Key Details, (CEO, HQ, Revenue, Founded, No. of Employees, Company Type, Website, Business Segment)
BAE Systems: Product Benchmarking
BAE Systems: Recent Developments, 2017-2021
Raytheon: Key Details, (CEO, HQ, Revenue, Founded, No. of Employees, Company Type, Website, Business Segment)
Raytheon: Product Benchmarking
Raytheon: Recent Developments, 2017-2021
Textron Inc: Key Details, (CEO, HQ, Revenue, Founded, No. of Employees, Company Type, Website, Business Segment)
Textron Inc: Product Benchmarking
Textron Inc: Recent Developments, 2017-2021
Orbital ATK: Key Details, (CEO, HQ, Revenue, Founded, No. of Employees, Company Type, Website, Business Segment)
Orbital ATK: Product Benchmarking
Orbital ATK: Recent Developments, 2017-2021
L-3 Communications Holdings, Inc.: Key Details, (CEO, HQ, Revenue, Founded, No. of Employees, Company Type, Website, Business Segment)
L-3 Communications Holdings, Inc.: Recent Developments, 2017-2021
Thales Group: Key Details, (CEO, HQ, Revenue, Founded, No. of Employees, Company Type, Website, Business Segment)
Thales Group: Product Benchmarking
Thales Group: Recent Developments, 2017-2021
Rheinmetall Ag: Key Details, (CEO, HQ, Revenue, Founded, No. of Employees, Company Type, Website, Business Segment)
Rheinmetall Ag: Product Benchmarking
Rheinmetall Ag: Recent Developments, 2017-2021
Rafael Advanced Defense Systems Ltd.: Key Details, (CEO, HQ, Revenue, Founded, No. of Employees, Company Type, Website, Business Segment)
Rafael Advanced Defense Systems Ltd.: Product Benchmarking
Rafael Advanced Defense Systems Ltd.: Recent Developments, 2017-2021
Other Notable Players in Military Smart Weapons Market
Organizations in Military Smart Weapons Market
List of Figures
Global Military Smart Weapons Market Segmentation
Global Military Smart Weapons Market: Dynamics
Global Military Smart Weapons Market: SWOT Analysis
Global Military Smart Weapons Market: PEST Analysis
Global Military Smart Weapons Market Forecast by Platform, 2021-2031 (US$ million, AGR %)
Global Military Smart Weapons Market Share Forecast by Platform, 2021, 2026, 2031 (%)
Global Military Smart Weapons Market for Land-Based Segment: Revenue Forecast 2021-2031 (US$ million, AGR%)
Global Military Smart Weapons Market for Land-Based Segment, Revenue Forecast 2021-2031 (US$ million, AGR%): “V” Shaped Recovery
Global Military Smart Weapons Market for Land-Based Segment, Revenue Forecast 2021-2031 (US$ million, AGR%): “U” Shaped Recovery
Global Military Smart Weapons Market for Land-Based Segment, Revenue Forecast 2021-2031 (US$ million, AGR%): “W” Shaped Recovery
Global Military Smart Weapons Market for Land-Based Segment, Revenue Forecast 2021-2031 (US$ million, AGR%): “L” Shaped Recovery
Global Military Smart Weapons Market for Airborne Segment: Revenue Forecast 2021-2031 (US$ million, AGR%)
Global Military Smart Weapons Market for Airborne Segment, Revenue Forecast 2021-2031 (US$ million, AGR%): “V” Shaped Recovery
Global Military Smart Weapons Market for Airborne Segment, Revenue Forecast 2021-2031 (US$ million, AGR%): “U” Shaped Recovery
Global Military Smart Weapons Market for Airborne Segment, Revenue Forecast 2021-2031 (US$ million, AGR%): “W” Shaped Recovery
Global Military Smart Weapons Market for Airborne Segment, Revenue Forecast 2021-2031 (US$ million, AGR%): “L” Shaped Recovery
Global Military Smart Weapons Market for Naval Segment: Revenue Forecast 2021-2031 (US$ million, AGR%)
Global Military Smart Weapons Market for Naval Segment, Revenue Forecast 2021-2031 (US$ million, AGR%): “V” Shaped Recovery
Global Military Smart Weapons Market for Naval Segment, Revenue Forecast 2021-2031 (US$ million, AGR%): “U” Shaped Recovery
Global Military Smart Weapons Market for Naval Segment, Revenue Forecast 2021-2031 (US$ million, AGR%): “W” Shaped Recovery
Global Military Smart Weapons Market for Naval Segment, Revenue Forecast 2021-2031 (US$ million, AGR%): “L” Shaped Recovery
Global Military Smart Weapons Market Forecast by Type, 2021-2031 (US$ million, AGR %)
Global Military Smart Weapons Market Share Forecast by Type, 2021, 2026, 2031 (%)
Global Military Smart Weapons Market for Radar-Guided Segment: Revenue Forecast 2021-2031 (US$ million, AGR%)
Global Military Smart Weapons Market for Radar-Guided Segment, Revenue Forecast 2021-2031 (US$ million, AGR%): “V” Shaped Recovery
Global Military Smart Weapons Market for Radar-Guided Segment, Revenue Forecast 2021-2031 (US$ million, AGR%): “U” Shaped Recovery
Global Military Smart Weapons Market for Radar-Guided Segment, Revenue Forecast 2021-2031 (US$ million, AGR%): “W” Shaped Recovery
Global Military Smart Weapons Market for Radar-Guided Segment, Revenue Forecast 2021-2031 (US$ million, AGR%): “L” Shaped Recovery
Global Military Smart Weapons Market for GPS/INS-Guided Segment: Revenue Forecast 2021-2031 (US$ million, AGR%)
Global Military Smart Weapons Market for GPS/INS-Guided Segment, Revenue Forecast 2021-2031 (US$ million, AGR%): “V” Shaped Recovery
Global Military Smart Weapons Market for GPS/INS-Guided Segment, Revenue Forecast 2021-2031 (US$ million, AGR%): “U” Shaped Recovery
Global Military Smart Weapons Market for GPS/INS-Guided Segment, Revenue Forecast 2021-2031 (US$ million, AGR%): “W” Shaped Recovery
Global Military Smart Weapons Market for GPS/INS-Guided Segment, Revenue Forecast 2021-2031 (US$ million, AGR%): “L” Shaped Recovery
Global Military Smart Weapons Market for Infrared-Guided Segment: Revenue Forecast 2021-2031 (US$ million, AGR%)
Global Military Smart Weapons Market for Infrared-Guided Segment, Revenue Forecast 2021-2031 (US$ million, AGR%): “V” Shaped Recovery
Global Military Smart Weapons Market for Infrared-Guided Segment, Revenue Forecast 2021-2031 (US$ million, AGR%): “U” Shaped Recovery
Global Military Smart Weapons Market for Infrared-Guided Segment, Revenue Forecast 2021-2031 (US$ million, AGR%): “W” Shaped Recovery
Global Military Smart Weapons Market for Infrared-Guided Segment, Revenue Forecast 2021-2031 (US$ million, AGR%): “L” Shaped Recovery
Global Military Smart Weapons Market for Laser-Guided Segment: Revenue Forecast 2021-2031 (US$ million, AGR%)
Global Military Smart Weapons Market for Laser-Guided Segment, Revenue Forecast 2021-2031 (US$ million, AGR%): “V” Shaped Recovery
Global Military Smart Weapons Market for Laser-Guided Segment, Revenue Forecast 2021-2031 (US$ million, AGR%): “U” Shaped Recovery
Global Military Smart Weapons Market for Laser-Guided Segment, Revenue Forecast 2021-2031 (US$ million, AGR%): “W” Shaped Recovery
Global Military Smart Weapons Market for Laser-Guided Segment, Revenue Forecast 2021-2031 (US$ million, AGR%): “L” Shaped Recovery
Global Military Smart Weapons Market for Other-Guided Segment: Revenue Forecast 2021-2031 (US$ million, AGR%)
Global Military Smart Weapons Market for Other-Guided Segment, Revenue Forecast 2021-2031 (US$ million, AGR%): “V” Shaped Recovery
Global Military Smart Weapons Market for Other-Guided Segment, Revenue Forecast 2021-2031 (US$ million, AGR%): “U” Shaped Recovery
Global Military Smart Weapons Market for Other-Guided Segment, Revenue Forecast 2021-2031 (US$ million, AGR%): “W” Shaped Recovery
Global Military Smart Weapons Market for Other-Guided Segment, Revenue Forecast 2021-2031 (US$ million, AGR%): “L” Shaped Recovery
Global Military Smart Weapons Market Forecast by Region 2021-2031 (US$ million)
Global Military Smart Weapons Market Share Forecast by Region 2021, 2026, 2031 (%)
Global Military Smart Weapons Market Forecast, 2021-2031 (US$ million, AGR%): “V” Shaped Recovery
Global Military Smart Weapons Market Forecast, 2021-2031 (US$ million, AGR%): “U” Shaped Recovery
Global Military Smart Weapons Market Forecast, 2021-2031 (US$ million, AGR%): “W” Shaped Recovery
Global Military Smart Weapons Market Forecast, 2021-2031 (US$ million, AGR%): “L” Shaped Recovery
North America Military Smart Weapons Market Forecast by Country 2021-2031 (US$ million)
North America Military Smart Weapons Market Share Forecast by Country 2021, 2026, 2031 (%)
North America Military Smart Weapons Market Forecast by Platform, 2021-2031 (US$ million, AGR%)
North America Military Smart Weapons Market Forecast by Platform, 2021-2031 (US$ million, AGR%): “V” Shaped Recovery
North America Military Smart Weapons Market Forecast by Platform, 2021-2031 (US$ million, AGR%): “U” Shaped Recovery
North America Military Smart Weapons Market Forecast by Platform, 2021-2031 (US$ million, AGR%): “W” Shaped Recovery
North America Military Smart Weapons Market Forecast by Platform, 2021-2031 (US$ million, AGR%): “L” Shaped Recovery
North America Military Smart Weapons Market Forecast by Type, 2021-2031 (US$ million, AGR%)
North America Military Smart Weapons Market Forecast by Type, 2021-2031 (US$ million, AGR%): “V” Shaped Recovery
North America Military Smart Weapons Market Forecast by Type, 2021-2031 (US$ million, AGR%): “U” Shaped Recovery
North America Military Smart Weapons Market Forecast by Type, 2021-2031 (US$ million, AGR%): “W” Shaped Recovery
North America Military Smart Weapons Market Forecast by Type, 2021-2031 (US$ million, AGR%): “L” Shaped Recovery
U.S. Military Smart Weapons Market Forecast, 2021-2031 (US$ million, AGR %)
U.S. Military Smart Weapons Market Forecast, 2021-2031 (US$ million, AGR%): “V” Shaped Recovery
U.S. Military Smart Weapons Market Forecast, 2021-2031 (US$ million, AGR%): “U” Shaped Recovery
U.S. Military Smart Weapons Market Forecast, 2021-2031 (US$ million, AGR%): “W” Shaped Recovery
U.S. Military Smart Weapons Market Forecast, 2021-2031 (US$ million, AGR%): “L” Shaped Recovery
Canada Military Smart Weapons Market Forecast, 2021-2031 (US$ million, AGR %)
Canada Military Smart Weapons Market Forecast, 2021-2031 (US$ million, AGR%): “V” Shaped Recovery
Canada Military Smart Weapons Market Forecast, 2021-2031 (US$ million, AGR%): “U” Shaped Recovery
Canada Military Smart Weapons Market Forecast, 2021-2031 (US$ million, AGR%): “W” Shaped Recovery
Canada Military Smart Weapons Market Forecast, 2021-2031 (US$ million, AGR%): “L” Shaped Recovery
Europe Military Smart Weapons Market Forecast by Country 2021-2031 (US$ million)
Europe Military Smart Weapons Market Share Forecast by Country 2021, 2026, 2031 (%)
Europe Military Smart Weapons Market Forecast by Platform, 2021-2031 (US$ million, AGR%)
Europe Military Smart Weapons Market Forecast by Platform, 2021-2031 (US$ million, AGR%): “V” Shaped Recovery
Europe Military Smart Weapons Market Forecast by Platform, 2021-2031 (US$ million, AGR%): “U” Shaped Recovery
Europe Military Smart Weapons Market Forecast by Platform, 2021-2031 (US$ million, AGR%): “W” Shaped Recovery
Europe Military Smart Weapons Market Forecast by Platform, 2021-2031 (US$ million, AGR%): “L” Shaped Recovery
Europe Military Smart Weapons Market Forecast by Type, 2021-2031 (US$ million, AGR%)
Europe Military Smart Weapons Market Forecast by Type, 2021-2031 (US$ million, AGR%): “V” Shaped Recovery
Europe Military Smart Weapons Market Forecast by Type, 2021-2031 (US$ million, AGR%): “U” Shaped Recovery
Europe Military Smart Weapons Market Forecast by Type, 2021-2031 (US$ million, AGR%): “W” Shaped Recovery
Europe Military Smart Weapons Market Forecast by Type, 2021-2031 (US$ million, AGR%): “L” Shaped Recovery
UK Military Smart Weapons Market Forecast, 2021-2031 (US$ million, AGR %)
UK Military Smart Weapons Market Forecast, 2021-2031 (US$ million, AGR%): “V” Shaped Recovery
UK Military Smart Weapons Market Forecast, 2021-2031 (US$ million, AGR%): “U” Shaped Recovery
UK Military Smart Weapons Market Forecast, 2021-2031 (US$ million, AGR%): “W” Shaped Recovery
UK Military Smart Weapons Market Forecast, 2021-2031 (US$ million, AGR%): “L” Shaped Recovery
France Military Smart Weapons Market Forecast, 2021-2031 (US$ million, AGR %)
France Military Smart Weapons Market Forecast, 2021-2031 (US$ million, AGR%): “V” Shaped Recovery
France Military Smart Weapons Market Forecast, 2021-2031 (US$ million, AGR%): “U” Shaped Recovery
France Military Smart Weapons Market Forecast, 2021-2031 (US$ million, AGR%): “W” Shaped Recovery
France Military Smart Weapons Market Forecast, 2021-2031 (US$ million, AGR%): “L” Shaped Recovery
Germany Military Smart Weapons Market Forecast, 2021-2031 (US$ million, AGR %)
Germany Military Smart Weapons Market Forecast, 2021-2031 (US$ million, AGR%): “V” Shaped Recovery
Germany Military Smart Weapons Market Forecast, 2021-2031 (US$ million, AGR%): “U” Shaped Recovery
Germany Military Smart Weapons Market Forecast, 2021-2031 (US$ million, AGR%): “W” Shaped Recovery
Germany Military Smart Weapons Market Forecast, 2021-2031 (US$ million, AGR%): “L” Shaped Recovery
Italy Military Smart Weapons Market Forecast, 2021-2031 (US$ million, AGR %)
Italy Military Smart Weapons Market Forecast, 2021-2031 (US$ million, AGR%): “V” Shaped Recovery
Italy Military Smart Weapons Market Forecast, 2021-2031 (US$ million, AGR%): “U” Shaped Recovery
Italy Military Smart Weapons Market Forecast, 2021-2031 (US$ million, AGR%): “W” Shaped Recovery
Italy Military Smart Weapons Market Forecast, 2021-2031 (US$ million, AGR%): “L” Shaped Recovery
Spain Military Smart Weapons Market Forecast, 2021-2031 (US$ million, AGR %)
Spain Military Smart Weapons Market Forecast, 2021-2031 (US$ million, AGR%): “V” Shaped Recovery
Spain Military Smart Weapons Market Forecast, 2021-2031 (US$ million, AGR%): “U” Shaped Recovery
Spain Military Smart Weapons Market Forecast, 2021-2031 (US$ million, AGR%): “W” Shaped Recovery
Spain Military Smart Weapons Market Forecast, 2021-2031 (US$ million, AGR%): “L” Shaped Recovery
Russia Military Smart Weapons Market Forecast, 2021-2031 (US$ million, AGR %)
Russia Military Smart Weapons Market Forecast, 2021-2031 (US$ million, AGR%): “V” Shaped Recovery
Russia Military Smart Weapons Market Forecast, 2021-2031 (US$ million, AGR%): “U” Shaped Recovery
Russia Military Smart Weapons Market Forecast, 2021-2031 (US$ million, AGR%): “W” Shaped Recovery
Russia Military Smart Weapons Market Forecast, 2021-2031 (US$ million, AGR%): “L” Shaped Recovery
Rest of Europe Military Smart Weapons Market Forecast, 2021-2031 (US$ million, AGR %)
Rest of Europe Military Smart Weapons Market Forecast, 2021-2031 (US$ million, AGR%): “V” Shaped Recovery
Rest of Europe Military Smart Weapons Market Forecast, 2021-2031 (US$ million, AGR%): “U” Shaped Recovery
Rest of Europe Military Smart Weapons Market Forecast, 2021-2031 (US$ million, AGR%): “W” Shaped Recovery
Rest of Europe Military Smart Weapons Market Forecast, 2021-2031 (US$ million, AGR%): “L” Shaped Recovery
Asia-Pacific Military Smart Weapons Market Forecast by Country 2021-2031 (US$ million)
Asia-Pacific Military Smart Weapons Market Share Forecast by Country 2021, 2026, 2031 (%)
Asia-Pacific Military Smart Weapons Market Forecast by Platform, 2021-2031 (US$ million, AGR%)
Asia-Pacific Military Smart Weapons Market Forecast by Platform, 2021-2031 (US$ million, AGR%): “V” Shaped Recovery
Asia-Pacific Military Smart Weapons Market Forecast by Platform, 2021-2031 (US$ million, AGR%): “U” Shaped Recovery
Asia-Pacific Military Smart Weapons Market Forecast by Platform, 2021-2031 (US$ million, AGR%): “W” Shaped Recovery
Asia-Pacific Military Smart Weapons Market Forecast by Platform, 2021-2031 (US$ million, AGR%): “L” Shaped Recovery
Asia-Pacific Military Smart Weapons Market Forecast by Type, 2021-2031 (US$ million, AGR%)
Asia-Pacific Military Smart Weapons Market Forecast by Type, 2021-2031 (US$ million, AGR%): “V” Shaped Recovery
Asia-Pacific Military Smart Weapons Market Forecast by Type, 2021-2031 (US$ million, AGR%): “U” Shaped Recovery
Asia-Pacific Military Smart Weapons Market Forecast by Type, 2021-2031 (US$ million, AGR%): “W” Shaped Recovery
Asia-Pacific Military Smart Weapons Market Forecast by Type, 2021-2031 (US$ million, AGR%): “L” Shaped Recovery
China Military Smart Weapons Market Forecast, 2021-2031 (US$ million, AGR %)
China Military Smart Weapons Market Forecast, 2021-2031 (US$ million, AGR%): “V” Shaped Recovery
China Military Smart Weapons Market Forecast, 2021-2031 (US$ million, AGR%): “U” Shaped Recovery
China Military Smart Weapons Market Forecast, 2021-2031 (US$ million, AGR%): “W” Shaped Recovery
China Military Smart Weapons Market Forecast, 2021-2031 (US$ million, AGR%): “L” Shaped Recovery
India Military Smart Weapons Market Forecast, 2021-2031 (US$ million, AGR %)
India Military Smart Weapons Market Forecast, 2021-2031 (US$ million, AGR%): “V” Shaped Recovery
India Military Smart Weapons Market Forecast, 2021-2031 (US$ million, AGR%): “U” Shaped Recovery
India Military Smart Weapons Market Forecast, 2021-2031 (US$ million, AGR%): “W” Shaped Recovery
India Military Smart Weapons Market Forecast, 2021-2031 (US$ million, AGR%): “L” Shaped Recovery
South Korea Military Smart Weapons Market Forecast, 2021-2031 (US$ million, AGR %)
South Korea Military Smart Weapons Market Forecast, 2021-2031 (US$ million, AGR%): “V” Shaped Recovery
South Korea Military Smart Weapons Market Forecast, 2021-2031 (US$ million, AGR%): “U” Shaped Recovery
South Korea Military Smart Weapons Market Forecast, 2021-2031 (US$ million, AGR%): “W” Shaped Recovery
South Korea Military Smart Weapons Market Forecast, 2021-2031 (US$ million, AGR%): “L” Shaped Recovery
Japan Military Smart Weapons Market Forecast, 2021-2031 (US$ million, AGR %)
Japan Military Smart Weapons Market Forecast, 2021-2031 (US$ million, AGR%): “V” Shaped Recovery
Japan Military Smart Weapons Market Forecast, 2021-2031 (US$ million, AGR%): “U” Shaped Recovery
Japan Military Smart Weapons Market Forecast, 2021-2031 (US$ million, AGR%): “W” Shaped Recovery
Japan Military Smart Weapons Market Forecast, 2021-2031 (US$ million, AGR%): “L” Shaped Recovery
Rest of APAC Military Smart Weapons Market Forecast, 2021-2031 (US$ million, AGR %)
Rest of APAC Military Smart Weapons Market Forecast, 2021-2031 (US$ million, AGR%): “V” Shaped Recovery
Rest of APAC Military Smart Weapons Market Forecast, 2021-2031 (US$ million, AGR%): “U” Shaped Recovery
Rest of APAC Military Smart Weapons Market Forecast, 2021-2031 (US$ million, AGR%): “W” Shaped Recovery
Rest of APAC Military Smart Weapons Market Forecast, 2021-2031 (US$ million, AGR%): “L” Shaped Recovery
Middle East Military Smart Weapons Market Forecast by Country 2021-2031 (US$ million)
Middle East Military Smart Weapons Market Share Forecast by Country 2021, 2026, 2031 (%)
Middle East Military Smart Weapons Market Forecast by Platform, 2021-2031 (US$ million, AGR%)
Middle East Military Smart Weapons Market Forecast by Platform, 2021-2031 (US$ million, AGR%): “V” Shaped Recovery
Middle East Military Smart Weapons Market Forecast by Platform, 2021-2031 (US$ million, AGR%): “U” Shaped Recovery
Middle East Military Smart Weapons Market Forecast by Platform, 2021-2031 (US$ million, AGR%): “W” Shaped Recovery
Middle East Military Smart Weapons Market Forecast by Platform, 2021-2031 (US$ million, AGR%): “L” Shaped Recovery
Middle East Military Smart Weapons Market Forecast by Type, 2021-2031 (US$ million, AGR%)
Middle East Military Smart Weapons Market Forecast by Type, 2021-2031 (US$ million, AGR%): “V” Shaped Recovery
Middle East Military Smart Weapons Market Forecast by Type, 2021-2031 (US$ million, AGR%): “U” Shaped Recovery
Middle East Military Smart Weapons Market Forecast by Type, 2021-2031 (US$ million, AGR%): “W” Shaped Recovery
Middle East Military Smart Weapons Market Forecast by Type, 2021-2031 (US$ million, AGR%): “L” Shaped Recovery
UAE Military Smart Weapons Market Forecast, 2021-2031 (US$ million, AGR %)
UAE Military Smart Weapons Market Forecast, 2021-2031 (US$ million, AGR%): “V” Shaped Recovery
UAE Military Smart Weapons Market Forecast, 2021-2031 (US$ million, AGR%): “U” Shaped Recovery
UAE Military Smart Weapons Market Forecast, 2021-2031 (US$ million, AGR%): “W” Shaped Recovery
UAE Military Smart Weapons Market Forecast, 2021-2031 (US$ million, AGR%): “L” Shaped Recovery
Saudi Arabia Military Smart Weapons Market Forecast, 2021-2031 (US$ million, AGR %)
Saudi Arabia Military Smart Weapons Market Forecast, 2021-2031 (US$ million, AGR%): “V” Shaped Recovery
Saudi Arabia Military Smart Weapons Market Forecast, 2021-2031 (US$ million, AGR%): “U” Shaped Recovery
Saudi Arabia Military Smart Weapons Market Forecast, 2021-2031 (US$ million, AGR%): “W” Shaped Recovery
Saudi Arabia Military Smart Weapons Market Forecast, 2021-2031 (US$ million, AGR%): “L” Shaped Recovery
Qatar Military Smart Weapons Market Forecast, 2021-2031 (US$ million, AGR %)
Qatar Military Smart Weapons Market Forecast, 2021-2031 (US$ million, AGR%): “V” Shaped Recovery
Qatar Military Smart Weapons Market Forecast, 2021-2031 (US$ million, AGR%): “U” Shaped Recovery
Qatar Military Smart Weapons Market Forecast, 2021-2031 (US$ million, AGR%): “W” Shaped Recovery
Qatar Military Smart Weapons Market Forecast, 2021-2031 (US$ million, AGR%): “L” Shaped Recovery
Rest of Middle East Military Smart Weapons Market Forecast, 2021-2031 (US$ million, AGR %)
Rest of Middle East Military Smart Weapons Market Forecast, 2021-2031 (US$ million, AGR%): “V” Shaped Recovery
Rest of Middle East Military Smart Weapons Market Forecast, 2021-2031 (US$ million, AGR%): “U” Shaped Recovery
Rest of Middle East Military Smart Weapons Market Forecast, 2021-2031 (US$ million, AGR%): “W” Shaped Recovery
Rest of Middle East Military Smart Weapons Market Forecast, 2021-2031 (US$ million, AGR%): “L” Shaped Recovery
RoW Military Smart Weapons Market Forecast by Platform, 2021-2031 (US$ million, AGR%)
RoW Military Smart Weapons Market Forecast by Platform, 2021-2031 (US$ million, AGR%): “V” Shaped Recovery
RoW Military Smart Weapons Market Forecast by Platform, 2021-2031 (US$ million, AGR%): “U” Shaped Recovery
RoW Military Smart Weapons Market Forecast by Platform, 2021-2031 (US$ million, AGR%): “W” Shaped Recovery
RoW Military Smart Weapons Market Forecast by Platform, 2021-2031 (US$ million, AGR%): “L” Shaped Recovery
RoW Military Smart Weapons Market Forecast by Type, 2021-2031 (US$ million, AGR%)
RoW Military Smart Weapons Market Forecast by Type, 2021-2031 (US$ million, AGR%): “V” Shaped Recovery
RoW Military Smart Weapons Market Forecast by Type, 2021-2031 (US$ million, AGR%): “U” Shaped Recovery
RoW Military Smart Weapons Market Forecast by Type, 2021-2031 (US$ million, AGR%): “W” Shaped Recovery
RoW Military Smart Weapons Market Forecast by Type, 2021-2031 (US$ million, AGR%): “L” Shaped Recovery
Global Military Smart Weapons Market: Company Share Analysis, 2020
Boeing: Net Revenue, 2016-2020 (US$ million, AGR%)
Boeing: Regional Revenue Shares, 2018-2020
Boeing: Segmental Revenue Shares, 2018-2020
Boeing: Gross Profit, 2016-2020 (US$ million, AGR%)
Boeing: R&D, 2016-2020 (US$ million, AGR%)
Boeing: EBIDTA, 2016-2020 (US$ million, AGR%)
General Dynamics Corporation: Net Revenue, 2016-2020 (US$ million, AGR%)
General Dynamics Corporation: Regional Revenue Shares, 2018-2020
General Dynamics Corporation: Segmental Revenue Shares, 2018-2020
General Dynamics Corporation: Gross Profit, 2016-2020 (US$ million, AGR%)
General Dynamics Corporation: EBIDTA, 2016-2020 (US$ million, AGR%)
Kongsberg Gruppen: Net Revenue, 2016-2020 (US$ million, AGR%)
Kongsberg Gruppen: Regional Revenue Shares, 2018-2020
Kongsberg Gruppen: Segmental Revenue Shares, 2018-2020
Kongsberg Gruppen: Gross Profit, 2016-2020 (US$ million, AGR%)
Kongsberg Gruppen: EBIDTA, 2016-2020 (US$ million, AGR%)
Lockheed Martin Corporation: Net Revenue, 2016-2020 (US$ million, AGR%)
Lockheed Martin Corporation: Regional Revenue Shares, 2018-2020
Lockheed Martin Corporation: Segmental Revenue Shares, 2018-2020
Lockheed Martin Corporation: Gross Profit, 2016-2020 (US$ million, AGR%)
Lockheed Martin Corporation: EBIDTA, 2016-2020 (US$ million, AGR%)
Northrop Grumman Corporation: Net Revenue, 2016-2020 (US$ million, AGR%)
Northrop Grumman Corporation: Regional Revenue Shares, 2018-2020
Northrop Grumman Corporation: Segmental Revenue Shares, 2018-2020
Northrop Grumman Corporation: Gross Profit, 2016-2020 (US$ million, AGR%)
Northrop Grumman Corporation: EBIDTA, 2016-2020 (US$ million, AGR%)
BAE Systems: Net Revenue, 2016-2020 (US$ million, AGR%)
BAE Systems: Regional Revenue Shares, 2018-2020
BAE Systems: Segmental Revenue Shares, 2018-2020
BAE Systems: Gross Profit, 2016-2020 (US$ million, AGR%)
BAE Systems: EBIDTA, 2016-2020 (US$ million, AGR%)
Raytheon: Net Revenue, 2016-2020 (US$ million, AGR%)
Raytheon: Regional Revenue Shares, 2018-2020
Raytheon: Segmental Revenue Shares, 2018-2020
Raytheon: Gross Profit, 2016-2020 (US$ million, AGR%)
Raytheon: R&D, 2016-2020 (US$ million, AGR%)
Raytheon: EBIDTA, 2016-2020 (US$ million, AGR%)
Textron Inc: Net Revenue, 2016-2020 (US$ million, AGR%)
Textron Inc: Regional Revenue Shares, 2018-2020
Textron Inc: Segmental Revenue Shares, 2018-2020
Textron Inc: Gross Profit, 2016-2020 (US$ million, AGR%)
Textron Inc: EBIDTA, 2016-2020 (US$ million, AGR%)
L-3 Communications Holdings, Inc.: Net Revenue, 2016-2020 (US$ million, AGR%)
L-3 Communications Holdings, Inc.: Regional Revenue Shares, 2018-2020
L-3 Communications Holdings, Inc.: Segmental Revenue Shares, 2018-2020
L-3 Communications Holdings, Inc.: Gross Profit, 2016-2020 (US$ million, AGR%)
L-3 Communications Holdings, Inc.: EBIDTA, 2016-2020 (US$ million, AGR%)
Thales Group: Net Revenue, 2016-2020 (US$ million, AGR%)
Thales Group: Regional Revenue Shares, 2018-2020
Thales Group: Segmental Revenue Shares, 2018-2020
Thales Group: Gross Profit, 2016-2020 (US$ million, AGR%)
Thales Group: R&D, 2016-2020 (US$ million, AGR%)
Thales Group: EBIDTA, 2016-2020 (US$ million, AGR%)
Rheinmetall Ag: Net Revenue, 2016-2020 (US$ million, AGR%)
Rheinmetall Ag: Regional Revenue Shares, 2018-2020
Rheinmetall Ag: Segmental Revenue Shares, 2018-2020
Rheinmetall Ag: Gross Profit, 2016-2020 (US$ million, AGR%)
Rheinmetall Ag: EBIDTA, 2016-2020 (US$ million, AGR%)
North America Military Smart Weapons Market Forecast, 2021-2031 (US$ million, AGR%)
Companies Profiled in the Report:
BAE Systems
Boeing
General Dynamics Corporation
Kongsberg Gruppen
L-3 Communications Holdings, Inc.
Lockheed Martin Corporation
MBDA
Northrop Grumman Corporation
Orbital ATK
Rafael Advanced Defense Systems Ltd.
Raytheon
Rheinmetall Ag
Textron Inc,
Thales Group
List of Companies Mentioned in the Report:
BAE Systems
Boeing
General Dynamics Corporation
Kawasaki Heavy Industries
Kongsberg Gruppen
Krauss-Maffei Wegmann
KRET
L-3 Communications Holdings, Inc.
Lockheed Martin Corporation
MBDA
Nexter
Northrop Grumman Corporation
Orbital ATK
Oshkosh Truck
Pacific Architects and Engineers Inc
Perimeter Internetworking Corp
Pine Telecom Ltd.
Poseidon Scientific Instruments Pty Ltd
Radiance Technologies
Rafael Advanced Defense Systems Ltd.
Raytheon
Rheinmetall Ag
Rolls-Royce
Royal Netherlands Army
RTI Systems
RUAG Sikorsky Aircraft
SAAB
Safariland, LLC
SAFRAN
Samsung Techwin
Savi Technology, Inc.
SeeByte
Selex ES
Serco
Sevmash (USC)
SilverSky
Solutions Made Simple Inc
Sozvezdie
ST Engineering
Sukhoi
Swiss-Photonics AG
Symantec Corporation
Systems Made Simple
Tactical Missiles Corporation
Teligy Inc
Textron Inc,
Thales Group
The Veritas Capital Fund III, LP
ThyssenKrupp
UES Inc
List of Organizations Mentioned in the Report:
Airport Association of CIS Civil Aviation
Airports Authority of India (AAI)
Airports of Thailand PCL (AOT)
ANAC National Civil Agency (Argentina)
ANAC National Civil Agency (Brazil)
Civil Aviation Administration of China (CAAC)
Civil Aviation Authority (Germany)
Civil Aviation Authority (UK)
Civil Aviation Authority of Norway
Directorate General of Civil Aeronautics (Mexico)
Federal Aviation Administration
General Directorate of State Airports Authority
Japan Civil Aviation Bureau
Oman Airport Management Co.
Turkish Air Force
U.K. Ministry of Defence
U.S. Army
U.S. Department of Defense
U.S. Marine Corps
U.S. Navy Air France and the French Civil Aviation Authority