Industries > Defence > Military Satellites Market Report 2018-2028
Military Satellites Market Report 2018-2028
Militarisation of Space for Defence, Security & Information: Forecasts for Military Satellite Buses (Standard, Micro and Nano), Payloads & Communication Terminals (Transponders, SATCOM, C4 Management & Networking Systems, Intelligence, Surveillance, Reconnaissance, Missile Early-Warning, Electro Optical Infrared Sensors), Launch Services (Launch Vehicles, Modules, Fuel, Ground-control, Infrastructure), Anti-Satellite Weapon Systems (ASAT)
• Do you need definitive military satellite market data?
• Succinct military satellite market analysis?
• Technological insight?
• Clear competitor analysis?
• Actionable business recommendations?
Read on to discover how this definitive 307 page defence report can transform your own research and save you time.
The $14.63bn Military Satellite market is expected to flourish in the next few years because of increased demand for satellite intelligence in South East.
Report highlights
151 tables and 156 figures
Major Military Satellite contracts and programmes
• Detailed tables of significant Military Satellite contracts, projects & programmes categorized by leading country and each leading company.
Analysis of key players in Military Satellite technologies
• The Boeing Company
• Israel Aerospace Industries
• Lockheed-Martin
• Mitsubishi Electric Corporation
• Raytheon Company
• Inmarsat
• ISS Reshetnev
• Orbital ATK Inc.
• SES S.A.
• Space Exploration Technologies Corporation
• ViaSat Inc
• Thales Alenia Space
Military Satellite Market outlook and analysis from 2018-2028
Military Satellite type forecasts and analysis from 2018-2028
• Satellite Buses Forecast 2018-2028
• Payloads & Communications Terminals Forecast 2018-2028
• Launch Services Forecast 2018-2028
• Anti-Satellite Weapons (ASATs) Forecast 2018-2028
Regional Military Satellite market forecasts from 2018-2028
• Australia Military Satellite Forecast 2018-2028
• China Military Satellite Forecast 2018-2028
• France Military Satellite Forecast 2018-2028
• Germany Military Satellite Forecast 2018-2028
• India Military Satellite Forecast 2018-2028
• Israel Military Satellite Forecast 2018-2028
• Italy Military Satellite Forecast 2018-2028
• France Military Satellite Forecast 2018-2028
• Italy Military Satellite Forecast 2018-2028
• Russia Military Satellite Forecast 2018-2028
• Spain Military Satellite Forecast 2018-2028
• United Kingdom Military Satellite Forecast 2018-2028
• United States Military Satellite Forecast 2018-2028
• Rest of the World Military Satellite Forecast 2018-2028
Key questions answered
• What does the future hold for the military satellite industry?
• Where should you target your business strategy?
• Which applications should you focus upon?
• Which disruptive technologies should you invest in?
• Which companies could you form strategic alliances with?
• Which company is likely to success and why?
• What business models should you adopt?
• What industry trends should you be aware of?
Target audience
• Military Satellite companies
• Defence contractors
• System integrators
• Avionics manufacturers
• Defence software providers
• Sub-component manufacturers
• Electronics companies
• R&D staff
• Consultants
• Analysts
• CEO’s
• CIO’s
• COO’s
• Business development managers
• Investors
• Governments
• Agencies
• Industry organisations
Visiongain is a trading partner with the US Federal Government
CCR Ref number: KD4R6
1.1 Military Satellites Market Overview
1.2 Why You Should Read This Report
1.3 How This Report Delivers
1.4 Key Questions Answered by This Analytical Report Include:
1.5 Who is This Report For?
1.6 Methodology
1.6.1 Primary Research
1.6.2 Secondary Research
1.6.3 Market Evaluation & Forecasting Methodology
1.7 Frequently Asked Questions (FAQ)
1.8 Associated Visiongain Reports
1.9 About Visiongain
2. Introduction to the Military Satellites Market
2.1 Military Satellites Market Structure
2.2 Military Satellites Market Definition
2.2.1 Military Satellites Satellite Buses Submarket Definition
2.2.2 Military Satellites Payloads and Communications Terminals Submarket Definition
2.2.3 Military Satellites Launch Services Submarket Definition
2.2.4 Military Satellites Anti-Satellite Weapons (ASATs) Submarket Definition
2.3 Significant Current and Future Developments in Military Satellite Technology
2.3.1 Electro-Optical Imaging Technology
2.3.2 Small, Micro and Nanosatellites
2.3.3 Electric Propulsion Systems
2.3.4 Satellite-launching Technology
3. Global Military Satellites Market 2018-2028
3.1 Global Military Satellites Market Forecast 2018-2028
3.2 Global Military Satellites Market Drivers & Restraints 2018
3.2.1 Sources of Growth & Contraction in the Global Military Satellites Market
4. Global Military Satellites Submarket Forecast 2018-2028
4.1 Global Military Satellites Satellite Buses Submarket Forecast 2018-2028
4.1.1 Satellite Buses: Large Multi-Tasking Military Satellite Buses at Risk from Disaggregation and Commercial Platforms
4.2 Global Military Satellites Payloads & Communications Terminals Submarket Forecast 2018-2028
4.2.1 Payloads & Communications Terminals: Ever-Growing Bandwidth Demands Will Make Submarket Largest Within Military Satellites Market
4.3 Global Military Satellites Launch Services Submarket Forecast 2018-2028
4.3.1 Launch Services: Submarket to Slow in Growth Rates as Costs of Launches Decrease
4.4 Global Military Satellites Anti-Satellite Weapons (ASATs) Submarket Forecast 2018-2028
4.4.1 Anti-Satellite Weapons (ASATs)
5. Leading National Military Satellites Market Forecast 2018-2028
5.1 Global Military Satellites Market by National Market Share Forecast 2018-2028
5.2 Australian Military Satellites Market Forecast 2018-2028
5.2.1 Australian Military Satellites Market Contracts & Programmes
5.2.2 Australia Likely To Launch its Own Military Satellite Constellation in Next Twenty Years to Maintain Information Superiority in Asia-Pacific Region
5.2.3 Australian Military Satellites Market Drivers & Restraints
5.3 Chinese Military Satellites Market Forecast 2018-2028
5.3.1 Chinese Military Satellites Market Contracts & Programmes
5.3.2 China Looks to Build Second Largest Global Military Satellite Fleet Over the Next Decade
5.3.3 China is a Competitive Player in the Anti-Satellite Weapons (ASATs) Submarket
5.3.4 Chinese Military Satellites Market Drivers & Restraints
5.4 French Military Satellites Market Forecast 2018-2028
5.4.1 French Military Satellites Market Contracts & Programmes
5.4.2 French Military Satellite Market Growth Driven by High Levels of European Cooperation and Comprehensive Replacement of Military Satellite Fleet
5.4.3 French Military Satellites Market Drivers & Restraints
5.5 German Military Satellites Market Forecast 2018-2028
5.5.1 German Military Satellites Market Contracts & Programmes
5.5.2 Steady German military satellite market growth forecast as country seeks to expand independent military satellite capability
5.5.3 German Military Satellites Market Drivers & Restraints
5.6 Indian Military Satellites Market Forecast 2018-2028
5.6.1 Indian Military Satellites Market Contracts & Programmes
5.6.2 India Set to be Second-Fastest Growing Military Satellite Market Over the Next Decade as Military Seeks Network-Centric Capabilit8
5.6.3 Indian Military Satellites Market Drivers & Restraints
5.7 Israeli Military Satellites Market Forecast 2018-2028
5.7.1 Israeli Military Satellites Market Contracts & Programmes
5.7.2 Short Operational Service of Israeli Military Satellites Will Drive Continuous Market Growth
5.7.3 Israeli Military Satellites Market Drivers & Restraints
5.8 Italian Military Satellites Market Forecast 2018-2028
5.8.1 Italian Military Satellites Market Contracts & Programmes
5.8.2 Italian Military Satellite Market Set to Continue Revolving Around Dual-Use Military-Civilian Satellites and Cooperation with European Allies
5.8.3 Italian Military Satellites Market Drivers & Restraints
5.9 Russian Military Satellites Market Forecast 2018-2028
5.9.1 Russian Military Satellites Market Contracts & Programmes
5.9.2 Large-Scale Military Satellite Fleet Modernisation Between 2005 and 2015 Alongside Economic Problems Will Restrain Military Satellite Spending Until 2019
5.9.3 Russian Military Satellites Market Drivers & Restraints
5.10 Spanish Military Satellites Market Forecast 2018-2028
5.10.1 Spanish Military Satellites Market Contracts & Programmes
5.10.2 Replacement to Spanish Military Satellite SpainSat will drive military satellite market growth from 2019
5.10.3 Spanish Military Satellites Market Drivers & Restraints
5.11 UK Military Satellites Market Forecast 2018-2028
5.11.1 UK Military Satellites Market Contracts & Programmes
5.11.2 Skynet 5 Military Satellite Constellation Replacement Future Beyond Line of Sight Programme to Drive UK Spending Throughout Next Decade
5.11.3 UK Military Satellites Market Drivers & Restraints
5.12 USA Military Satellites Market Forecast 2018-2028
5.12.1 USA Military Satellites Market Selected Contracts & Programmes 2014-2018
5.12.2 Analysis of US Military Satellite Market Forecast
5.12.3 US Air Force Will Not Accept the Status Quo in Procuring Further US Military Satellites: Disaggregation and Standardisation of Launch Payloads Amongst the Solutions
5.12.4 Significant US Future Vetronics Spending Programmes
5.12.4.1 Advanced Extremely High Frequency (AEHF): Next stage C4ISR bandwidth
5.12.4.2 Wideband Global SATCOM
5.12.4.3 Space-Based Infra-Red System (SBIRS)
5.12.4.4 Defense Meteorological Satellite Program (DMSP) to Weather-System Follow-On (WSF)
5.12.4.5 Evolved Expendable Launch Vehicle (EELV) No Longer the Pentagon’s Go-To Launch Vehicle
5.12.4.6 Satellite Defence Systems
5.12.5 USA Military Satellites Market Drivers & Restraints
5.13 Rest of the World Military Satellites Market Forecast 2018-2028
5.13.1 Rest of the World Military Satellites Market Contracts & Programmes
5.13.2 Innovation in Civilian Space Sector Will Begin to Drive Down Costs in the Military Satellite Market Decreasing the Barriers to Entry Across the Rest of the World
5.13.3 NATO Nations See the Cost-Benefits of WGS Shareholding Over Leasing of Military Payloads on Commercial Platforms
5.13.4 Rest of the World Military Satellites Market Drivers & Restraints
6. SWOT Analysis of the Military Satellites Market 2018-2028
6.1 Strengths
6.1.1 Near-Exponential Increase in Bandwidth Demand
6.1.2 Civilian Space Sector Boom
6.1.3 Major Military Satellite Programmes to Launch Across the Decade
6.2 Weaknesses
6.2.1 High costs of military satellite market entry
6.2.2 Reliance of NATO and European States on US and French Military Satellite capability
6.2.3 Civilian Space Sector boom limited outside the US
6.2.4 Low Profit Margin and risk associated with some Military Satellite systems
6.3 Opportunities
6.3.1 Reduced Launch Costs
6.3.2 Introduction of More COTS Systems
6.3.3 New Markets in the Rest of the World
6.4 Threats
6.4.1 Increasing Complexity and Cost of Military Satellite Communication Payloads
6.4.2 Falling Defence Budgets
6.4.3 Slowing Economic Growth in Emerging Markets
6.4.4 Continued Restrictions in Emerging Markets
7. PEST Analysis of the Military Satellites Market 2018-2028
8. Leading 13 Military Satellites Companies
8.1 Leading 13 Military Satellites Companies FY2017
8.2 Airbus Group SE
8.2.1 Airbus Group SE Military Satellites Selected Recent Contracts 2003-2016
8.2.2 Airbus Group SE Total Company Sales 2012-2017
8.2.3 Airbus Group SE Sales by Segment of Business 2012-2017
8.2.4 Airbus Group SE Net Income 2012-2017
8.2.5 Airbus Group SE Cost of Research & Development 2012-2017
8.2.6 Airbus Group SE Regional Emphasis / Focus
8.2.7 Airbus Group SE Organisational Structure / Subsidiaries
8.2.8 Airbus Group SE Mergers & Acquisitions (M&A) and Divestiture Activity
8.2.9 Airbus Group SE Analysis: Airbus Will Remain Market Leader in Europe With Large Current and Future Contracts But Must be Cognizant of Commercial Rivals
8.3 The Boeing Company
8.3.1 The Boeing Company Military Satellites Selected Recent Contracts 2014-2017
8.3.2 The Boeing Company Total Company Sales 2012-2017
8.3.3 The Boeing Company Sales by Segment of Business 2012-2017
8.3.4The Boeing Company Net Income / Loss 2012-2017
8.3.5 The Boeing Company Cost of Research & Development 2012-2017
8.3.6 The Boeing Company Regional Emphasis / Focus
8.3.7 The Boeing Company Organisational Structure / Subsidiaries
8.3.8 The Boeing Company Mergers& Acquisitions (M&A) Activity
8.3.9 The Boeing Company Analysis: Boeing Seeks to Maintain Position as Second Largest Military Satellite Producer in the World by Exploiting Commercial Constellation Expertise
8.3.10 The Boeing Company Joint-Venture United Launch Alliance (ULA) Under Threat from SpaceX as Launch Service Provider
8.4 Inmarsat
8.4.1 Inmarsat Military Satellites Selected Recent Contracts 2014
8.4.2 Inmarsat Total Company Sales 2012-2017
8.4.3 Inmarsat Sales by Segment of Business 2012-2017
8.4.4 Inmarsat Net Income 2012-2017
8.4.5 Inmarsat Cost of Research & Development 2012-2017
8.4.6 Inmarsat Regional Emphasis / Focus
8.4.7 Inmarsat Organisational Structure
8.4.8 Inmarsat Analysis: Company Hopes Global Xpress Satellite System Will Help Recover Ground Lost in Military Satellite Market
8.5 Israel Aerospace Industries
8.5.1 Israel Aerospace Industries Military Satellites -Selected Recent Contracts 2012-2017
8.5.2 Israel Aerospace Industries Total Company Sales 2012-2017
8.5.3 Israel Aerospace Industries Sales by Segment of Business 2012-2017
8.5.4 Israel Aerospace Industries Net Income 2012-2015
8.5.5 Israel Aerospace Industries Cost of Research & Development 2010-2015
8.5.6 Israeli Aerospace Industries Regional Emphasis / Focus
8.5.7 Israel Aerospace Industries Organisational Structure
8.5.8 IAI Mergers& Acquisitions (M&A) Activity
8.5.9 Israel Aerospace Industries Analysis: IAI’s Development of Military Satellite Ofeq 11 Offers Significant Chance for Company to Become Indian Contractor of Choice
8.6 ISS Reshetnev
8.6.1 ISS Reshetnev Military Satellites Selected Recent Contracts & Programmes 2005-2020
8.6.2 ISS Reshetnev Regional Emphasis / Focus
8.6.3 ISS Reshetnev Analysis: Singapore Airshow Presence Indicates Willingness to Expand Beyond Domestic Military Satellite Market
8.7 Lockheed Martin Corporation
8.7.1 Lockheed Martin Corporation Military SatellitesSelected Recent Contracts 2014-2017
8.7.2 Lockheed Martin Corporation Total Company Sales 2012-2017
8.7.3 Lockheed Martin Corporation Sales by Segment of Business 2012-2017
8.7.4 Lockheed Martin Corporation Net Income2012-2017
8.7.5 Lockheed Martin Corporation Cost of Research & Development 2012-2017
8.7.6 Lockheed Martin Corporation Regional Emphasis / Focus
8.7.7 Lockheed Martin Corporation Organisational Structure / Subsidiaries
8.7.8 Lockheed Martin CorporationMilitary SatellitesProducts / Services
8.7.9 Lockheed Martin Corporation Mergers & Acquisitions (M&A) and Divestiture Activity
8.7.10 Lockheed Martin Corporation Analysis: Lockheed Martin to Remain Largest Military Satellite Producer in the World
8.7.11 Lockheed Martin Joint-Venture United Launch Alliance (ULA) under threat from SpaceX as Launch Service Provider
8.8 Mitsubishi Electric Corporation
8.8.1 Mitsubishi Electric Corporation Selected Recent Military Satellites Contracts 2014-17
8.8.2 Mitsubishi Electric Corporation Total Company Sales 2013-2017
8.8.3 Mitsubishi Electric Corporation Sales by Segment of Business 2013-2017
8.8.4 Mitsubishi Electric Corporation Net Income 2013-2017
8.8.5 Mitsubishi Electric Corporation Cost of Research & Development 2013-2017
8.8.6 Mitsubishi Electric Corporation Regional Emphasis / Focus
8.8.7 Mitsubishi Electric Corporation Organisational Structure
8.8.8 Mitsubishi Electric Corporation Analysis: Mitsubishi Electric to Remain Largely Focussed on Commercial Satellite Market Outside Japanese Military Satellite Market Where Regional Security Concerns Will Drive Growth
8.9 Orbital ATK Inc.
8.9.1 Orbital ATK Inc. Selected Recent Military Satellites Contracts / Programmes 2015-2017
8.9.2 Orbital ATK Inc. Total Company Sales 2012-2017
8.9.3 Orbital ATK Inc. Sales by Segment of Business 2013-2017
8.9.4 Orbital ATK Inc. Sales AGR by Segment of Business 2014-2017
8.9.5 Orbital ATK Inc. Net Income 2012-2017
8.9.6 Orbital ATK Inc. Cost of Research & Development 2012-2017
8.9.7 Orbital ATK Inc. Regional Emphasis / Focus
8.9.8 Orbital ATK Inc. Sales AGR by Geographical Location 2014-2017
8.9.9 Orbital ATK Inc. Organisational Structure / Subsidiaries
8.9.10 Orbital ATK Inc.Mergers & Acquisitions (M&A) and Divestiture Activity
8.9.11 Orbital ATK Inc. Analysis: Orbital ATK Hopes Mission Extension Vehicle Commercial Success Will Revolutionise Satellite Logistics in Military Sector
8.10 Raytheon Company
8.10.1 Raytheon Company Selected Recent Military Satellites Contracts / Programmes 2014-2017
8.10.2 Raytheon Company Total Company Sales 2012-2017
8.10.3 Raytheon Company Sales by Segment of Business 2012-2017
8.10.4 Raytheon Company Net Income 2012-2017
8.10.5 Raytheon Company Cost of Research & Development 2012-2017
8.10.6 Raytheon Company Regional Emphasis / Focus
8.10.7 Raytheon Company Organisational Structure
8.10.8 Raytheon Company Mergers & Acquisitions (M&A) Activity
8.10.9 Raytheon Company Analysis: Raytheon Company Well Positioned to Remain Clear Market Leader in Payloads & Communications Terminals Submarket Going Forward
8.11 SES S.A.
8.11.1 SES S.A. Military Satellites Selected Recent Contracts 2015-16
8.11.2 SES S.A. Total Company Sales 2012-2017
8.10.3 SES S.A. Sales AGR by Segment of Business 2015-2016
8.11.4 SES S.A. Net Income 2012-2017
8.11.5 SES S.A. Regional Emphasis / Focus
8.11.6 SES S.A. Sales AGR by Geographical Location 2013-2017
8.11.7 SES S.A. Organisational Structure / Subsidiaries
8.11.8 Orbital ATK Inc. Mergers & Acquisitions and Divestitures 2016
8.11.9 SES S.A. Analysis: 2015 Contract with Luxembourg and NATO together with Acquisition of O3b Networks in 2016 Points Way Forward for SES’ Further Engagement in Military Satellite Market
8.12 Space Exploration Technologies Corporation
8.12.1 Space Exploration Technologies Corporation Military Satellites Selected Recent Contracts 2016-17
8.12.2 Space Exploration Technologies Corporation Analysis: April 2016 contract sees SpaceX take strides into Launch Service Submarket
8.12.3 With history of technological innovation SpaceX is well placed to make significant gains in Military Satellite Market
8.13 Thales Group
8.13.1 Thales Group Military Satellites Selected Recent Contracts 2013-2017
8.13.2 Thales Group Total Company Sales 2012-2017
8.13.3 Thales Group Sales by Segment of Business 2012-2017
8.13.4 Thales Group Net Income / Loss 2012-2017
8.13.5 Thales Group Cost of Research & Development 2012-2017
8.13.6 Thales Group Regional Emphasis / Focus
8.13.7 Thales Group Organisational Structure
8.13.8 Thales Group Mergers & Acquisitions (M&A) and Divestiture Activity
8.13.9 Thales Group Analysis: Thales Alenia Space at the heart of Franco-Italian Cooperation through the Sicral and Athena Fidus constellations
8.14 ViaSat Inc
8.14.1 ViaSat Inc Military Satellites Selected Recent Contracts 2014-2018
8.14.2 ViaSat Inc Total Company Sales 2013-2017
8.14.3 ViaSat Inc Sales by Segment of Business 2013-2017
8.14.4 ViaSat Inc Net Income / Loss 2013-2017
8.14.5 ViaSat Inc Regional Emphasis / Focus
8.14.6 ViaSat Inc Corporation Organisational Structure
8.14.7 ViaSat Inc. Mergers & Acquisitions (M&A) and Divestiture Activity
8.14.8 ViaSat Inc Analysis: ViaSat’s Cutting-Edge Commercial Technology Offers Potential High-Capacity Satellite Solutions to Military Satellite Market
8.15 Other Companies Involved in the Military Satellites Market 2017
8.15.1 DataPath Inc.
8.15.2Honeywell International Inc.
8.15.3LinQuest Corporation
8.15.5Pacific Defence Solutions LLC
8.15.6SpaceQuest Ltd
8.15.7SSL (formerly Space Systems/Loral LLC)
9. Conclusions and Recommendations
10. Glossary
Associated Visiongain Reports
Visiongain Report Sales Order Form
Appendix A
About Visiongain
Appendix B
Visiongain report evaluation form
List of Tables
Table 3.1 Global Military Satellites Market Forecast 2018-2028 (US$m, AGR %, CAGR %, Cumulative)
Table 3.2 Global Military Satellites Market Drivers & Restraints 2018
Table 4.1 Global Military Satellites Submarket Forecast 2018-2028 (US$m, AGR %, CAGR %, Cumulative)
Table 4.2 Global Military Satellites Submarket CAGR Forecast 2018-2023, 2023-2028, 2018-2028 (CAGR %)
Table 4.3 Global Military Satellites Submarket Percentage Change in Market Share 2018-2023, 2023-2028, 2018-2028 (% Change)
Table 4.4 Global Military Satellites Satellite Buses Submarket Market Forecast 2018-2028 (US$m, AGR %, CAGR %, Cumulative)
Table 4.5 Global Military Satellites Payloads & Communications Terminals Submarket Market Forecast 2018-2028 (US$m, AGR %, CAGR %, Cumulative)
Table 4.6 Global Military Satellites Launch Services Submarket Market Forecast 2018-2028 (US$m, AGR %, CAGR %, Cumulative)
Table 4.7 Global Military Satellites Anti-Satellite Weapons (ASATs) Submarket Market Forecast 2018-2028 (US$m, AGR %, CAGR %, Cumulative)
Table 5.1 Leading National Military Satellites Market Forecast 2018-2028 (US$m, Global AGR %, Cumulative)
Table 5.2 Global Military Satellites Submarket by National Market CAGR Forecast 2018-2023, 2023-2028, 2018-2028 (CAGR %)
Table 5.3 National Military Satellites Market Percentage Change in Market Share 2018-2023, 2023-2028, 2018-2028 (% Change)
Table 5.4 Australian Military Satellites Market Forecast 2018-2028 (US$m, AGR %, CAGR %, Cumulative)
Table 5.5 Australian Military Satellites Market Major Contracts & Launches 2007-2017 (Date, Company, Value US$m, Details)
Table 5.6 Australian Military Satellites Market Drivers & Restraints 2018
Table 5.7 Chinese Military Satellites Market Forecast 2018-2028 (US$m, AGR %, CAGR %, Cumulative)
Table 5.8 Chinese Military Satellites Market Major Contracts & Launches 2009-2018 (Company, Platform Designation, Launch dates, Description)
Table 5.9 Chinese Military Satellites Market Drivers & Restraints 2018
Table 5.10 French Military Satellites Market Forecast 2018-2028 (US$m, AGR %, CAGR %, Cumulative)
Table 5.11 French Military Satellites Market Major Contracts & Launches 2010-2016 (Date, Company, Value US$m, Details)
Table 5.12 French Military Satellites Market Drivers & Restraints 2018
Table 5.13 German Military Satellites Market Forecast 2018-2028 (US$m, AGR %, CAGR %, Cumulative)
Table 5.14 German Military Satellites Market Major Contracts & Launches 2013-2017 (Date, Company, Value US$m, Details)
Table 5.15 German Military Satellites Market Drivers & Restraints 2018
Table 5.16 Indian Military Satellites Market Forecast 2018-2028 (US$m, AGR %, CAGR %, Cumulative)
Table 5.17 Indian Military Satellites Market Major Contracts & Launches 2009-2017 (Agency/Company, Platform Designation, Launch Dates, Description)
Table 5.18 Indian Military Satellites Market Drivers & Restraints 2018
Table 5.19 Israeli Military Satellites Market Forecast 2018-2028 (US$m, AGR %, CAGR %, Cumulative)
Table 5.20 Israeli Military Satellites Market Major Contracts & Launches 2008-2014 (Company, Platform Designation, Launch Dates, Description)
Table 5.21 Israeli Military Satellites Market Drivers & Restraints 2018
Table 5.22 Italian Military Satellites Market Forecast 2018-2028 (US$m, AGR %, CAGR %, Cumulative)
Table 5.23 Italian Military Satellites Market Major Contracts & Launches 2010-2017 (Date, Company, Value US$m, Details)
Table 5.24 Italian Military Satellites Market Drivers & Restraints 2018
Table 5.25 Russian Military Satellites Market Forecast 2018-2028 (US$m, AGR %, CAGR %, Cumulative)
Table 5.26 Russian Military Satellites Market Major Contracts & Launches 2005-2020 (Company, Platform Designation, Launch dates, Description)
Table 5.27 Russian Military Satellites Market Drivers & Restraints 2018
Table 5.28 Spanish Military Satellites Market Forecast 2018-2028 (US$m, AGR %, CAGR %, Cumulative)
Table 5.29 Spanish Military Satellites Market Major Contracts & Launches 2005-2018 (Launch Date, Company, Value US$m, Details)
Table 5.30 Spanish Military Satellites Market Drivers & Restraints 2018
Table 5.31 UK Military Satellites Market Forecast 2018-2028 (US$m, AGR %, CAGR %, Cumulative)
Table 5.32 UK Military Satellites Market Major Contracts & Launches 2003-2017 (Date, Company, Value US$m, Details)
Table 5.33 UK Military Satellites Market Drivers & Restraints 2018
Table 5.34 USA Military Satellites Market Forecast 2018-2028 (US$m, AGR %, CAGR %, Cumulative)
Table 5.35 USA Military Satellites Market Major Contracts & Launches 2014-2018 (Date, Company, Value US$m, Details)
Table 5.36 USA Military Satellites Market Drivers & Restraints 2018
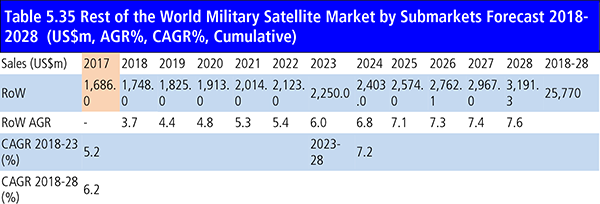
Table 5.37 Rest of the World Military Satellites Market Forecast 2018-2028 (US$m, AGR %, CAGR %, Cumulative)
Table 5.38 Rest of the World Military Satellites Market Major Contracts & Launches 2012-2018 (Date, Country, Value US$m, Details)
Table 5.39 Rest of the World Military Satellites Market Drivers & Restraints 2018
Table 6.1 Global Military Satellites Market SWOT Analysis 2018-2028
Table 7.1 Global Military Satellites Market PEST Analysis 2018-2028
Table 8.1 Leading 13 Military Satellites Companies Listed Alphabetically (Company, FY2017 Total Company Sales (US$m), HQ)
Table 8.2 Airbus Group SE Profile 2017 (CEO, Total Company Sales US$m, Sales in the Defence and Space Market US$m, Share of Total Company Sales from Defence and SpaceSegment %, Net Income US$m, Strongest Business Region, Business Segment in the Market, Submarket Involvement, HQ, Founded, IR Contact, Ticker, Website)
Table 8.3 Selected Recent Airbus Group SE Military Satellites Contracts 2003-2016 (Date, Country, Subcontractor, Value US$m, Details)
Table 8.4 Airbus Group SE Total Company Sales 2012-2017 (US$m, AGR %)
Table 8.5 Airbus Group SE Sales by Segment of Business 2012-2017 (US$m, AGR %)
Table 8.6 Airbus Group SE Net Income 2012-2017 (US$m, AGR %)
Table 8.7 Airbus Group SE Cost of Research & Development 2012-2017 (US$m, AGR %)
Table 8.8 Airbus Group SE Sales by Geographical Location 2012-2017 (US$m, AGR %)
Table 8.9 Airbus Group SE Subsidiaries 2017 (Subsidiary, Location)
Table 8.10 Thales Group Mergers &Acquisitions and Divestitures2010-2017 (Type of action, Date, Details)
Table 8.11 The Boeing Company Profile 2017 (CEO, Total Company Sales US$m, Sales in the Market US$m,Net Income US$m, Strongest Business Region, Business Segment in the Market, HQ, Founded, IR Contact, Ticker, Website)
Table 8.12 Selected Recent The Boeing Company Military Satellites Contracts 2014-2017 (Date, Country, Value US$m, Details)
Table 8.13The Boeing Company Total Company Sales 2012-2017 (US$m, AGR %)
Table 8.14 The Boeing Company Sales by Segment of Business 2012-2017 (US$m, AGR %)
Table 8.15 The Boeing Company Net Income 2010-2015 (US$m, AGR %)
Table 8.16 The Boeing Company Cost of Research & Development 2012-2017 (US$m, AGR %)
Table 8.17 The Boeing Company Sales by Geographical Location 2012-2017 (US$m, AGR %)
Table 8.18 The Boeing Company Subsidiaries 2017 (Subsidiary, Location)
Table 8.19 The Boeing Company Mergers and Acquisitions 2008-2017 (Type of Activity, Date, Company Involved, Value US$m, Details)
Table 8.20 Inmarsat Profile 2017 (CEO, Total Company Sales US$m, Sales in the Market US$m, Share of Company Sales from Government SystemsSegment %, Net Income / Loss US$m, Strongest Business Region, Business Segment in the Market, Submarket Involvement, HQ, Founded, IR Contact, Ticker, Website)
Table 8.21 Selected Recent The Boeing Company Military Satellites Contracts 2014 (Date, Country, Value US$m, Details)
Table 8.22 Inmarsat Total Company Sales 2012-2017 (US$m, AGR %)
Table 8.23 Inmarsat Sales by Segment of Business 2012-2014 (US$m, AGR %)
Table 8.24 Inmarsat Net Income 2012-2017 (US$m, AGR %)
Table 8.25 Inmarsat Cost of Research & Development 2012-2017 (US$m, AGR %)
Table 8.26 Inmarsat Sales by Geographical Location 2012-2017 (US$m, AGR %)
Table 8.27 Inmarsat Subsidiaries 2017 (Subsidiary, Location)
Table 8.28 Israel Aerospace Industries Profile 2017 (CEO, Total Company Sales US$m, Net Income US$m, Strongest Business Region, Business Segment in the Market, Submarket Involvement, HQ, Founded, Ticker, Website)
Table 8.29 Selected Recent Israel Aerospace Industries Military Satellites Contracts 2012-2017 (Date, Country, Value US$m, Details)
Table 8.30 Israel Aerospace Industries Total Company Sales 2012-2017 (US$m, AGR %)
Table 8.31 Israel Aerospace Industries Sales by Segment of Business 2012-2017 (US$m, AGR %)
Table 8.32 Israel Aerospace Industries Net Income 2012-2017 (US$m, AGR %)
Table 8.33 Israel Aerospace Industries Cost of Research & Development 2012-2017 (US$m, AGR %)
Table 8.34 IAI Mergers and Acquisitions 2014-2017 (Type of Activity, Date, Company Involved, Value US$m, Details)
Table 8.35 ISS Reshetnev Profile 2017 (Director General, Total Company Sales US$m, Sales in the Market US$m, Share of Total Company Sales from Military Satellites Market %, Strongest Business Region, Submarket Involvement, HQ, Founded, Website)
Table 8.36 Selected Recent ISS Reshetnev Military Satellites Contracts / Programmes 2005-2020 (Launch Date, Country, Satellite Platform, Details)
Table 8.37 Lockheed Martin Corporation Profile 2017 (CEO, Total Company Sales US$m, Net Income US$m, Strongest Business Region, Business Segment in the Market, Submarket Involvement, HQ, Founded, IR Contact, Ticker, Website)
Table 8.38 Selected Recent Lockheed Martin Corporation Military SatellitesContracts 2014-2017 (Date, Country, Value US$m, Details)
Table 8.39 Lockheed Martin Corporation Total Company Sales 2012-2017 (US$m, AGR %)
Table 8.40 Lockheed Martin Corporation Sales by Segment of Business 2012-2017 (US$m, AGR %)
Table 8.41 Lockheed Martin Corporation Net Income2012-2017 (US$m, AGR %)
Table 8.42 Lockheed Martin Corporation Cost of Research & Development 2012-2017 (US$m, AGR %)
Table 8.43 Lockheed Martin Corporation Sales by Geographical Location 2012-2017 (US$m, AGR %)
Table 8.44 Lockheed Martin Corporation Subsidiaries 2017 (Subsidiary, Location)
Table 8.45 Lockheed Martin CorporationMilitary SatellitesProducts / Services (Segment of Business, Product, Specification / Features)
Table 8.46 Lockheed Martin Corporation Mergers & Acquisitions and Divestitures 2008-2015 (Type of activity, Date, Details)
Table 8.47 Mitsubishi Electric Corporation Profile 2017 (CEO, Total Company Sales US$m, Sales in the Information and Communication Systems Segment US$m, Share of Company Sales from Information and Communication Systems Segment%, Net Income US$m, Strongest Business Region, Business Segment in the Market, Submarket Involvement, HQ, Founded, IR Contact, Ticker, Website)
Table 8.48 Selected Recent Mitsubishi Electric Corporation Military Satellites Contracts / Programmes 2014-2017 (Launch Date, Country, Satellite Platform, Details)
Table 8.49 Mitsubishi Electric Corporation Total Company Sales 2013-2017 (US$m, AGR %)
Table 8.50 Mitsubishi Electric Corporation Sales by Segment of Business 2013-2017 (US$m, AGR %)
Table 8.51 Mitsubishi Electric Corporation Net Income 2013-2017 (US$m, AGR %)
Table 8.52 Mitsubishi Electric Corporation Cost of Research & Development 2013-2017 (US$m, AGR %)
Table 8.53 Mitsubishi Electric Corporation Sales by Geographical Location 2013-2017 (US$m, AGR %)
Table 8.54 Orbital ATK Inc. Profile 2017 (CEO, Total Company Sales US$m, Sales in the Space Systems Group US$m, Share of Total Company Sales from Space Systems Market %, Net Income US$m, Strongest Business Region, Business Segment in the Market, Submarket Involvement, HQ, Founded, IR Contact, Ticker, Website)
Table 8.55 Selected Recent Orbital ATK Inc. Military Satellites Contracts / Programmes 2015-2017 (Launch Date, Country, Satellite Platform, Details)
Table 8.56 Orbital ATK Inc. Total Company Sales 2012-2017 (US$m, AGR %)
Table 8.57 Orbital ATK Inc. Sales by Segment of Business 2013-2017 (US$m, AGR %)
Table 8.58 Orbital ATK Inc. Net Income 2012-2017 (US$m, AGR %)
Table 8.59 Orbital ATK Inc. Cost of Research & Development 2012-2017 (US$m, AGR %)
Table 8.60 Orbital ATK Inc. Sales by Geographical Location 2013-2017 (US$m, AGR %)
Table 8.61 Orbital ATK Inc. Subsidiaries 2017 (Subsidiary, Location)
Table 8.58Orbital ATK Inc. Mergers & Acquisitions and Divestitures 2013-2017 (Type of activity, Date, Details)
Table 8.62 Raytheon Company Profile 2017 (CEO, Total Company Sales US$m, Net Income US$m, Strongest Business Region, Business Segment in the Market, Submarket Involvement, HQ, Founded, IR Contact, Ticker, Website)
Table 8.63 Selected Recent Orbital ATK Inc. Military Satellites Contracts / Programmes 2014-2017 (Launch Date, Country, Satellite Platform, Details)
Table 8.64 Raytheon Company Total Company Sales 2012-2017 (US$m, AGR %)
Table 8.65 Raytheon Company Sales by Segment of Business 2012-2017 (US$m, AGR %)
Table 8.66 Raytheon Company Net Income 2012-2017 (US$m, AGR %)
Table 8.67 Raytheon Company Cost of Research & Development 2012-2017 (US$m, AGR %)
Table 8.68 Raytheon Company Sales by Geographical Location 2012-2017 (US$m, AGR %)
Table 8.69 Raytheon Company Mergers & Acquisitions 2001-2014 (Date, Details)
Table 8.70 SES S.A. Profile 2017 (CEO, Total Company Sales US$m, Sales in the Government Segment US$m, Share of Company Sales from Government Market %, Net Income US$m, Strongest Business Region, Business Segment in the Market, Submarket Involvement, HQ, Founded, IR Contact, Ticker, Website)
Table 8.71 Selected Recent SES S.A. Military Satellites Contracts / Projects / Programmes 2015-2016 (Date, Country, Value US$m, Details)
Table 8.72 SES S.A. Total Company Sales 2012-2017 (US$m, AGR %)
Table 8.73 SES S.A. Sales by Segment of Business 2014-2016 (US$m, AGR %)
Table 8.74 SES S.A. Net Income 2012-2017 (US$m, AGR %)
Table 8.75 SES S.A. Sales by Geographical Location 2012-2017 (US$m, AGR %)
Table 8.76 Orbital ATK Inc. Mergers & Acquisitions and Divestitures 2016 (Type of activity, Date, Details)
Table 8.77 Space Exploration Technologies Corporation Profile 2017 (CEO, Strongest Business Region, Submarket Involvement, HQ, Founded, Website)
Table 8.78 Selected Space Exploration Technologies Corporation Military Satellites Contracts 2017 (Date, Value US$m, Details)
Table 8.79 Thales Group Profile 2017 (CEO, Total Company Sales US$m, Net Income US$m, Strongest Business Region, Business Segment in the Market, Submarket Involvement, HQ, Founded, IR Contact, Ticker, Website)
Table 8.80 Selected Recent Thales Group Military Satellites Contracts 2013-2017 (Date, Contractor, Value US$m, Country, Details)
Table 8.81 Thales Group Total Company Sales 2012-2017 (US$m, AGR %)
Table 8.82 Thales Group Sales by Segment of Business 2012-2017 (US$m, AGR %)
Table 8.83 Thales Group Net Income / Loss 2012-2017 (US$m, AGR %)
Table 8.84 Thales Group Cost of Research & Development 2012-2017 (US$m, AGR %)
Table 8.85 Thales Group Sales by Geographical Location 2012-2017 (US$m, AGR %)
Table 8.86 Thales Group Mergers &Acquisitions and Divestitures2012-2016 (Activity, Date, Details)
Table 8.87 ViaSat Inc Profile 2017 (CEO, Total Company Sales US$m, Net Income US$m, Strongest Business Region, Business Segment in the Market, Submarket Involvement, HQ, Founded, IR Contact, Ticker, Website)
Table 8.88 Selected Recent ViaSat Inc Military Satellites Contracts 2014-2018 (Date, Country, Value US$m, Details)
Table 8.89 ViaSat Inc Total Company Sales 2013-2017 (US$m, AGR %)
Table 8.90 ViaSat Inc Sales by Segment of Business 2013-2017 (US$m, AGR %)
Table 8.91 ViaSat Inc Net Income / Loss 2013-2017 (US$m)
Table 8.92 ViaSat Inc Sales by Geographical Location 2013-2017 (US$m, AGR %)
Figure 8.96 ViaSat Inc Corporation Organisational Structure 2017
Table 8.93 ViaSat Inc. Mergers &Acquisitions and Divestitures2014 (Activity, Date, Details)
Table 8.94 Other Companies Involved in the Military Satellites Market 2017 (Company, Revenue US$m, Location)
Table 8.95 DataPath Inc. Overview 2017 (Total Company Revenue US$m, Activity in the Military Satellites Market, HQ, Ticker, IR Contact, Website)
Table 8.96 Honeywell International Inc. Overview 2017 (Total Company Revenue US$m, Activity in the Military Satellites Market, HQ, Ticker, IR Contact, Website)
Table 8.97 LinQuest Corporation Overview 2017 (Total Company Revenue US$m, Activity in the Military Satellites Market, HQ, IR Contact, Website)
Table 8.98 Northrop GrummanCorporation Overview 2015 (Total Company Revenue US$m, Activity in the Military Satellites Market, HQ, Ticker, IR Contact, Website)
Table 8.99 Pacific Defence Solutions LLC Overview 2017 (Total Company Revenue US$m, Activity in the Military Satellites Market, HQ, IR Contact)
Table 8.100 SpaceQuest Ltd Overview 2017 (Total Company Revenue US$m, Activity in the Military Satellites Market, HQ, IR Contact, Website)
Table 8.101 SSL Overview 2015 (Total Company Revenue US$m, Activity in the Military Satellites Market, HQ, Ticker, IR Contact, Website)
List of Figures
Figure 2.1 Global Military Satellites Market Segmentation Overview
Figure 3.1 Global Military Satellites Market Forecast 2018-2028 (US$m, AGR %)
Figure 4.1 Global Military Satellites Submarket AGR Forecast 2018-2028 (AGR %)
Figure 4.2 Global Military Satellites Submarket Forecast 2018-2028 (US$m, Global AGR %)
Figure 4.3 Global Military Satellites Market by Submarket Share Forecast 2018 (% Share)
Figure 4.4 Global Military Satellites Market by Submarket Share Forecast 2023 (% Share)
Figure 4.5 Global Military Satellites Market by Submarket Share Forecast 2028 (% Share)
Figure 4.6 Global Military Satellites Submarket CAGR Forecast 2018-2023 (CAGR %)
Figure 4.7 Global Military Satellites Submarket CAGR Forecast 2023-2028 (CAGR %)
Figure 4.8 Global Military Satellites Submarket CAGR Forecast 2018-2028 (CAGR %)
Figure 4.9 Global Military Satellites Submarket Percentage Change in Market Share 2018-2023 (% Change)
Figure 4.10 Global Military Satellites Submarket Percentage Change in Market Share 2023-2028 (% Change)
Figure 4.11 Global Military Satellites Submarket Percentage Change in Market Share 2018-2028 (% Change)
4.1 Global Military Satellites Satellite Buses Submarket Forecast 2018-2028
Figure 4.12 Global Military Satellites Satellite Buses Submarket Market Forecast 2018-2028 (US$m, AGR %)
Figure 4.13 Global Military Satellites Satellite Buses Market Share Market Forecast 2018 (% Share)
Figure 4.14 Global Military Satellites Satellite Buses Market Share Market Forecast 2023 (% Share)
Figure 4.15 Global Military Satellites Satellite Buses Market Share Market Forecast 2028 (% Share)
Figure 4.16 Global Military Satellites Payloads & Communications Terminals Submarket Market Forecast 2018-2028 (US$m, AGR %)
Figure 4.17 Global Military Satellites Payloads & Communications Terminals Market Share Market Forecast 2018 (% Share)
Figure 4.18 Global Military Satellites Payloads & Communications Terminals Market Share Market Forecast 2023 (% Share)
Figure 4.19 Global Military Satellites Payloads & Communications Terminals Market Share Market Forecast 2026 (% Share)
Figure 4.20 Global Military Satellites Launch Services Submarket Market Forecast 2018-2028 (US$m, AGR %)
Figure 4.21 Global Military Satellites Launch Services Market Share Market Forecast 2018 (% Share)
Figure 4.22 Global Military Satellites Launch Services Market Share Market Forecast 2023 (% Share)
Figure 4.23 Global Military Satellites Launch Services Market Share Market Forecast 2028 (% Share)
Figure 4.24 Global Military Satellites Anti-Satellite Weapons (ASATs) Submarket Market Forecast 2018-2028 (US$m, AGR %)
Figure 4.25 Global Military Satellites Anti-Satellite Weapons (ASATs) Market Share Market Forecast 2018 (% Share)
Figure 4.26 Global Military Satellites Anti-Satellite Weapons (ASATs) Market Share Market Forecast 2023 (% Share)
Figure 4.27 Global Military Satellites Anti-Satellite Weapons (ASATs) Market Share Market Forecast 2028 (% Share)
Figure 5.1 Global Military Satellites Market by National Market Forecast 2018-2028 (US$m, Global AGR %)
Figure 5.2 Global Military Satellites Market by National Market AGR Forecast 2018-2028 (AGR %)
Figure 5.3 Leading National Military Satellites Market CAGR Forecast 2018-2023 (CAGR %)
Figure 5.4 Leading National Military Satellites Market CAGR Forecast 2023-2028 (CAGR %)
Figure 5.5 Leading National Military Satellites Market CAGR Forecast 2018-2028 (CAGR %)
5.1 Global Military Satellites Market by National Market Share Forecast 2018-2028
Figure 5.6 Global Military Satellites Market by National Market Share Forecast 2018 (% Share)
Figure 5.7 Global Military Satellites Market by National Market Share Forecast 2023 (% Share)
Figure 5.8 Global Military Satellites Market by National Market Share Forecast 2028 (% Share)
Figure 5.9 Australian Military Satellites Market Forecast 2018-2028 (AGR %)
Figure 5.10 Australian Military Satellites Market Share Forecast 2018, 2023, 2028 (% Share)
Figure 5.11 Chinese Military Satellites Market Forecast 2018-2028 (AGR %)
Figure 5.12 Chinese Military Satellites Market Share Forecast 2018, 2023, 2028 (% Share)
Figure 5.13 French Military Satellites Market Forecast 2018-2028 (AGR %)
Figure 5.14 French Military Satellites Market Share Forecast 2018, 2023, 2028 (% Share)
Figure 5.15 German Military Satellites Market Forecast 2018-2028 (AGR %)
Figure 5.16 German Military Satellites Market Share Forecast 2018, 2023, 2028 (% Share)
Figure 5.17 Indian Military Satellites Market Forecast 2018-2028 (AGR %)
Figure 5.18 Indian Military Satellites Market Share Forecast 2018, 2023, 2028 (% Share)
Figure 5.19 Israeli Military Satellites Market Forecast 2018-2028 (AGR %)
Figure 5.20 Israeli Military Satellites Market Share Forecast 2018, 2023, 2028 (% Share)
Figure 5.21 Italian Military Satellites Market Forecast 2018-2028 (AGR %)
Figure 5.22 Italian Military Satellites Market Share Forecast 2018, 2023, 2028 (% Share)
Figure 5.23 Russian Military Satellites Market Forecast 2018-2028 (AGR %)
Figure 5.24 Russian Military Satellite Market Share Forecast 2018, 2023, 2028 (% Share)
Figure 5.25 Spanish Military Satellites Market Forecast 2018-2028 (AGR %)
Figure 5.26 Spanish Military Satellites Market Share Forecast 2018, 2023, 2028 (% Share)
Figure 5.27 UK Military Satellites Market Forecast 2018-2028 (AGR %)
Figure 5.28 UK Military Satellites Market Share Forecast 2018, 2023, 2028 (% Share)
Figure 5.29 USA Military Satellites Market Forecast 2018-2028 (AGR %)
Figure 5.30 USA Military Satellites Market Share Forecast 2018, 2023, 2028 (% Share)
Figure 5.31 Rest of the World Military Satellites Market Forecast 2018-2028 (AGR %)
Figure 5.32 Rest of the World Market Share Forecast 2018, 2023, 2028 (% Share)
Figure 8.1 Airbus Group SE Total Company Sales 2012-2017
(US$m, AGR %)
Figure 8.2 Airbus Group SE Sales by Segment of Business 2012-2017 (US$m, Total Company Sales AGR %)
Figure 8.3 Airbus Group SE Sales AGR by Segment of Business 2013-2017 (Sales AGR %)
8.2.4 Airbus Group SE Net Income 2012-2017
Figure 8.4 Airbus Group SE Net Income 2012-2017 (US$m, AGR %)
8.2.5 Airbus Group SE Cost of Research & Development 2012-2017
Figure 8.5 Airbus Group SE Cost of Research & Development 2012-2017 (US$m, AGR %)
8.2.6 Airbus Group SE Regional Emphasis / Focus
Figure 8.6 Airbus Group SE Primary International Operations 2017
Figure 8.7 Airbus Group SE Sales AGR by Geographical Location 2013-2017 (AGR %)
Figure 8.8 Airbus Group SE Sales by Geographical Location 2012-2017 (US$m, Total Company Sales AGR %)
Figure 8.9 Airbus Group SE Organisational Structure 2017
Figure 8.10 The Boeing Company Total Company Sales 2012-2017 (US$m, AGR %)
Figure 8.11 The Boeing Company Sales by Segment of Business 2012-2017 (US$m, Total Company Sales AGR %)
Figure 8.12 The Boeing Company Sales AGR by Segment of Business 2013-2016 (AGR %)
8.3.4The Boeing Company Net Income / Loss 2012-2017
Figure 8.13 The Boeing Company Net Income 2012-2017 (US$m, AGR %)
8.3.5 The Boeing Company Cost of Research & Development 2012-2017
Figure 8.14 The Boeing Company Cost of Research & Development 2012-2017 (US$m, AGR %)
8.3.6 The Boeing Company Regional Emphasis / Focus
Figure 8.15 The Boeing Company Primary International Operations 2017
Figure 8.16 The Boeing Company Sales AGR by Geographical Location 2012-2017 (AGR %)
Figure 8.17 The Boeing Company Sales by Geographical Location 2012-2017 (US$m, Total Company Sales AGR %)
Figure 8.18 The Boeing Company Organisational Structure 2017
Figure 8.19 Inmarsat Total Company Sales 2012-2017 (US$m, AGR %)
Figure 8.20 Inmarsat Sales by Segment of Business 2012-2017 (US$m, Total Company Sales AGR %)
Figure 8.21 Inmarsat Sales AGR by Segment of Business 2013-2016 (Sales AGR %)
Figure 8.22 Inmarsat Net Income 2012-2017 (US$m, AGR %)
Figure 8.23 Inmarsat Cost of Research & Development 2012-2017 (US$m, AGR %)
Figure 8.24 Inmarsat Primary International Operations 2017
Figure 8.25 Inmarsat Sales AGR by Geographical Location 2013-2016 (AGR %)
Figure 8.26 Inmarsat Sales by Geographical Location 2012-2017 (US$m, Total Company Sales AGR %)
Figure 8.27 Inmarsat Organisational Structure 2017
Figure 8.28 Israel Aerospace Industries Total Company Sales 2012-2017 (US$m, AGR %)
Figure 8.29 Israel Aerospace Industries Sales by Segment of Business 2012-2017 (US$m, Total Company Sales AGR %)
Figure 8.30 Israel Aerospace Industries Sales AGR by Segment of Business 2013-2017 (AGR %)
Figure 8.31 Israel Aerospace Industries Net Income 2012-2015 (US$m, AGR %)
Figure 8.32 Israel Aerospace Industries Cost of Research & Development 2010-2015 (US$m, AGR %)
Figure 8.33 Israeli Aerospace Industries Primary International Operations 2017
Figure 8.34 Israel Aerospace Industries Organisational Structure 2017
Figure 8.35 ISS Reshetnev Primary International Operations 2017
Figure 8.36 Lockheed Martin Corporation Total Company Sales 2012-2017 (US$m, AGR %)
Figure 8.37 Lockheed Martin Corporation Sales by Segment of Business 2012-2017 (US$m, Total Company Sales AGR %)
Figure 8.38 Lockheed Martin Corporation Sales AGR by Segment of Business 2013-2016 (AGR %)
Figure 8.39 Lockheed Martin Corporation Net Income2012-2017 (US$m, AGR %)
Figure 8.40 Lockheed Martin Corporation Cost of Research & Development 2012-2017 (US$m, AGR %)
Figure 8.41 Lockheed Martin Corporation Primary International Operations 2017
Figure 8.42 Lockheed Martin Corporation Sales AGR by Geographical Location 2013-2017 (AGR %)
Figure 8.43 Lockheed Martin Corporation Sales by Geographical Location 2012-2017 (US$m, Total Company Sales AGR %)
Figure 8.44 Lockheed Martin Corporation Organisational Structure 2017
Figure 8.45 Mitsubishi Electric Corporation Total Company Sales 2013-2017 (US$m, AGR %)
Figure 8.46 Mitsubishi Electric Corporation Sales by Segment of Business 2013-2017 (US$m, Total Company Sales AGR %)
Figure 8.47 Mitsubishi Electric Corporation Sales AGR by Segment of Business 2014-2017 (AGR %)
Figure 8.48 Mitsubishi Electric Corporation Net Income2013-2017 (US$m, AGR %)
Figure 8.49 Mitsubishi Electric Corporation Cost of Research & Development 2013-2017 (US$m, AGR %)
Figure 8.50 Mitsubishi Electric Corporation Primary International Operations 2017
Figure 8.51 Mitsubishi Electric Corporation Sales AGR by Geographical Location 2014-2017 (AGR %)
Figure 8.52 Mitsubishi Electric Corporation Sales by Geographical Location 2013-2017 (US$m, Total Company Sales AGR %)
Figure 8.53 Mitsubishi Electric Corporation Organisational Structure 2017
Figure 8.54 Orbital ATK Inc. Total Company Sales 2012-2017 (US$m, AGR %)
Figure 8.55 Orbital ATK Inc. Sales by Segment of Business 2013-2016 (US$m)
Figure 8.56 Orbital ATK Inc. Sales AGR by Segment of Business 2014-2017 (US$m)
Figure 8.57 Orbital ATK Inc. Net Income 2012-2017 (US$m, AGR %)
Figure 8.58 Orbital ATK Inc. Cost of Research & Development 2012-2017 (US$m, AGR %)
Figure 8.59 Orbital ATK Inc. Primary International Operations 2017
Figure 8.60 Orbital ATK Inc. Sales by Geographical Location 2013-2017 (US$m, Total Company Sales AGR %)
Figure 8.61 Orbital ATK Inc. Sales AGR by Geographical Location 2014-2017 (AGR %)
Figure 8.62 Orbital ATK Inc. Organisational Structure 2017
Figure 8.63 Raytheon Company Total Company Sales 2012-2017 (US$m, AGR %)
Figure 8.64 Sales by Segment of Business 2012-2017 (US$m, Total Company Sales AGR %)
Figure 8.65 Raytheon Company Sales AGR by Segment of Business 2013-2017 (AGR %)
Figure 8.66 Raytheon Company Net Income 2012-2017 (US$m, AGR %)
Figure 8.67 Raytheon Company Cost of Research & Development 2012-2017 (US$m, AGR %)
Figure 8.68 Raytheon Company Primary International Operations 2017
Figure 8.69 Raytheon Company Sales AGR by Geographical Location 2013-2017 (AGR %)
Figure 8.70 Raytheon Company Sales by Geographical Location 2012-2017 (US$m, Total Company Sales AGR %)
Figure 8.71 Raytheon Company Organisational Structure 2017
Figure 8.72 SES S.A. Total Company Sales 2012-2017 (US$m, AGR %)
Figure 8.73 SES S.A. Sales AGR by Segment of Business 2015-2017 (Sales AGR %)
Figure 8.74 SES S.A. Sales by Segment of Business 2014-2017 (US$m)
Figure 8.75 SES S.A. Net Income 2012-2017 (US$m, AGR %)
Figure 8.76 SES S.A. Primary International Operations 2017
Figure 8.77 SES S.A. Sales AGR by Segment of Business 2013-2017 (Sales AGR %)
Figure 8.78 SES S.A. Sales by Geographical Location 2012-2017 (US$m, Total Company Sales AGR %)
Figure 8.79 SES S.A. Organisational Structure 2017
Figure 8.80 Thales Group Total Company Sales 2012-2017 (US$m, AGR %)
Figure 8.81 Thales Group Sales by Segment of Business 2012-2017 (US$m, Total Company Sales AGR %)
Figure 8.82 Thales Group Sales AGR by Segment of Business 2012-2017 (Sales AGR %)
Figure 8.83 Thales Group Net Income / Loss 2012-2017 (US$m, AGR %)
Figure 8.84 Thales Group Cost of Research & Development 2012-2017 (US$m, AGR %)
Figure 8.85 Thales Group Primary International Operations 2017
Figure 8.86 Thales Group Sales by Geographical Location 2012-2017 (US$m, Total Company Sales AGR %)
Figure 8.87 Thales Group Sales AGR by Geographical Location 2012-2017 (Sales AGR %)
Figure 8.88 Thales Group Organisational Structure 2017
Figure 8.89 ViaSat Inc Total Company Sales 2013-2017 (US$m, AGR %)
Figure 8.90 ViaSat Inc Sales by Segment of Business 2013-2017 (US$m, Total Company Sales AGR %)
Figure 8.91 ViaSat Inc Sales AGR by Segment of Business 2014-2017 (AGR %)
Figure 8.92 ViaSat Inc Net Income / Loss 2013-2017 (US$m)
Figure 8.93 ViaSat Inc Primary International Operations 2017
Figure 8.94 ViaSat Inc Sales AGR by Geographical Location 2014-2017 (AGR %)
Figure 8.95 ViaSat Inc Sales by Geographical Location 2013-2017 (US$m, Total Company Sales AGR %)
Amor Group
Applied Signal Technology, Inc
Areva SA
Arkoon Network Security
Asia Broadcast Satellite
Asia Public Co.,
Astrium Services GmbH, Ottobrunn
Astrotech
Aurora Flight Sciences
Aveos Fleet Performance
Ball Aerospace
Bharat Electronics Limited (BEL)
Blackbird Technologies, Incorporated
Boeing
BRAZILIAN SPACE AGENCY
C4 Advanced Solutions
Carl Zeiss Optronics GmbH
Cassidian
CDL Systems Ltd
Centre for Strategic and Budgetary Assessments
Chandler/May Inc
Chinese Aerospace Science and Technology Corporation
Cloudwatt
Danish armed forces
DARPA
Dassault Aviation
Data Path Inc
Dauria Aerospace
DCNS
Deposition Sciences Inc
Diehl Air Cabin GmbH
DLR,
DSN Corp
Dynamatic Technologies Ltd
Elancourt
Elbe Flugzeugwerke, Dresden
ELTA Systems Ltd.
Eurocopter
EutelSat
FIMI
Finmeccanica (now Leonardo)
French Defence Department
Générale de l’Armement (DGA) , France
Georgia Tech Research Institute
Getafe
GovSat
Harris Information Technology Services Inc.
Henggeler Computer Consultants Inc
Hensoldt
Herndon
Honeywell International Inc.
Hughes Network Systems
Immenstaad
Indian Space Research Organisation
Industrial Defender
Information Satellite Systems
Inmarsat
Intelsat
Iridium Communications Inc
Israel Aerospace Industries
ISS Reshetnev
Italian Defense Ministry
Japan Aerospace Exploration Agency
JenaOptronik GmbH
Kosmotras launch Agency and King Abdulaziz City for Science and Technology (KACST)
L&T Technology Services
L-3 Communications
L-3 Technologies
La Caisse des Dépôts
LaSalle Capital
Lindsay Goldberg LLC.
LinQuest Corporation
LiveTV
Lockheed Martin
LOMO
Loral
Maryland Aerospace Inc., Spaceflight Industries
Mitsubishi Electric Corporation
Nantero Inc’s
Narus
NASA
NATO
ND Satcom GmbH
Netasq
NetNearU Corp.
Northrop Grumman Corporation
Oberkochen
OHB Systems GmbH
OpenHydro
Orange Participations
Orbital ATK
Pacific Defence Solutions LLC
Parter Capital Group AG
Poseidon Scientific Instruments Pty Ltd
Procerus Technologies, L.C.
QTC Holdings Inc
Quantum Industries S.à.r.l.,
Raytheon Company
RUAG
SafeNet Inc’s
Salzburg München Bank AG
Satrec Initiative
SES
Sikorsky Aircraft
Solutions made Simple Inc
Space and Naval Warfare Systems Command (SPAWAR)
Space Engineering SpA, Rome
Space Exploration Technologies Corporation
SpaceQuest Ltd
Speedcast
Sputnix
SSL (formerly Space Systems/Loral, LLC)
Sysgo AG
Systems Engineering & Assessment Limited
Tampa Microwave
Telespazio
Teligy Inc,
Thales
Thales Alenia Space
Thales-Raytheon Systems Co. Ltd
The Aerospace Corp.
the United Arab Emirates Air Force (UAEAF)
Trusted Computer Solutions Inc
TsSKB-Progress
U.S. Air Force
U.S. Army
U.S. Army Intelligence and Security Command (INSCOM)
U.S. Army's Space and Missile Defense Command/Army Forces Strategic Command (USASMDC/ARSTRAT)
U.S. Navy
United Launch Services, LLC
United Technologies Corporation
University of New South Wales (UNSW)
US Department of Defense (DoD)
Vector Aerospace Corporation
Veritas Capital
ViaSat
Visiona
Visionix
Visual Analytics Inc
Vought Aircraft Industries
Zeta
Organisations Mentioned
Association of the United States Army (AUSA)
Australian Defence Force
British Army
Chinese Aerospace Science and Technology Corporation
French Armed Forces
French Ministry of Defence
Georgia Tech Research Institute
German Bundeswehr
Indian Air Force
Indian Armed Forces
Indian Space Research Organisation
International Security Assistance Force (ISAF)
Israel Space Agency
Italian Navy
North Atlantic Treaty Organisation (NATO)
People’s Liberation Army (PLA)
Philippine Army
The Tank Automotive Research, Development and Engineering Center (TARDEC)
UK Ministry of Defence (MoD)
US Air Force (USAF)
US Army
US Department of Defense
US Joint Improvised Explosive Device Defeat Organisation (JIEDDO)
US Marine Corps (USMC)
US National Guard
US Navy
Download sample pages
Complete the form below to download your free sample pages for Military Satellites Market Report 2018-2028
Related reports
-

Military Hyperspectral Imaging Market Forecast 2019-2029
The $3075.3mn (2019) Hyperspectral Imaging market is expected to flourish in the next few years because of rising adoption of...Full DetailsPublished: 19 December 2018 -
Supersonic and Hypersonic Missiles Market Report 2019-2029
The increase in spending in supersonic and hypersonic missile systems by defence departments has led Visiongain to publish this timey...
Full DetailsPublished: 28 February 2019 -
Next Generation Information Technology in Aerospace and Defence Market Report 2018-2028
Read on to discover how this definitive report can transform your own research and save you time.
...Full DetailsPublished: 29 June 2018 -

Critical Infrastructure Protection (CIP) Market Report 2018-2028
Our 304 page report provides 198 tables, charts, and graphs. Read on to discover the most lucrative areas in the...
Full DetailsPublished: 28 June 2018 -
Military Radar System Market Report 2019-2029
The Global Military Radar System Market is expected to reach US$ 12.23bn in 2019, up 2.09% from 2018. ...Full DetailsPublished: 25 February 2019 -

Top 20 Companies Developing Commercial Electric Aircraft 2020
Commercial Electric Aircraft spending to grow at a double digit rate over the forecast period.
...Full DetailsPublished: 23 January 2020 -
Military Sensor Fusion Market Forecast 2019-2029
The $ 204 million military sensor fusion market is expected to flourish in the next few years because of rising...Full DetailsPublished: 26 November 2018 -
Australian Defence Market Report 2019-2029
Where is the Australian Defence market heading? If you are involved in this sector you must read this brand new...Full DetailsPublished: 16 May 2019 -

US Border Security Market Report 2019-2029
This report is essential reading for you or anyone in the aerospace and defence sector with an interest in Border...
Full DetailsPublished: 29 November 2018 -

Top 15 Small Satellite Companies 2019
The global Top 15 Small Satellite Companies 2019 provides the reader with a thorough overview of the competitive landscape in...Full DetailsPublished: 23 January 2019
Download sample pages
Complete the form below to download your free sample pages for Military Satellites Market Report 2018-2028
Do you have any custom requirements we can help you with?
Any specific country, geo region, market segment or specific company information?
Email us today, we can discuss your needs and see how we can help: jamie.roberts@visiongain.com
Would you like a free report overview of the report of your choice?
If so, please drop an email to Jamie Roberts stating your chosen report title to jamie.roberts@visiongain.com
Visiongain defence reports are compiled using a broad and rich mixture of both primary and secondary information to produce an overall industry outlook. In order to provide our clients with the best product possible, Visiongain analysts reach out to market-leading vendors and industry experts and review a wealth of financial data and product information from a vast range of sources. To find out more about our reports methodology, please email jamie.roberts@visiongain.com
Would you like to get the latest Visiongain defence reports catalogue?
What are the dynamic growth sectors? where are the regional business opportunities?
Which technologies will prevail and who are the leading companies succeeding in these sectors and why?
If you want definitive answers to business critical questions, discover Visiongain’s full range of business intelligence reports.
If so, please email Jamie Roberts on jamie.roberts@visiongain.com or call her today on +44 207 336 6100
ADS Group
Aerial Refueling Systems Advisory Group
Aerospace and Defence Industries Association of Nova Scotia
Aerospace Industries Association
Aerospace Industries Association of Canada
AHS International – The Vertical Flight Technical Society
Air Force Association
Aircraft Electronics Association
Airlift/Tanker Association
American Astronautical Society
American Gear Manufacturers Association
American Institute of Aeronautics and Astronautics
American Logistics Association
American Society of Naval Engineers
AMSUS – The Society of the Federal Health Agencies
Armed Forces Communications and Electronics Association
Armed Forces Communications and Electronics Association
Army Aviation Association of America
ASD – Aerospace & Defence Association of Europe
Association for Unmanned Vehicle Systems International
Association of Aviation Manufacturers of the Czech Republic
Association of Naval Aviation
Association of Old Crows
Association of Polish Aviation Industry
Association of the Defense Industry of the Czech Republic
Association of the United States Army
Association of the United States Navy
Australia Defence Association
Australian Industry & Defence Network
Australian Industry Group Defence Council
Austrian Aeronautics Industries Group
Aviation Distributors and Manufacturers Association
Aviation Suppliers Association
Belgian Security and Defence Industry
Bulgarian Defence Industry Association
Business Executives for National Security
Canadian Association of Defence and Security Industries
Conference of Defense Associations
Council of Defense and Space Industry Associations
Danish Defence & Security Industries Association
Defence Industry Manufacturers Association
Defense Industry Initiative on Business Ethics and Conduct
Defense Industry Offset Association
Defense Orientation Conference Association
Deutsche Gesellschaft fur Wehrtechnik
Federal Association of the German Security and Defence Industry
Federation of Aerospace Enterprises in Ireland
French Aerospace Industries Association
French Land Defence Manufacturers Association (GICAT)
German Aerospace Industries Association
Helicopter Association International
Hellenic Aerospace & Defense Industries Group
Homeland Security & Defense Business Council
International Stability Operations Association
Japan Association of Defense Industry
Korea Defense Industry Association
Marine Corps Association & Foundation
National Aeronautic Association
National Association of Ordnance and Explosive Waste Contractors
National Defense Industrial Association
National Defense Transportation Association
National Guard Association of the U.S.
Navy League of the United States
Netherlands Aerospace Group
New Zealand Defence Industry Association
Portuguese Association of Defense Related Industries & New Technologies Companies
Québec Ground Transportation Cluster
Satellite Industry Association
Society of American Military Engineers
South African Aerospace Maritime and Defence Industries Association
Spanish Aerospace and Defence Association Industries
Submarine Industrial Base Council
Swedish Aerospace Industries
Swedish Security and Defence Industry Association
Swiss Aeronautical Industries Group
The Association of Finnish Defence and Aerospace Industries
The Italian Industries Association for Aerospace Systems and Defence
The Netherlands Defence Manufacturers Association
The Society of Japanese Aerospace Companies
UK AeroSpace, Defence & Security Industries
United Kingdom National Defence Association
Latest Defence news
Visiongain Publishes Directed Energy Weapons (DEW) Market Report 2024-2034
The global Directed Energy Weapons (DEW) market was valued at US$6.4 billion in 2023 and is projected to grow at a CAGR of 19.6% during the forecast period 2024-2034.
26 February 2024
Visiongain Publishes Military Embedded Satellite Systems Market Report 2024-2034
The global Military Embedded Satellite Systems market is projected to grow at a CAGR of 8.7% by 2034
21 February 2024
Visiongain Publishes Military Simulation, Modelling and Virtual Training Market Report 2024-2034
The global military simulation, modelling and virtual training market was valued at US$13.2 billion in 2023 and is projected to grow at a CAGR of 8.3% during the forecast period 2024-2034.
15 February 2024
Visiongain Publishes Military Armoured Vehicle Market Report 2024-2034
The global Military Armoured Vehicle market was valued at US$36,123.6 million in 2023 and is projected to grow at a CAGR of 3.6% during the forecast period 2024-2034.
07 February 2024
