1. Report Overview
1.1 Land Seismic Equipment & Acquisition Market Overview
1.2 Market Structure Overview and Market Definition
1.3 Why You Should Read This Report
1.4 How This Report Delivers
1.5 Key Questions Answered by This Analytical Report Include:
1.6 Who is This Report For?
1.7 Methodology
1.7.1 Primary Research
1.7.2 Secondary Research
1.7.3 Market Evaluation & Forecasting Methodology
1.8 Frequently Asked Questions (FAQ)
1.9 Associated Visiongain Reports
1.10 About Visiongain
2. Introduction to the The Land Seismic Equipment & Acquisition Market
2.1 The Land Seismic Equipment Market Structure
2.2 The Land Seismic Acquisition Market Structure
2.3 Land Seismic Industry Outlook
2.4 Types of Land Seismic Equipment and Acquisition
2.4.1 Land Seismic Acquisition Methods
2.4.2 Land Seismic Equipment
2.5 Land Seismic Market Seasonality
2.6 Marine Seismic
2.7 Shallow Water Transition Zone (SWTZ) Seismic
2.8 Exploration Phase Seismic versus Production Phase Seismic
2.9 Multi Client Seismic Services (MCS)
2.10 Shale Resource Development and Land Seismic Acquisition
2.11 Enhanced Oil Recovery and Production Stage Seismic
2.12 Liquefying Natural Gas to Monetise Onshore Gas Reserves
3.Global Overview of Land Seismic Equipment & Acquisition Market
3.1 Global Overview of Land Seismic Equipment Market
3.1.1 Land Seismic and Equipment Driver and Restraints
3.2 Global Overview of Land Seismic Acquisition Market
3.2.1 Land Seismic Acquisition Driver and Restraints
4. Land Seismic Equipment Submarkets Forecasts 2016-2027
4.1 Global Land Seismic Equipment Submarkets Forecasts, by Type 2016-2027
4.1.1 Global Sensors Forecasts 2016-2027
4.1.1.1 Global Sensors Drivers and Restraints
4.1.2 Global Sources Forecasts 2016-2027
4.1.2.1 Global Sources Drivers and Restraints
4.1.3 Global Cable Based Acquisition Systems Forecasts 2016-2027
4.1.3.1 Global Cable Based Acquisition Systems Drivers and Restraints
4.1.4 Global Wireless Acquisition Systems Forecasts 2016-2027
4.1.5 Global Other Equipment Forecasts 2016-2027
5. Leading Regional Market Forecasts 2017-2027
5.1 Land Seismic Acquisition, Market Attractiveness Analysis, 2016
5.2 North America Land Seismic Acquisition Market Forecast 2017-2027
5.2.1 North America Land Seismic Acquisition Market Forecast
5.2.2 North America Land Seismic Acquisition Market Analysis
5.3 Asia Pacific Land Seismic Acquisition Market Forecast 2017-2027
5.3.1 Asia Pacific Land Seismic Acquisition Market Forecast
5.3.2 Asia Pacific Land Seismic Acquisition Market Analysis
5.4 Middle East Land Seismic Acquisition Market Forecast 2017-2027
5.4.1 Middle East Land Seismic Acquisition Market Forecast
5.4.2 Middle East Land Seismic Acquisition Market Analysis
5.5 Russia/CIA Land Seismic Acquisition Market Forecast 2017-2027
5.5.1 Russia/CIA Land Seismic Acquisition Market Forecast
5.5.2 Russia/CIA Land Seismic Acquisition Market Analysis
5.6 Africa Land Seismic Acquisition Market Forecast 2017-2027
5.6.1 Africa Land Seismic Acquisition Market Forecast
5.6.2 Africa Land Seismic Acquisition Market Analysis
5.7 South America Land Seismic Acquisition Market Forecast 2017-2027
5.7.1 South America Land Seismic Acquisition Market Forecast
5.7.2 South America Land Seismic Acquisition Market Analysis
5.8 Europe Land Seismic Acquisition Market Forecast 2017-2027
5.8.1 Europe Land Seismic Acquisition Market Forecast
5.8.2 Europe Land Seismic Acquisition Market Analysis
6. PESTEL Analysis of the Land Seismic Equipment & Acquisition Market
7. Expert Opinion
7.1 Primary Correspondents
7.2 Land Seismic Equipment & Acquisition Outlook
7.4 Driver & Restraints
7.3 Dominant Region/Country
7.4 Land Seismic Equipmen Scenario
7.5 Overall Growth Rate, Globally
8. Leading Companies in the Land Seismic Market
8.1 Tesla Exploration Ltd.
8.2 SAExploration
8.3 Terraseis
8.4 Sercel
8.5 Terrex Seismic
8.6 WesternGeco (a Subsdiary of Schlumberger)
8.7 Mitcham Industries
8.8 International Seismic Co. (iSeis)
8.9 ION Geophysical Corporation
8.10 Geometrics
8.11 Geospace Technologies
8.12 INOVA
8.13 PASI srl
8.14 ARGAS
8.15 BGP
8.16 Baoding Longet Equipment Co., Ltd.
8.17 CGG
8.18 Geokinetics
8.19 Other Land Seismic Companies
9. Conclusion & Recommendations
10. Glossary
Associated Visiongain Reports
Visiongain Report Sales Order Form
Appendix A
About Visiongain
Appendix B
Visiongain report evaluation form
List of Tables
Table 1.1 The Land Seismic Acquisition Market by Regional Market Forecast 2017-2027 ($bn, AGR %, CAGR)
Table 2.1 Land Seismic Source Type Advantages / Disadvantages, (Explosives, Vibroseis)
Table 3.1 Global Land Seismic Equipment Market Forecast 2017-2027 ($ mn, AGR %, CAGR %, Cumulative)
Table 3.2 Global Land Seismic Equipment Drivers and Restraints
Table 3.3 Global Land Seismic Acquisition Market Forecast 2016-2027 ($ mn, AGR %, CAGR %, Cumulative)
Table 3.4 Global Land Seismic Acquisition Drivers and Restraints
Report Overvi
Table 4.1 Global Land Seismic Equipment Market Forecast 2016-2027($mn, AGR %, Cumulative)
Table 4.2 Global Sensors Forecast 2016-2027($mn, AGR %, CAGR %, Cumulative)
Table 4.3 Global Sensors Drivers and Restraints
Table 4.4 Global Sources Forecast 2016-2027($mn, AGR %, CAGR %, Cumulative)
Table 4.5 Global Small Scale Liquefaction Drivers and Restraints
Table 4.6 Global Cable Based Acquisition Systems Forecast 2016-2027($mn, AGR %, CAGR %, Cumulative)
Table 4.7 Global Cable Based Acquisition Systems Drivers and Restraints
Table 4.8 Global Wireless Acquisition Systems Forecast 2016-2027($mn, AGR %, CAGR %, Cumulative)
Table 4.9 Global Other Equipment Forecast 2016-2027($mn, AGR %, CAGR %, Cumulative)
BVF1. Report Overvi
Table 5.1 Global Land Seismic Acquisition Market, by Region Forecast 2017-2027 ($mn, AGR %, Cumulative)
Table 5.2 North America Land Seismic Acquisition Market Forecast, 2017-2027 ($ mn, AGR %, CAGR%, Cumulative)
Table 5.3 Asia Pacific Land Seismic Acquisition Market Forecast, 2017-2027 ($ mn, AGR %, CAGR%, Cumulative)
Table 5.4 Middle East Land Seismic Acquisition Market Forecast, 2017-2027 ($ mn, AGR %, CAGR%, Cumulative)
Table 5.5 Russia/CIA Land Seismic Acquisition Market Forecast, 2017-2027 ($ mn, AGR %, CAGR%, Cumulative)
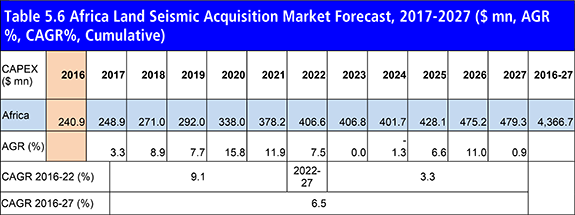
Table 5.6 Africa Land Seismic Acquisition Market Forecast, 2017-2027 ($ mn, AGR %, CAGR%, Cumulative)
Table 5.7 South America Land Seismic Acquisition Market Forecast, 2017-2027 ($ mn, AGR %, CAGR%, Cumulative)
Table 5.8 Europe Land Seismic Acquisition Market Forecast, 2017-2027 ($ mn, AGR %, CAGR%, Cumulative)
Table 6.1 PESTEL Analysis, Land Seismic Equipment & Acquisition Market
Table 8.1 Tesla Exploration Ltd. Profile 2015(Market Entry, Public/Private, Headquarter, Total Company Sales $mn, Change in Revenue, Geography, Key Market, Company Sales from Land Seismic Equipment & Acquisition Market, Listed on, Products/Services Strongest Business Region, Business Segment in the Market, Submarket Involvement, No. of Employees)
Table 8.2 Tesla Exploration Ltd., Exploration Service & Equipment Details
Table 8.3 SAExploration Profile 2015(Market Entry, Public/Private, Headquarter, Total Company Sales $bn, Change in Revenue, Geography, Key Market, Company Sales from Land Seismic Equipment & Acquisition Market, Listed on, Products/Services Strongest Business Region, Business Segment in the Market, Submarket Involvement, No. of Employees)
Table 8.4 SAExploration Services (Category, Type, & Description)
Table 8.5 Terraseis Profile 2015(Market Entry, Public/Private, Headquarter, Total Company Sales $mn, Change in Revenue, Geography, Key Market, Company Sales from Land Seismic Equipment & Acquisition Market, Listed on, Products/Services Strongest Business Region, Business Segment in the Market, Submarket Involvement, No. of Employees)
Table 8.6 Terraseis Seismic Acquisition Equipment
Table 8.7 Terraseis Seismic Acquisition Survey Details (Year, Location, Terrain, Source Type, Size, and 2D/3D)
Table 8.8 Sercel Profile 2015(Market Entry, Public/Private, Headquarter, Total Company Sales $bn, Change in Revenue, Geography, Key Market, Company Sales from Land Seismic Equipment & Acquisition Market, Listed on, Products/Services Strongest Business Region, Business Segment in the Market, Submarket Involvement, No. of Employees)
Table 8.9 Sercel Seismic Acquisition Equipment
Table 8.10 Terrex Seismic Profile 2015(Market Entry, Public/Private, Headquarter, Total Company Sales $mn, Change in Revenue, Geography, Key Market, Company Sales from Land Seismic Equipment & Acquisition Market, Listed on, Products/Services Strongest Business Region, Business Segment in the Market, Submarket Involvement, No. of Employees)
Table 8.11 Terrex Seismic Details
Table 8.12 Terrex Seismic Equipment Details (Type and Model)
Table 8.13 WesternGeco Profile 2015(Market Entry, Public/Private, Headquarter, Total Company Sales US $bn, Change in Revenue, Geography, Key Market, Company Sales from Land Seismic Equipment & Acquisition Market, Listed on, Products/Services Strongest Business Region, Business Segment in the Market, Submarket Involvement, No. of Employees)
Table 8.14 WesternGeco Marine Seismic Fleet (Vessel Name, Year Built or Last Upgraded, Metres Length, Metres Width, No of Streamers, Capability)
Table 8.15 WesternGeco Major Seismic Acquisition Contracts(Client Company, Area, Region, Contract Start, Contract End, Type, Average km/km2, Multi Client)
Table 8.16 WesternGeco Total Company Sales 2011-2015 ($bn, AGR %)
Table 8.17 Mitcham Industries Profile 2015(Market Entry, Public/Private, Headquarter, Total Company Sales $mn, Change in Revenue, Geography, Key Market, Company Sales from Land Seismic Equipment & Acquisition Market, Listed on, Products/Services Strongest Business Region, Business Segment in the Market, Submarket Involvement, No. of Employees)
Table 8.18 Mitchan Industries Total Company Sales 2010-2014 ($mn, AGR %)
Table 8.19 Mitchan Industries Land Seismic Leasing Details (Category, Type, & Model)
Table 8.20 International Seismic Co. Profile 2015(Market Entry, Public/Private, Headquarter, Total Company Sales $mn, Change in Revenue, Geography, Key Market, Company Sales from Land Seismic Equipment & Acquisition Market, Listed on, Products/Services Strongest Business Region, Business Segment in the Market, Submarket Involvement, No. of Employees)
Table 8.21 iSeis-Seismic Source Co. Seismic Acquisition Details
Table 8.22 ION Geophysical Corporation Profile 2015(Market Entry, Public/Private, Headquarter, Total Company Sales $mn, Change in Revenue, Geography, Key Market, Company Sales from Land Seismic Equipment & Acquisition Market, Listed on, Products/Services Strongest Business Region, Business Segment in the Market, Submarket Involvement, No. of Employees)
Table 8.23 ION Geophysical Corporation Total Company Sales 2010-2014 ($mn, AGR %)
Table 8.24 ION Geophysical Corporation Seismic Acquisition Details, (Type, Model, & Description)
Table 8.25 Geometrics Profile 2015(Market Entry, Public/Private, Headquarter, Total Company Sales $mn, Change in Revenue, Geography, Key Market, Company Sales from Land Seismic Equipment & Acquisition Market, Listed on, Products/Services Strongest Business Region, Business Segment in the Market, Submarket Involvement, No. of Employees)
Table 8.26 Geometrics Seismic Acquisition Equipment Details
Table 8.27 Geospace Technologies Profile 2015(Market Entry, Public/Private, Headquarter, Total Company Sales $mn, Change in Revenue, Geography, Key Market, Company Sales from Land Seismic Equipment & Acquisition Market, Listed on, Products/Services Strongest Business Region, Business Segment in the Market, Submarket Involvement, No. of Employees)
Table 8.28 Geospace Technologies Total Company Sales 2012-2016 ($mn, AGR %)
Table 8.29 Geospace Technologies Seismic Acquisition Details
Table 8.30 INOVA Technologies Profile 2015(Market Entry, Public/Private, Headquarter, Total Company Sales $mn, Change in Revenue, Geography, Key Market, Company Sales from Land Seismic Equipment & Acquisition Market, Listed on, Products/Services Strongest Business Region, Business Segment in the Market, Submarket Involvement, No. of Employees)
Table 8.31 INOVA Geophysical Land Seismic Acquisition Details
Table 8.32 PASI srl Technologies Profile 2015(Market Entry, Public/Private, Headquarter, Total Company Sales $mn, Change in Revenue, Geography, Key Market, Company Sales from Land Seismic Equipment & Acquisition Market, Listed on, Products/Services Strongest Business Region, Business Segment in the Market, Submarket Involvement, No. of Employees)
Table 8.33 PASI srl Geophysical Land Seismic Acquisition Details
Table 8.34 ARGAS Profile 2015(Market Entry, Public/Private, Headquarter, Total Company Sales $bn, Change in Revenue, Geography, Key Market, Company Sales from Land Siesmic Equipment & Acquisition Market, Listed on, Products/Services Strongest Business Region, Business Segment in the Market, Submarket Involvement, No. of Employees)
Table 8.35 ARGAS Land Siesmic Projects
Table 8.36 BGP Inc. Profile 2015(Market Entry, Public/Private, Headquarter, Total Company Sales $mn, Change in Revenue, Geography, Key Market, Company Sales from Land Seismic Equipment and Acquisition Market, Listed on, Products/Services Strongest Business Region, Business Segment in the Market, Submarket Involvement, No. of Employees)
Table 8.37 BGP Seismic Services(Service, Model, Description)
Table 8.38 BGP Manufactured Equipment (Model, Description, Features)
Table 8.39 Baoding Longet Equipment Co., Ltd. 2015(Market Entry, Public/Private, Headquarter, Total Company Sales $bn, Change in Revenue, Geography, Key Market, Company Sales from Land Seismic Equipment and Acquisition Market, Listed on, Products/Services Strongest Business Region, Business Segment in the Market, Submarket Involvement, No. of Employees)
Table 8.40 Boading Longet Seismic Acquisition Equipment
Table 8.41 CGG Profile 2015(Market Entry, Public/Private, Headquarter, Total Company Sales $mn, Change in Revenue, Geography, Key Market, Company Sales from Land Seismic Equipment and Acquisition Market, Listed on, Products/Services Strongest Business Region, Business Segment in the Market, Submarket Involvement, No. of Employees)
Table 8.42 Geokinetics Profile 2015(Market Entry, Public/Private, Headquarter, Total Company Sales $mn, Change in Revenue, Geography, Key Market, Company Sales from Land Seismic Equipment and Acquisition Market, Listed on, Products/Services Strongest Business Region, Business Segment in the Market, Submarket Involvement, No. of Employees)
Table 8.43 Geokinetics Services (Service, Type, & Description)
Table 8.44 List of Other Land Seismic Companies
List of Figures
Figure 1.1 The Land Seismic Acquisition Market by Country/Region Market Share Forecast 2017, 2022, 2027 (% Share)
Figure 2.1 Global Land Seismic Equipment Market Segmentation Overview
Figure 2.2 Global Land Seismic Acquisition Market Segmentation Overview
Figure 3.1 Global Land Seismic Equipment Forecast 2017-2027 ($ mn, AGR %)
Figure 3.2 Global Land Seismic Acquisition Forecast 2017-2027 ($ mn, AGR %)
Figure 3.3 Land Seismic Equipment vs Acquisition Market Share Forecast 2017, 2022, 2027 (% Share)
Figure 4.1 Global Land Seismic Equipment Submarket Forecast 2016-2027 ($mn, AGR%)
Figure 4.2 Global Land Seismic Equipment Market by Type Share Forecast 2017, 2022, 2027 (% Share)
Figure 4.3 Land Seismic Equipment Market, By Sensors Forecast 2016-2027 ($mn, AGR%)
Figure 4.4 Land Seismic Equipment Market, By Sources Forecast 2016-2027 ($mn, AGR%)
Figure 4.5 Land Seismic Equipment Market, By Cable Based Acquisition Systems Forecast 2016-2027 ($mn, AGR%)
Figure 4.6 Land Seismic Equipment Market, By Wireless Acquisition System Forecast 2016-2027 ($mn, AGR%)
Figure 4.7 Land Seismic Equipment Market, By Other Equipment Forecast 2016-2027 ($mn, AGR%)
Figure 5.1 Regional Land Seismic Acquisition Market
Figure 5.2 Leading Regional Land Seismic Acquisition Market Share, 2017
Figure 5.3 Leading Regional Land Seismic Acquisition Market Share, 2022
Figure 5.4 Leading Regional Land Seismic Acquisition Market Share, 2027
Figure 5.5 Global Land Seismic Acquisition Market, Market Attractiveness,2016, By Region
Figure 5.6 North America Land Seismic Acquisition Market Forecast 2017-2027 ($mn, AGR %)
Figure 5.7 North America Land Seismic Acquisition Market Share Forecast 2017, 2022, 2027 (% Share)
Figure 5.8 Asia Pacific Land Seismic Acquisition Market Forecast 2017-2027 ($mn, AGR %)
Figure 5.9 Asia Pacific Land Seismic Acquisition Market Share Forecast 2017, 2022, 2027 (% Share)
Figure 5.10 Middle East Land Seismic Acquisition Market Forecast 2017-2027 ($mn, AGR %)
Figure 5.11 Middle East Land Seismic Acquisition Market Share Forecast 2017, 2022, 2027 (% Share)
Figure 5.12 Russia/CIA Land Seismic Acquisition Market Forecast 2017-2027 ($mn, AGR %)
Figure 5.13 Russia/CIA Land Seismic Acquisition Market Share Forecast 2017, 2022, 2027 (% Share)
Figure 5.14 Africa Land Seismic Acquisition Market Forecast 2017-2027 ($mn, AGR %)
Figure 5.15 Africa Land Seismic Acquisition Market Share Forecast 2017, 2022, 2027 (% Share)
Figure 5.16 South America Land Seismic Acquisition Market Forecast 2017-2027 ($mn, AGR %)
Figure 5.17 South America Land Seismic Acquisition Market Share Forecast 2017, 2022, 2027 (% Share)
Figure 5.18 Europe Land Seismic Acquisition Market Forecast 2017-2027 ($mn, AGR %)
Figure 5.19 Europe Land Seismic Acquisition Market Share Forecast 2017, 2022, 2027 (% Share)
Figure 8.1 Tesla Exploration Ltd., % Revenue Share, by Business Segment, 2015
Figure 8.2 Tesla Exploration Ltd., % Revenue Share, by Geographic Segment, 2015
Figure 8.3 SAExploration, % Revenue Share, by Regional Segment, 2016
Figure 8.4 SAExploration, % Revenue Share, by Country Segment, 2016
Figure 8.5 WesternGeco,Revenue,($bn& AGR %), 2011-2015
Figure 8.6 WesternGeco Revenue %Share,by Business Segment, 2015
Figure 8.7 WesternGeco Revenue %Share,by Regional Segment, 2015
Figure 8.8 Mitchan Industries Revenue %Share,by Regional Segment, 2014
Figure 8.9 Mitchan Industries Revenue %Share,by Business Segment, 2014
Figure 8.10 Mitchan Industries Revenue,($mn & AGR %), 2010-2015
Figure 8.11 ION Geophysical Corporation Revenue %Share,by Sales Type Segment, 2016
Figure 8.12 ION Geophysical Corporation Revenue %Share,by Business Segment, 2016
Figure 8.13 ION Geophysical Corporation Revenue %Share,by Regional Segment, 2016
Figure 8.14 ION Geophysical Corporation Revenue,($mn & AGR %), 2014-2016
Figure 8.15 Geospace Technologies Revenue %Share,by Business Segment, 2016
Figure 8.16 Geospace Technologies Revenue %Share,Seismic vs Non-Seismic, 2016
Figure 8.17 Geospace Technologies Revenue %Share,by Regional Segment, 2016
Figure 8.18 Geospace Technologies Revenue,($mn & AGR %), 2012-2016
Figure 9.1 Global Land Seismic Acquisition Market Forecast 2017-2027 ($ mn, AGR %)
Figure 9.2 Global Marine Seismic Equipment Submarket Forecast 2017-2027 ($mn, AGR%)