What can be expected from the Indian Pharmaceutical market? Which areas are going to grow at the fastest rates? This visiongain report shows you potential revenues to 2028, assessing data, trends, opportunities and prospects there.
Our 188-page report provides 104 tables, charts, and graphs. Discover the most lucrative areas in the industry and the future market prospects. Our new study lets you assess forecasted sales across the whole of the Indian pharmaceutical market. You will see financial results, trends, opportunities, and revenue predictions. There is much opportunity in this fast moving market.
Forecasts from 2018-2028 and other analyses show you commercial prospects
Besides revenue forecasting to 2028, our new study provides you with recent results, growth rates, and market shares. Discover qualitative analyses (including SWOT and Porter’s Five Forces analysis) and commercial developments.
See revenue forecasts for the leading submarkets and indications
How will submarkets perform to 2028? Our study forecasts revenues in the following Indian Pharmaceutical submarkets:
• Generic Drugs
• Over-The-Counter (OTC) Drugs
• Patented Drugs
• Biosimilars
See revenue forecasts for the leading therapeutic areas
How will leading therapeutic areas perform to 2028? Our study forecasts revenues in therapeutic areas including:
• Infectious disease drugs
• Cardiovascular disease drugs
• Gastro-intestinal drugs
• Respiratory disease
• Pain relief / analgesics
• Diabetes
• Vitamins / Minerals / Nutrients
• Dermatology
• Central Nervous System (CNS)
• Gynaecology
Leading companies and potential for market growth
Overall revenue for the Indian Pharmaceutical market will reach over $28.7bn in 2018, our work forecasts. We predict strong revenue growth through to 2028. An ageing population, increasing access to healthcare and increasing incidence of chronic diseases, especially diabetes and cardiovascular disease, will drive sales to 2028.
Our work analyses the key companies in the market. See visiongain’s analysis of leading companies, including these:
• Sun Pharmaceutical Industries Limited
• Abbott Healthcare Private Limited (Abbott India)
• Cipla Ltd.
• Cadila Healthcare Ltd.
• GlaxoSmithKline Pharmaceuticals Limited (GSK India)
• Pfizer Limited. India
• Lupin Pharmaceuticals, Inc.,
A company profile gives you the following information where available:
• Discussion of a company’s activities and outlook
• Historic revenue, analysis and discussion of company performance
• Analysis of major products currently on the market
• Acquisitions and strategic partnerships
Discover capabilities, progress, and commercial prospects, helping you stay ahead.
What issues will affect the Indian pharmaceutical industry?
Our new report discusses issues and events affecting the Indian pharmaceutical market. You will find discussions, including qualitative analyses:
• Highly diverse market needing strong knowledge of key therapeutic indications
• Changing regulatory landscape challenging new entrants and major market players alike
• Emerging drug types with the potential to reshape the market
You will see discussions of technological, commercial, and economic matters, with emphasis on the competitive landscape and business outlooks.
How the Indian Pharmaceutical Market Forecast 2018-2028 report helps you
In summary, our 188-page report gives you the following knowledge:
• Revenue forecasts to 2028 for the Indian Pharmaceutical market – discover the industry’s prospects, finding promising places for investments and revenues
• Revenue forecasts to 2028 for each major submarket – discover prospects for leading pharmaceutical products in the following areas: Infectious disease drugs, Cardiovascular disease drugs, Gastro-intestinal drugs, Respiratory disease, Pain relief / analgesics, Diabetes, Vitamins / Minerals / Nutrients, Dermatology, Central Nervous System (CNS), Gynaecology
• Revenue forecasts to 2028 for the leading drug types – generics, OTC products, patented drugs and biosimilars
• Assessment of leading companies – analysis of products, revenue, mergers & acquisitions, sales by region, therapeutic area and product type
• Discussion of what stimulates and restrains companies and the market
• Prospects for established firms and those seeking to enter the market
You will find quantitative and qualitative analyses with independent predictions. You will receive information that only our report contains, staying informed with this invaluable business intelligence.
Information found nowhere else
With our survey you are less likely to fall behind in knowledge or miss opportunity. See how you could benefit your research, analyses, and decisions. Also see how you can save time and receive recognition for commercial insight.
Visiongain’s study is for everybody needing commercial analyses for the Molecular Diagnostics market and leading companies. You will find data, trends and predictions. Please order our report now.
Visiongain is a trading partner with the US Federal Government
CCR Ref number: KD4R6
1. Report Overview
1.1 The Indian Pharmaceutical Market Overview
1.2 Indian Pharmaceutical Market Segmentation
1.3 Why You Should Read This Report
1.4 How This Report Delivers
1.5 Key Questions Answered by This Analytical Report
1.6 Who is This Report For?
1.7 Methodology
1.8 Frequently Asked Questions (FAQ)
1.9 Associated Reports
1.10 About Visiongain
2. Indian Healthcare: Overview
2.1 India: Demographic Indicators Overview
2.2 Indian Healthcare System: Overview
2.2.1 Rashtriya Swasthya Bima Yojana – Bringing Healthcare Coverage to India’s Poorest Workers
2.3 Analysis of India’s Healthcare Expenditure
2.4 State Bodies Regulating the Indian Pharmaceutical Market
2.4.1 The Drugs and Cosmetics Act, 1940
3. Indian Pharmaceutical Market: Discussions and Predictions 2018-2028
3.1 Indian Pharmaceutical Market: The Third Biggest Market in the World by Volume, 2015
3.2 Indian Pharmaceutical Market: Overall Revenue Forecast 2018-2028
4. Medical Treatment Needs in India, 2018-2028
4.1 Disease Prevalence in India, 2018-2028
4.2 Disease Incidence in India, 2018-2028
4.3 Disease Mortality Rates in India, 2018-2028
4.3.1 Top Causes of Death in India
4.3.2 Top Causes of Death in India: Mortality Projections, 2018-2028
5. Indian Pharmaceutical Market: Leading Therapeutic Areas, 2018-2028
5.1 Leading Therapeutic Areas in the Indian Pharmaceutical Market: Overview, 2015
5.2 Indian Pharmaceutical Market: Leading Therapeutic Areas Forecasts, 2018-2028
5.3 Infectious Disease Drugs: Overview, 2015
5.3.1 Infectious Disease Drugs Market: Forecast, 2018-2028
5.3.2 Diarrheal Diseases Responsible for Over Half a Million Annual Deaths, 2015
5.3.3 Lower Respiratory Tract Infections Among Leading Causes of Death
5.3.4 Tuberculosis Still Rife in India
5.3.5 Malaria, Risk and Opportunity
5.3.6 HIV in India: Growing Therapeutic Area Worth Watching
5.3.7 Drivers and Restraints for the Infectious Diseases Pharmaceutical Segment, 2018-2028
5.4 Cardiovascular Therapeutic Segment: Overview, 2017
5.4.1 Cardiovascular Disease – India’s Leading Cause of Death, 2017
5.4.2 Cardiovascular Drugs Market: Forecast, 2018-2028
5.4.3 Drivers and Restraints for the Indian Cardiovascular Drugs Market, 2018-2028
5.5 Gastro-Intestinal Therapeutic Segment: Overview, 2015
5.5.1 Gastro-Intestinal Drugs Market: Forecast, 2018-2028
5.5.2 Gastro-Intestinal Drugs in India: Challenges and Opportunities
5.5.3 Drivers and Restraints for the Gastro-Intestinal Drugs Segment, 2017
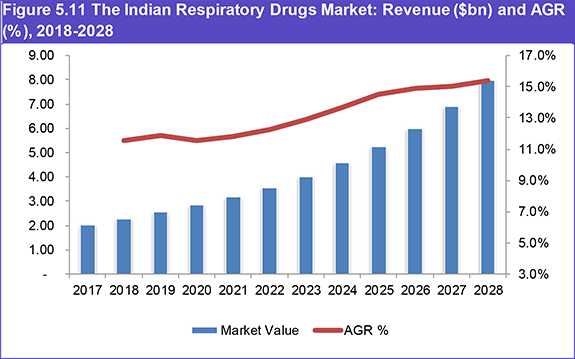
5.6 Respiratory Therapeutic Segment: Overview, 2017
5.6.1 Respiratory Disease Drugs Market: Forecast, 2018-2028
5.6.2 Drivers and Restraints for the Respiratory Diseases Segment, 2017
5.7 Pain Relief / Analgesics Therapeutic Segment: Overview, 2017
5.7.1 Pain Relief / Analgesics Drugs Market: Forecast, 2018-2028
5.7.2 Drivers and Restraints for the Pain Relief / Analgesics Drugs Segment, 2017
5.8 Diabetes Therapeutic Segment: Overview, 2017
5.8.1 Diabetes Drugs Market: Forecast, 2018-2028
5.8.2 Drivers and Restraints for the Diabetes Drugs Segment, 2017
5.9 Vitamins / Minerals / Nutrients Therapeutic Segment: Overview, 2017
5.9.1 Vitamins / Minerals / Nutrients Drugs Market: Forecast, 2018-2028
5.9.2 Vitamins / Minerals / Nutrients in India: Challenges and Opportunities
5.9.3 Drivers and Restraints for the Vitamins / Minerals / Nutrients Drugs Segment, 2017
5.10 Dermatological Therapeutic Segment: Overview, 2017
5.10.1 Dermatological Drugs Market: Forecast, 2018-2028
5.10.2 Drivers and Restraints for the Dermatological Drugs Segment, 2017
5.11 Central Nervous System (CNS) Therapeutics: Overview, 2015
5.11.1 CNS Drugs Market: Forecast, 2018-2028
5.11.2 Intentional Injury Among the Top 10 Leading Causes of Death, 2017
5.11.3 India’s Aging Population: Driver for the CNS Segment
5.11.4 Drivers and Restraints for the CNS Drugs Segment, 2017
5.12 Gynaecological Treatment Market Overview: 2017
5.12.1 Infant Mortality Still High in India
5.12.2 Indian Gynaecological Treatments Market: Forecast, 2018-2028
5.12.3 Drivers and Restraints for the Gynaecological Segment, 2017
5.13 Other Pharmaceutical Products Market Overview: 2017
5.13.1 Incidence of Cancer in India is Rising
5.13.2 Indian Other Treatments Market: Forecast, 2018-2028
6. Indian Pharmaceutical Market: Leading Drug Types, 2018-2028
6.1 Drug Types in the Indian Market: Overview, 2017
6.2 Growth Forecasts for Leading Drug Types in India, 2018-2028
6.3 Generic Drugs Dominate the Indian Pharmaceutical Market
6.3.1 Indian Generics: Overview, 2017
6.3.2 Indian Generic Drugs Market: Forecast, 2018-2028
6.3.3 Branded Generics Preferred by Many Indian Patients
6.3.4 Drivers and Restraints for the Generic Drug Market in India, 2017
6.4 Indian Over-The-Counter (OTC) Drugs Market: Overview, 2017
6.4.1 Indian OTC Market: Forecast, 2018-2028
6.4.2 Drivers and Restraints of the Indian OTC Market
6.5 Indian Patented Drugs Market: Overview, 2017
6.5.1 Indian Patented Drugs Market: Forecasts, 2018-2028
6.5.2 Drivers and Restraints for the Indian Patented Drugs Market
6.6 Indian Biosimilar Drugs, 2017
6.6.1 Indian Biosimilar Drugs Market: Forecast, 2018-2028
6.6.2 A Number of Blockbuster Drugs Coming Off-Patent Over the Next Decade
6.6.3 Drivers and Restraints of the Indian Biosimilar Drugs Market
7. The Leading Companies in the Indian Pharmaceutical Market, 2018-2028
7.1 Indian Pharmaceutical Market Overview
7.1.1 Indian Pharmaceutical Patent Law and the Effect on Big Pharmaceutical Companies
7.2 Top 50 Domestic Indian Pharmaceutical Companies, 2017
7.3 Sun Pharmaceuticals Industries Limited
7.3.1 Sun Pharma: Global Presence
7.3.1.1 Sun Pharmaceutical Sales by Region, 2017
7.3.2 Sun Pharmaceuticals Business Performance 2008-2017
7.3.3 Sun Pharmaceutical: The Acquisition of Ranbaxy Laboratories is the Largest Ever Deal Made by an Indian Pharmaceutical Company
7.3.3.1 Other Major M&A Activity
7.4 Abbott Healthcare Private Limited (Abbott India)
7.4.1 Abbott India: Business Performance 2007-2017
7.4.3 Abbott India: Major and Recent M&A Activity
7.5 Cipla Ltd.
7.5.1 Cipla: Business Performance 2006-2015
7.6 Cadila Healthcare Limited
7.6.1 Cadila: Business Performance 2008-2017
7.6.2 Cadila Healthcare Revenue by Therapeutic Area 2017
7.7 GlaxoSmithKline Pharmaceuticals Limited
7.7.1 GlaxoSmithKline India: Business Performance 2008-2017
7.8 Pfizer Limited. India
7.8.1 Pfizer India: Business Performance 2008-2017
7.9 Lupin
7.9.1 Lupin: Business Performance 2008-2017
7.9.2 Lupin Revenue by Therapeutic Area, 2017
8. Qualitative Analysis of the Indian Pharmaceutical Market, 2015
8.1 Indian Pharmaceutical Market: Drivers and Restraints
8.2 SWOT Analysis of the Indian Pharmaceutical Market, 2018-2028
8.3 Strengths
8.3.1 Increasing Investment in the Healthcare System
8.3.2 The Disease Burden and GDP Both Growing
8.3.3 India’s Population Set to Become the World’s Largest by 2030
8.3.4 India Popular for Pharmaceutical Outsourcing
8.4 Weaknesses
8.4.1 Stringent Pricing Regulations Hit the Indian Pharmaceutical Market
8.4.2 Poor Infrastructure Threatens to Hinder Market Potential
8.4.3 Intense Competition Driving Down Drug Prices
8.5 Opportunities
8.5.1 Global Demand for Generics Rising
8.5.2 National Rural Health Mission Driving Healthcare Access in Rural Areas
8.5.3 Significant Investment from MNCs Expected
8.5.4 Innovative Biotechnology Sector Set to Capitalise on Patent Expiries
8.6 Threats
8.6.1 Rise of Other Low-Cost Generic Exporters
8.6.2 Will the Indian Government Stick to Increasing Healthcare Expenditure?
8.6.3 Recent Warnings and Export Bans from Regulatory Bodies Hit Confidence in Indian Pharmaceuticals
8.7 Porter’s Five Forces Analysis of the Indian Pharmaceutical Market
8.7.1 Rivalry Among Competitors [High]
8.7.2 Threat of New Entrants [Low]
8.7.3 Power of Suppliers [Medium]
8.7.4 Power of Buyers [High]
8.7.5 Threat of Substitutes [Low]
9. Conclusion
9.1 The Indian Pharmaceutical Market: Growing Global Market Share
9.2 Indian Pharmaceutical Market: Chronic Diseases Becoming Increasingly Prevalent
9.3 Commercial Drivers of the Indian Pharmaceutical Market
9.4 Commercial Restraints of the Indian Pharmaceutical Market
9.5 Concluding Remarks
10. Glossary
Associated Visiongain Reports
Visiongain Report Sales Order Form
Appendix A
About Visiongain
Appendix B
Visiongain report evaluation form
List of Figures
Figure 1.1 Indian Pharmaceutical Market: Overview of Submarkets
Figure 2.1 Indian Population: Rural and Urban Populations (Mn),1960-2020
Figure 2.2 Indian Population: Total Population (Mn) and Annual Population Growth Rate (%), 1960-2020
Figure 2.3 Indian GDP ($bn) and GDP growth (%), 2010-2020
Figure 2.4 Access to Improved Water Sources as a Proportion of Total Population (%) and Access to Improved Sanitation as a Proportion of Total Population (%), 2006-2015
Figure 2.5 Indian GDP ($bn) and Health Expenditure as a Proportion of GDP (%), 2006-2013
Figure 2.6 Health Expenditure: Public Health expenditure as a Proportion of Total Health Expenditure (%) and Out of Pocket Expenditure as a Proportion of Private Health Expenditure 2008-2014
Figure 3.1 The Indian Pharmaceutical Market: Revenue ($bn) and AGR (%), 2018-2028
Figure 4.1 Leading Causes of Death in India, Proportion of Total Deaths (%) 2014
Figure 5.1 Leading Therapeutic Areas in the Indian Pharmaceutical Market: Market Share (%), 2017
Figure 5.2 Leading Therapeutic Areas in the Indian Pharmaceutical Market: Market Share (%), 2023
Figure 5.3 Leading Therapeutic Areas in the Indian Pharmaceutical Market: Market Share (%), 2028
Figure 5.4 The Infectious Disease Drugs Market: Revenue ($bn) and AGR (%), 2018-2028
Figure 5.5 Malaria cases (m), P. falciparum cases (m) and Proportion of P. falciparum cases (%) in India, 1995-2014
Figure 5.6 Infectious Disease Market in India: Drivers and Restraints, 2018-2028
Figure 5.7 The Indian Cardiovascular Drugs Market: Revenue ($bn) and AGR (%), 2018-2028
Figure 5.8 Cardiovascular Drugs Market in India: Drivers and Restraints, 2018-2028
Figure 5.9 The Indian Gastro-Intestinal Drugs Market: Revenue ($bn) and AGR (%), 2018-2028
Figure 5.10 Gastro-intestinal Drugs Market in India: Drivers and Restraints, 2018-2028
Figure 5.11 The Indian Respiratory Drugs Market: Revenue ($bn) and AGR (%), 2018-2028
Figure 5.12 Respiratory Drugs Market in India: Drivers and Restraints, 2018-2028
Figure 5.13 The Indian Pain Relief / Analgesics Drugs Market: Revenue ($bn) and AGR (%), 2018-2028
Figure 5.14 Pain Relief / Analgesics Drugs Market in India: Drivers and Restraints, 2018-2028
Figure 5.15 The Indian Diabetes Drugs Market: Revenue ($bn) and AGR (%), 2018-2028
Figure 5.16 Diabetes Drugs Market in India: Drivers and Restraints, 2018-2028
Figure 5.17 The Indian Vitamins / Minerals / Nutrients Drugs Market: Revenue ($bn) and AGR (%), 2018-2028
Figure 5.18 Vitamins / Minerals / Nutrients Market in India: Drivers and Restraints, 2018-2028
Figure 5.19 The Indian Dermatological Drugs Market: Revenue ($bn) and AGR (%), 2018-2028
Figure 5.20 Dermatological Drugs Market in India: Drivers and Restraints, 2018-2028
Figure 5.21 The Indian CNS Drugs Market: Revenue ($bn) and AGR (%), 2018-2028
Figure 5.22 CNS Drugs Market in India: Drivers and Restraints, 2018-2028
Figure 5.23 The Indian Gynaecological Drugs Market: Revenue ($bn) and AGR (%), 2018-2028
Figure 5.24 Gynaecological Drugs Market in India: Drivers and Restraints, 2018-2028
Figure 5.25 The Indian Other Drugs Market: Revenue ($bn) and AGR (%), 2018-2028
Figure 6.1 Leading Drug Types in the Indian Pharmaceutical Market: Market Share (%), 2017
Figure 6.2 Leading Drug Types in the Indian Pharmaceutical Market: Market Share (%), 2023
Figure 6.3 Leading Drug Types in the Indian Pharmaceutical Market: Market Share (%), 2028
Figure 6.4 The Indian Generic Drug Market: Revenue ($bn) andAGR(%), 2018-2028
Figure 6.5 Generic Drug Market in India: Drivers and Restraints, 2018-2028
Figure 6.6 The Indian OTC Drug Market: Revenue ($bn) and AGR (%), 2018-2028
Figure 6.7 OTC Drug Market in India: Drivers and Restraints, 2018-2028
Figure 6.8 The Indian Patented Drugs Market: Revenue ($bn)andAGR(%), 2018-2028
Figure 6.9 Patented Drugs Market in India: Drivers and Restraints, 2018-2028
Figure 6.10 The Indian Biosimilar Drugs Market: Revenue ($bn) andAGR (%), 2018-2028
Figure 6.11 Biosimilar Drug Market in India: Drivers and Restraints, 2018-2028
Figure 7.1 Sun Pharmaceuticals: Revenue Share (%) by Business Area, FY2017
Figure 7.2 Sun Pharmaceuticals: Revenue ($m) and AGR (%), 2008-2017
Figure 7.3 Abbott India: Revenue (Rsm) and AGR (%), 2006-2017
Figure 7.4 Cipla Revenue (Rs.m) and AGR (%), 2008-2017
Figure 7.5 Cadila Healthcare Ltd.: Revenue (Rs. m) and AGR (%), 2008-2017
Figure 7.6 Cadila Healthcare Ltd.: Revenue Share (%) by Business Area, 2017
Figure 7.7 GlaxoSmithKline India: Revenue ($m) and AGR (%), 2007-2017
Figure 7.8 Pfizer India: Revenue (Rs.m) and AGR (%), 2006-2015
Figure 7.9 Lupin: Revenue (Rs.m) and AGR (%), 2008-2017
Figure 7.10 Lupin: Revenue Share (%) by Therapeutic Area, 2017
Figure 8.1 Indian Pharmaceutical Market: Drivers and Restraints, 2018-2028
Figure 8.2 Porter’s Five Forces Analysis of the Indian Pharmaceutical Market, 2018-2028
List of Tables
Table 1.1 Rupee to Dollar Historical Exchange Rates 2006-2015
Table 3.1 The Indian Pharmaceutical Market: Revenue ($bn), AGR (%) and CAGR (%),2018-2028
Table 4.1 Leading Causes of Death in India, Proportion of Total Deaths (%) 2014
Table 4.2 Leading Types of Cancer in India by Age-Standardised Death Rate (per 100,000 People), 2014
Table 4.3 Causes of Death in India by World Ranking, 2014
Table 5.1 Leading Therapeutic Areas in the Indian Pharmaceutical Market: Market Share (%), 2017, 2023, 2028
Table 5.2 The Indian Pharmaceutical Market: Revenue ($bn), AGR (%) and CAGR (%) by Therapeutic Area, 2018-2028
Table 5.2 The Indian Pharmaceutical Market: Revenue ($bn), AGR (%) and CAGR (%) by Therapeutic Area, 2018-2028
Table 5.3 The Infectious Disease Drugs Market: Revenue ($bn), AGR (%) and CAGR (%), 2018-2028
Table 5.4 The Indian Cardiovascular Drugs Market: Revenue ($bn), AGR (%) and CAGR (%), 2018-2028
Table 5.5 The Indian Gastro-Intestinal Drugs Market: Revenue ($bn), AGR (%) and CAGR (%), 2018-2028
Table 5.6 The Indian Respiratory Drugs Market: Revenue ($bn), AGR (%) and CAGR (%), 2018-2028
Table 5.7 The Indian Pain Relief / Analgesics Drugs Market: Revenue ($bn), AGR (%) and CAGR (%), 2018-2028
Table 5.8 The Indian Diabetes Drugs Market: Revenue ($bn), AGR (%) and CAGR (%), 2018-2028
Table 5.9 The Indian Vitamins / Minerals / Nutrients Drugs Market: Revenue ($bn), AGR (%) and CAGR (%), 2018-2028
Table 5.10 The Indian Dermatological Drugs Market: Revenue ($bn), AGR (%) and CAGR (%), 2018-2028
Table 5.11 The Indian CNS Drugs Market: Revenue ($bn), AGR (%) and CAGR (%), 2018-2028
Table 5.12 The Indian Gynaecological Drugs Market: Revenue ($bn), AGR (%) and CAGR (%), 2018-2028
Table 5.13 The Indian Other Drugs Market: Revenue ($bn), AGR (%) and CAGR (%), 2018-2028
Table 6.1 Leading Drug Types in the Indian Pharmaceutical Market: Revenue ($bn) and Market Share (%), 2015, 2020 and 2026
Table 6.10 Selected Late-Stage Biosimilar Pipeline Products, 2015
Table 6.2 The Indian Pharmaceutical Market: Revenue ($bn), AGR (%), CAGR (%) by Drug Type, 2018-2028
Table 6.3 The Indian Generic Drug Market: Revenue ($bn), AGR (%) and CAGR (%) 2018-2028
Table 6.4 The Indian OTC Drug Market: Revenue ($bn), AGR (%) and CAGR (%), 2018-2028
Table 6.5 The Indian Patented Drugs Market: Revenue ($bn), AGR (%) and CAGR (%), 2018-2028
Table 6.6 Selected Biosimilar Therapeutics on the Indian Market, 2017
Table 6.7 Selected Biosimilar Therapeutics on the Indian Market, 2017 (continued)
Table 6.8 The Indian Biosimilar Drugs Market: Revenue ($bn), AGR (%) and CAGR (%), 2018-2028
Table 6.9 Selected Blockbuster Biologic Patent Expiries in the US and EU, 2015-2028
Table 7.1 Top 50 Companies in the Indian Pharmaceutical Market: Revenue (Rs.m), Revenue ($m) and Market Share (%), 2017
Table 7.2 Sun Pharmaceuticals: Revenue (Rs.m), Revenue ($m) and Revenue Share (%) by Business Area, FY2017
Table 7.3 Sun Pharmaceuticals: Revenue (Rs.m), AGR (%) and CAGR (%), 2008-2017
Table 7.4 Sun Pharmaceuticals: M&A Activity, 1997-2016
Table 7.5 Abbott India: Market Share (%) and Market Rank of Key Brands
Table 7.6 Abbott India: Revenue (Rs.m), AGR (%) and CAGR (%), 2006-2017
Table 7.7 Cipla: Total Revenue (Rs.m), AGR (%) and CAGR (%), 2008-2017
Table 7.8 Cipla: Revenue (Rs.m), Revenue ($m) and Revenue Share (%) by Geographical Area, 2017
Table 7.9 Cadila Healthcare Ltd.: Total Revenue (Rs.m), Total Revenue ($m), AGR (%) and CAGR (%), 2008-2016
Table 7.10 Cadila Healthcare Ltd.: Revenue (Rs.m) and Revenue Share (%) by Therapeutic Area, 2017
Table 7.11 GlaxoSmithKline India: Key Products in the Indian Market, 2017 (continued)
Table 7.11 GlaxoSmithKline India: Key Products in the Indian Market, 2017
Table 7.12 GlaxoSmithKline India Total Revenue (Rs.m), AGR (%) and CAGR (%), 2007-2017
Table 7.13 Pfizer India: Leading Brands on the Indian Market 2017
Table 7.14 Pfizer India: Total Revenue (Rs.m),AGR (%) and CAGR (%), 2008-2017
Table 7.15 Lupin: Total Revenue (Rs.m), AGR (%) and CAGR (%), 2006-2015
Table 7.16 Lupin: Revenue Share (%) by Therapeutic Area, 2017
Table 8.1 SWOT Analysis of the Indian Pharmaceutical Market, 2018-2028